Обзор
Основная идея этой стратегии заключается в том, чтобы искать линию K-позиции, не имеющую верхней линии, в качестве сигнала для покупки, и продавать позиции, когда цена опускается ниже предыдущего нижнего уровня K-линии. Эта стратегия использует эту особенность, что линейка K-позиций на линейке K-позиции небольшая, чтобы показать, что многосторонние силы сильны, и вероятность продолжения роста цены на акции выше. В то же время, предыдущая низкая линия K-линии в качестве стоп-позиции может эффективно контролировать риск.
Стратегический принцип
- Определить, является ли текущая линия K линией позиции K ((Цена закрытия выше, чем цена открытия)
- Рассчитайте пропорцию длины провода на текущей K-линии к длине объекта K-линии
- Если коэффициент верхнего провода меньше 5%, считается эффективным без верхнего провода смотреть на K-провода, подавать сигнал купить
- Запись минимальной цены на первую K-линию после покупки в качестве стоп-лосса
- Выход из позиции, когда цена переваливает за пределы остановки
Стратегические преимущества
- Выбрав линейку K без привязки, вы получите более сильную тенденцию и более высокий уровень успеха.
- Используйте предыдущую низкую точку K-линии в качестве остановки, чтобы контролировать риск
- Логика проста, легко реализована и оптимизирована
- Подходит для использования в трендовых ситуациях
Стратегический риск
- Возможно возникновение ситуации, когда сразу после сигнала покупки происходит отзыв, который вызывает остановку убытков
- Для высоко волатильных сортов, стоп-позиции могут быть установлены слишком близко к цене покупки, что приводит к преждевременному потере
- Отсутствие целевых показателей прибыли, затруднение в определении наилучшего момента для снижения позиций
Направление оптимизации стратегии
- В сочетании с другими индикаторами, такими как MA, MACD и т. Д., может подтверждать силу тренда, повышая эффективность входного сигнала
- Для высоковолновых сортов можно установить остановку в более отдаленном месте, например, в самой низкой точке передней N-корневой линии K, чтобы уменьшить частоту остановки
- Введение целевых показателей прибыли, таких как N-кратный ATR или процент прибыли, чтобы своевременно закрепить прибыль
- Подумайте о том, чтобы включить управление позициями, например, изменение размеров позиций в зависимости от силы сигнала
Подвести итог
Эта стратегия эффективно захватывает прибыль в условиях тренда, используя предыдущую K-линию с низким уровнем остановки. Однако у стратегии есть определенные ограничения, такие как недостаточная гибкость стоп-позиции, отсутствие целевой прибыли и т. Д.
Overview
The main idea of this strategy is to find bullish candles without upper wicks as buy signals and close positions when the price breaks below the low of the previous candle. The strategy utilizes the characteristic of bullish candles with very small upper wicks, indicating strong bullish momentum and a higher probability of continued price increases. At the same time, using the low of the previous candle as a stop-loss level can effectively control risk.
Strategy Principles
- Determine if the current candle is a bullish candle (close price higher than open price)
- Calculate the ratio of the current candle’s upper wick length to its body length
- If the upper wick ratio is less than 5%, consider it a valid bullish candle without an upper wick and generate a buy signal
- Record the lowest price of the previous candle after buying as the stop-loss level
- When the price breaks below the stop-loss level, close the position and exit
Strategy Advantages
- Selecting bullish candles without upper wicks for entry, the trend strength is greater and the success rate is higher
- Using the low of the previous candle as the stop-loss level, risks are controllable
- Simple logic, easy to implement and optimize
- Suitable for use in trending markets
Strategy Risks
- There may be cases where a buy signal is followed by an immediate pullback triggering the stop-loss
- For highly volatile instruments, the stop-loss level may be set too close to the buy price, leading to premature stop-outs
- Lack of profit targets, making it difficult to grasp the optimal exit timing
Strategy Optimization Directions
- Combine with other indicators such as MA, MACD, etc., to confirm trend strength and improve the effectiveness of entry signals
- For highly volatile instruments, set the stop-loss level at a further position, such as the lowest point of the previous N candles, to reduce the stop-loss frequency
- Introduce profit targets, such as N times ATR or percentage gains, to lock in profits in a timely manner
- Consider adding position management, such as adjusting position size based on signal strength
Summary
This strategy captures profits effectively in trending markets by selecting bullish candles without upper wicks for entry and using the low of the previous candle for stop-loss. However, the strategy also has certain limitations, such as inflexible stop-loss placement and lack of profit targets. Improvements can be made by introducing other indicators to filter signals, optimizing stop-loss positions, and setting profit targets to make the strategy more robust and effective.
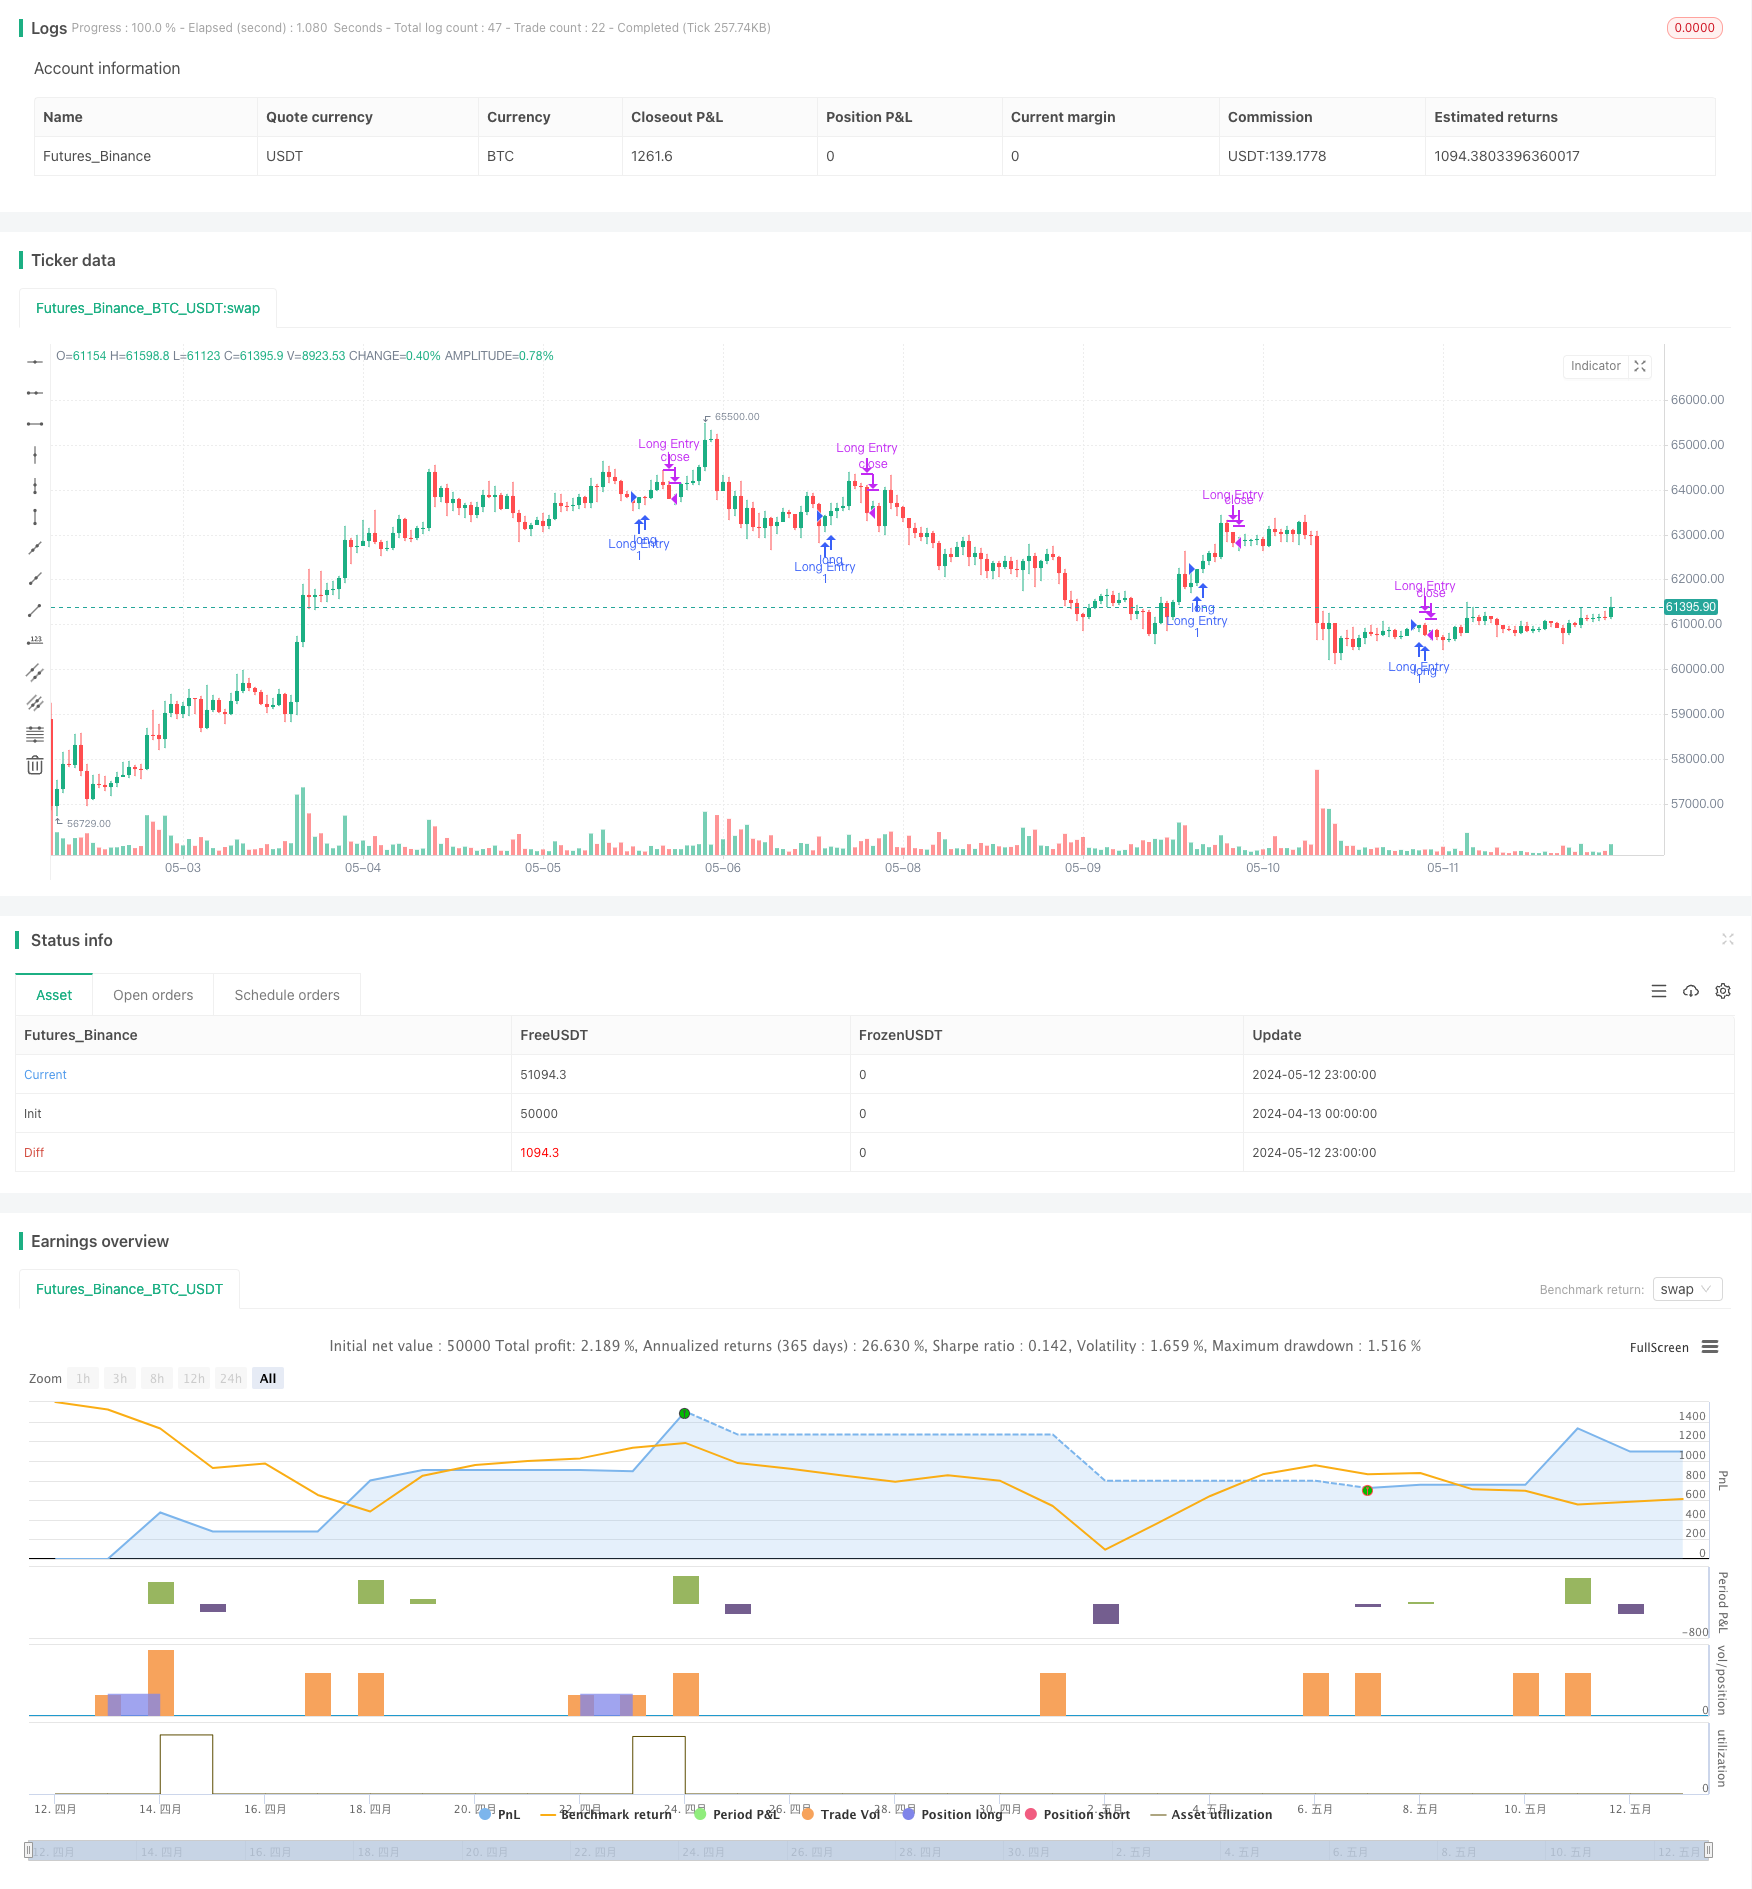
/*backtest
start: 2024-04-13 00:00:00
end: 2024-05-13 00:00:00
period: 1h
basePeriod: 15m
exchanges: [{"eid":"Futures_Binance","currency":"BTC_USDT"}]
*/

// This Pine Script™ code is subject to the terms of the Mozilla Public License 2.0 at https://mozilla.org/MPL/2.0/
// © nagpha

//@version=5
strategy("My strategy", overlay=true, margin_long=100, margin_short=100)

candleBodySize = math.abs(open - close)

// Calculate candle wick size
candleWickSize = high - close

// Calculate percentage of wick to candle body
wickPercentage = (candleWickSize / candleBodySize) * 100

// Check if candle is bullish and wick is less than 1% of the body
isBullish = close > open
isWickLessThan5Percent = wickPercentage < 5


longCondition = isBullish and isWickLessThan5Percent

if (longCondition)
    // log.info("long position taken")
    strategy.entry("Long Entry", strategy.long)

float prevLow = 0.0
prevLow := request.security(syminfo.tickerid, timeframe.period, low[1], lookahead=barmerge.lookahead_on)

float closingPrice = close
//plot(closingPrice, "Close Price", color.purple, 3)
//plot(prevLow, "Previous Low", color.red, 3)
//log.info("Outside: {0,number,#}",closingPrice)
//log.info("Outside: {0,number,#}",prevLow)

if closingPrice < prevLow and strategy.position_size > 0
    //log.info("inside close: {0,number} : {0,number}",closingPrice,prevLow)
    // log.info("position exited")
    strategy.close("Long Entry")
    longCondition := false
    prevLow := 0
    isBullish := false

//plot(series=strategy.position_size > 0 ? prevLow : na, color = color.new(#40ccfb,0), style=plot.style_cross,linewidth = 5)