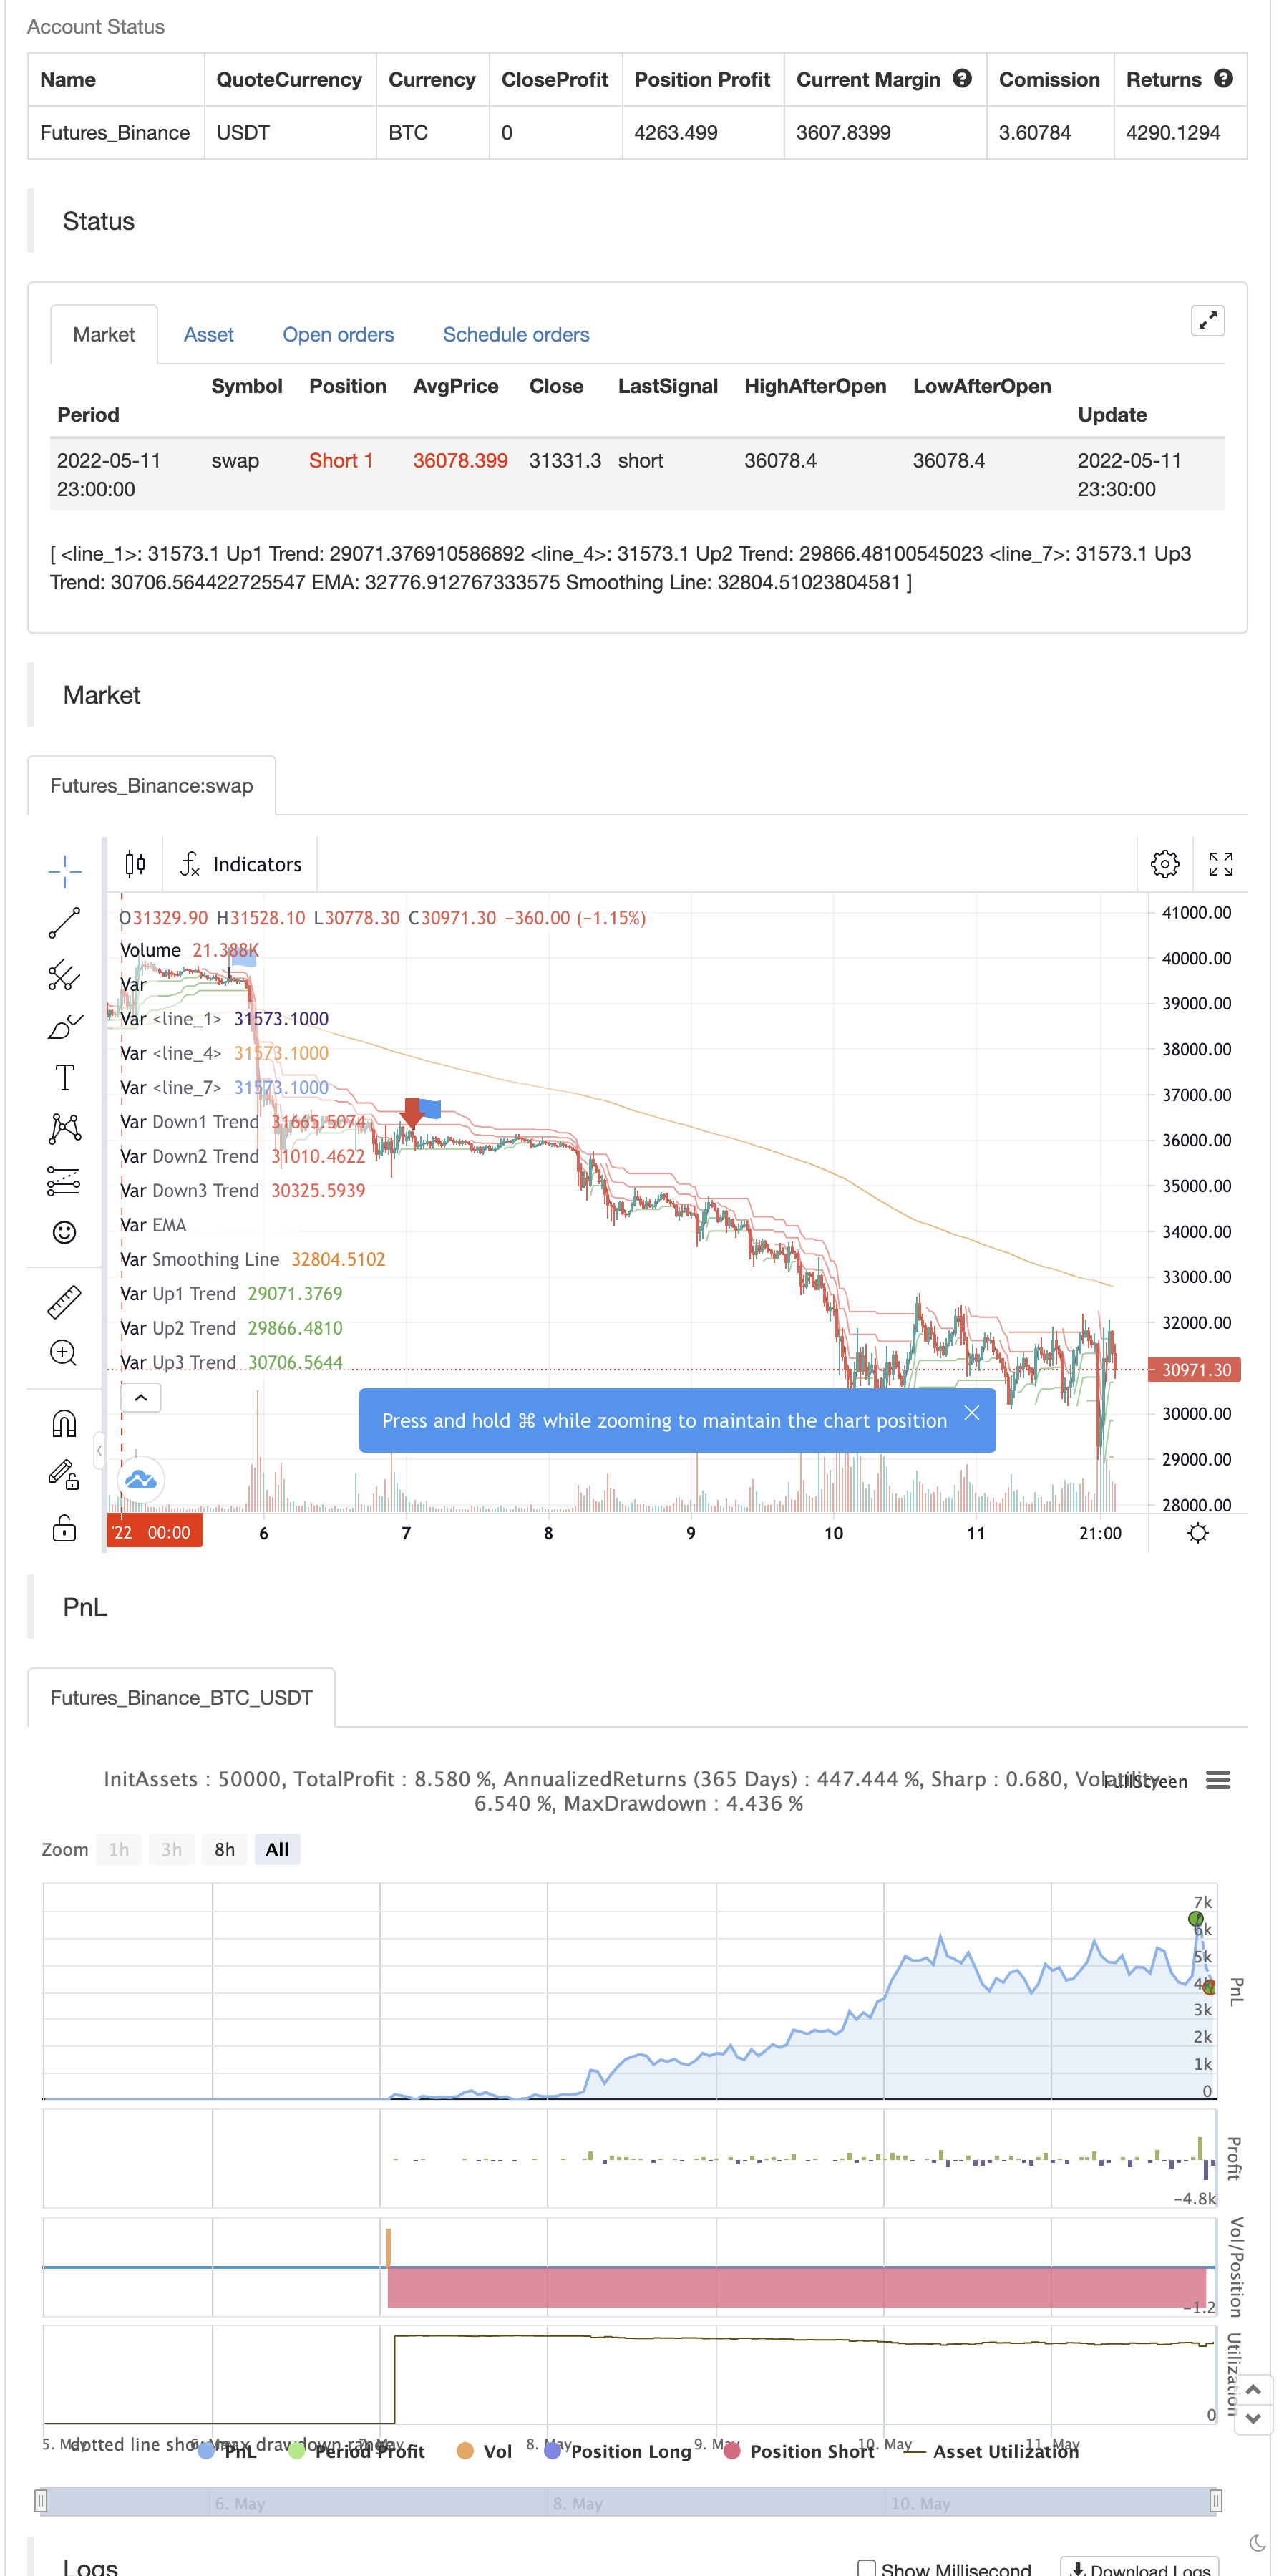
کروڈل کا سپر ٹرینڈ
مصنف:چاؤ ژانگ، تاریخ: 2022-05-13 17:38:34ٹیگز:ایس ایم اےای ایم اےایس ایم ایم اےڈبلیو ایم اےوی ڈبلیو ایم اے
یہ اشارے تصدیق کے طور پر 3 مختلف ان پٹ کے ساتھ سپر رجحان کے ساتھ ساتھ 200 ای ایم اے کا استعمال کر رہا ہے جو ہمیں اوپر یا نیچے کے رجحان کے اعداد و شمار فراہم کرے گا۔ پھر یہ اسٹاک اشارے کی تلاش کر رہا ہے تاکہ تصدیق کی جاسکے کہ کیا لانگ کے لئے 30 سے کم اور شارٹ کے لئے 70 سے زیادہ کراس ہے۔
بیک ٹسٹ

/*backtest
start: 2022-05-05 00:00:00
end: 2022-05-11 23:59:00
period: 30m
basePeriod: 15m
exchanges: [{"eid":"Futures_Binance","currency":"BTC_USDT"}]
*/

// Visit Crodl.com for our Premium Indicators
// https://tradingbot.crodl.com to use our free tradingview bot to automate any indicator.
//@version=5
indicator("Crodl's Supertrend", overlay=true, timeframe="", timeframe_gaps=true)

atrPeriod1 = input(12, "ATR1 Length")
factor1 = input.float(3.0, "Factor1", step = 0.01)

[supertrend1, direction1] = ta.supertrend(factor1, atrPeriod1)

bodyMiddle1 = plot((open + close) / 2, display=display.none)
upTrend1 = plot(direction1 < 0 ? supertrend1 : na, "Up1 Trend", color = color.green, style=plot.style_linebr)
downTrend1 = plot(direction1 < 0? na : supertrend1, "Down1 Trend", color = color.red, style=plot.style_linebr)

atrPeriod2 = input(11, "ATR2 Length")
factor2 = input.float(2.0, "Factor2", step = 0.01)

[supertrend2, direction2] = ta.supertrend(factor2, atrPeriod2)

bodyMiddle2 = plot((open + close) / 2, display=display.none)
upTrend2 = plot(direction2 < 0 ? supertrend2 : na, "Up2 Trend", color = color.green, style=plot.style_linebr)
downTrend2 = plot(direction2 < 0? na : supertrend2, "Down2 Trend", color = color.red, style=plot.style_linebr)

atrPeriod3 = input(10, "ATR3 Length")
factor3 = input.float(1.0, "Factor3", step = 0.01)

[supertrend3, direction3] = ta.supertrend(factor3, atrPeriod3)

bodyMiddle3 = plot((open + close) / 2, display=display.none)
upTrend3 = plot(direction3 < 0 ? supertrend3 : na, "Up3 Trend", color = color.green, style=plot.style_linebr)
downTrend3 = plot(direction3 < 0? na : supertrend3, "Down3 Trend", color = color.red, style=plot.style_linebr)

len = input.int(200, minval=1, title="Length")
src = input(close, title="Source")
offset = input.int(title="Offset", defval=0, minval=-500, maxval=500)
out = ta.ema(src, len)
plot(out, title="EMA", color=color.white,linewidth=2, offset=offset)

ma(source, length, type) =>
    switch type
        "SMA" => ta.sma(source, length)
        "EMA" => ta.ema(source, length)
        "SMMA (RMA)" => ta.rma(source, length)
        "WMA" => ta.wma(source, length)
        "VWMA" => ta.vwma(source, length)

typeMA = input.string(title = "Method", defval = "SMA", options=["SMA", "EMA", "SMMA (RMA)", "WMA", "VWMA"], group="Smoothing")
smoothingLength = input.int(title = "Length", defval = 5, minval = 1, maxval = 100, group="Smoothing")

smoothingLine = ma(out, smoothingLength, typeMA)
plot(smoothingLine, title="Smoothing Line", color=#f37f20, offset=offset, display=display.none)
//////
l = input(13, title='Length')
l_ma = input(7, title='MA Length')
t = math.sum(close > close[1] ? volume * (close - close[1]) : close < close[1] ? volume * (close - close[1]) : 0, l)
m = ta.sma(t, l_ma)


//////
periodK = input.int(14, title="%K Length", minval=1)
smoothK = input.int(1, title="%K Smoothing", minval=1)
periodD = input.int(3, title="%D Smoothing", minval=1)
k = ta.sma(ta.stoch(close, high, low, periodK), smoothK)
d = ta.sma(k, periodD)

stochbuy= float(k) < 30  and ta.crossover(k,d)
stochsell=float(k) > 70  and ta.crossover(d,k)

long =(( ((direction1 < 0 and direction2 < 0 ) or (direction2 < 0  and direction3 < 0 ) and (direction1 < 0 or direction3 < 0 ) )and open > out) and t > 0) and stochbuy
short=(( ((direction1 > 0 and direction2 > 0 ) or (direction2 > 0  and direction3 > 0 ) and (direction1 > 0 or direction3 > 0 ) )and open < out) and t < 0) and stochsell

plotshape(long, title = "Long Signal", location=location.belowbar, style=shape.labelup, color=color.green, textcolor=color.white, size=size.small, text="Long")
plotshape(short, title = "Short Signal", location=location.abovebar, style=shape.labeldown, color=color.red, textcolor=color.white, size=size.small, text="Short")

alertcondition(long, title='Long Signal', message=' Buy')
alertcondition(short, title='Short Signal', message=' Sell')

if long
    strategy.entry("Enter Long", strategy.long)
else if short
    strategy.entry("Enter Short", strategy.short)
متعلقہ مواد
- ایس ایس ایس
- بلنگ بینڈ نے ٹرانزیکشن ٹریکنگ کی حکمت عملی کو توڑا
- ملٹی لیول فلو بینڈ ٹریڈنگ کی حکمت عملی
- RSI Pivot، BB، SMA، EMA، SMMA، WMA، VWMA کے ساتھ اختلاف
- دوہرا یکساں لائن کراس موشن ٹریکنگ کیوٹیفیکیشن کی حکمت عملی
- ملٹی یونیفارم لائن کراس ٹرینڈ ٹریکنگ اور اتار چڑھاؤ فلٹرنگ کی حکمت عملی
- ملٹی سائیکل یونیورسل کراس ٹرینڈ ٹریکنگ کی حکمت عملی
- متحرک اوسط لائن کراسنگ حکمت عملی کو اپنانا
- OCC حکمت عملی R5.1
- 2 حرکت پذیر اوسط رنگ سمت کا پتہ لگانے
مزید معلومات
- بیئر مارکیٹ میں خوش آمدید
- سڈبوس
- پییوٹ پوائنٹس اعلی کم ملٹی ٹائم فریم
- گھوٹالہ رجحانات کی حکمت عملی کا ڈیٹا بیس
- گھوٹالہ رجحانات کی پیروی کرنے کی حکمت عملی
- گھوسٹ ٹرینڈ ٹریکنگ کی حکمت عملی
- رینبو اوسیلیٹر
- ایکویٹی وکر کی پوزیشن سائزنگ مثال کی تجارت
- KLineChart ڈیمو
- وِلا ڈائنامک پِیوٹ سپر ٹرینڈ حکمت عملی
- zdmre کی طرف سے RSI
- FTL - رینج فلٹر X2 + EMA + UO
- برہماسترا
- موبو بینڈ
- SAR + 3SMMA SL & TP کے ساتھ
- ایس ایس ایس
- چاند لانچ الرٹس ٹیمپلیٹ [شاندار]
- HALFTREND + HEMA + SMA (غلط سگنل کی حکمت عملی)
- RSI Pivot، BB، SMA، EMA، SMMA، WMA، VWMA کے ساتھ اختلاف
- آر ایس آئی اور بی بی اور بیک وقت اوور سیلڈ