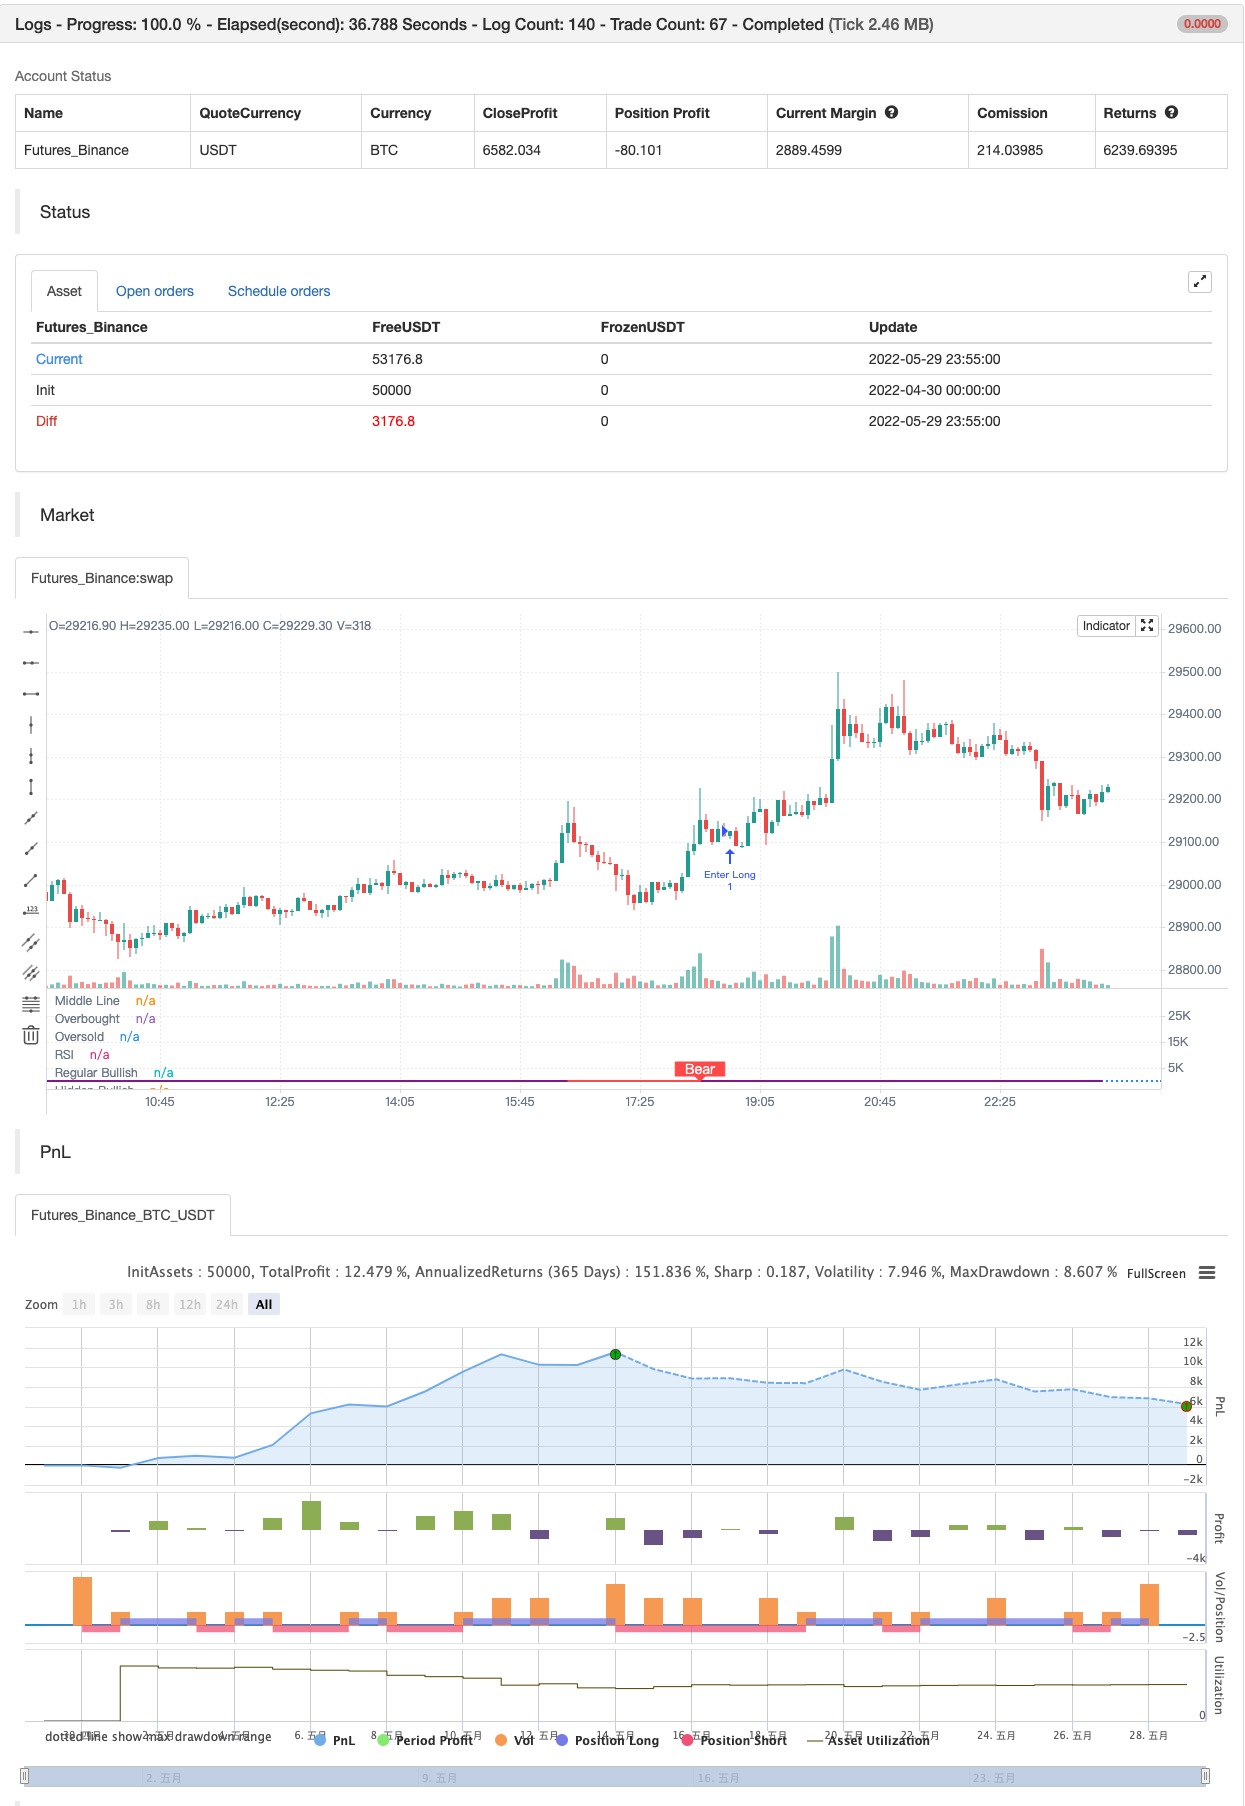
RSI متغیر اشارے
مصنف:چاؤ ژانگ، تاریخ: 2022-05-31 18:54:21ٹیگز:آر ایس آئیمحور
بنیادی کوڈ کے لئے Mohanee کا شکریہ. ہم داخلہ انتباہات دینے کے لئے نہیں بلکہ صرف divs خود پر انتباہ دینے کے لئے اس میں ترمیم کی.
ایک AO div ڈیٹیکٹر کے ساتھ بہت اچھی طرح کام کرتا ہے.
بیک ٹسٹ

/*backtest
start: 2022-04-30 00:00:00
end: 2022-05-29 23:59:00
period: 5m
basePeriod: 1m
exchanges: [{"eid":"Futures_Binance","currency":"BTC_USDT"}]
*/

// This source code is subject to the terms of the Mozilla Public License 2.0 at https://mozilla.org/MPL/2.0/
// © JayTradingCharts

//@version=4
//@version=4
//---- thank to mohanee for the base code. we modified this to not give entries but instead alert on the just the divs
study(title="RSI Divergence Indicator w/Alerts", format=format.price, resolution="")
len = input(title="RSI Period", minval=1, defval=14)
src = input(title="RSI Source", defval=close)
lbR = input(title="Pivot Lookback Right", defval=5)
lbL = input(title="Pivot Lookback Left", defval=5)
rangeUpper = input(title="Max of Lookback Range", defval=60)
rangeLower = input(title="Min of Lookback Range", defval=5)
plotBull = input(title="Plot Bullish", defval=true)
plotHiddenBull = input(title="Plot Hidden Bullish", defval=false)
plotBear = input(title="Plot Bearish", defval=true)
plotHiddenBear = input(title="Plot Hidden Bearish", defval=false)
bearColor = color.red
bullColor = color.green
hiddenBullColor = color.new(color.green, 80)
hiddenBearColor = color.new(color.red, 80)
textColor = color.white
noneColor = color.new(color.white, 100)
osc = rsi(src, len)

plot(osc, title="RSI", linewidth=2, color=#8D1699)
hline(50, title="Middle Line", linestyle=hline.style_dotted)
obLevel = hline(70, title="Overbought", linestyle=hline.style_dotted)
osLevel = hline(30, title="Oversold", linestyle=hline.style_dotted)
fill(obLevel, osLevel, title="Background", color=#9915FF, transp=90)

plFound = na(pivotlow(osc, lbL, lbR)) ? false : true
phFound = na(pivothigh(osc, lbL, lbR)) ? false : true
_inRange(cond) =>
	bars = barssince(cond == true)
	rangeLower <= bars and bars <= rangeUpper

//------------------------------------------------------------------------------
// Regular Bullish
// Osc: Higher Low

oscHL = osc[lbR] > valuewhen(plFound, osc[lbR], 1) and _inRange(plFound[1])

// Price: Lower Low

priceLL = low[lbR] < valuewhen(plFound, low[lbR], 1)
bullCond = plotBull and priceLL and oscHL and plFound

plot(
     plFound ? osc[lbR] : na,
     offset=-lbR,
     title="Regular Bullish",
     linewidth=2,
     color=(bullCond ? bullColor : noneColor),
     transp=0
     )

plotshape(
	 bullCond ? osc[lbR] : na,
	 offset=-lbR,
	 title="Regular Bullish Label",
	 text=" Bull ",
	 style=shape.labelup,
	 location=location.absolute,
	 color=bullColor,
	 textcolor=textColor,
	 transp=0
	 )

//------------------------------------------------------------------------------
// Hidden Bullish
// Osc: Lower Low

oscLL = osc[lbR] < valuewhen(plFound, osc[lbR], 1) and _inRange(plFound[1])

// Price: Higher Low

priceHL = low[lbR] > valuewhen(plFound, low[lbR], 1)
hiddenBullCond = plotHiddenBull and priceHL and oscLL and plFound

plot(
	 plFound ? osc[lbR] : na,
	 offset=-lbR,
	 title="Hidden Bullish",
	 linewidth=2,
	 color=(hiddenBullCond ? hiddenBullColor : noneColor),
	 transp=0
	 )

plotshape(
	 hiddenBullCond ? osc[lbR] : na,
	 offset=-lbR,
	 title="Hidden Bullish Label",
	 text=" H Bull ",
	 style=shape.labelup,
	 location=location.absolute,
	 color=bullColor,
	 textcolor=textColor,
	 transp=0
	 )

//------------------------------------------------------------------------------
// Regular Bearish
// Osc: Lower High

oscLH = osc[lbR] < valuewhen(phFound, osc[lbR], 1) and _inRange(phFound[1])

// Price: Higher High

priceHH = high[lbR] > valuewhen(phFound, high[lbR], 1)

bearCond = plotBear and priceHH and oscLH and phFound

plot(
	 phFound ? osc[lbR] : na,
	 offset=-lbR,
	 title="Regular Bearish",
	 linewidth=2,
	 color=(bearCond ? bearColor : noneColor),
	 transp=0
	 )

plotshape(
	 bearCond ? osc[lbR] : na,
	 offset=-lbR,
	 title="Regular Bearish Label",
	 text=" Bear ",
	 style=shape.labeldown,
	 location=location.absolute,
	 color=bearColor,
	 textcolor=textColor,
	 transp=0
	 )

//------------------------------------------------------------------------------
// Hidden Bearish
// Osc: Higher High

oscHH = osc[lbR] > valuewhen(phFound, osc[lbR], 1) and _inRange(phFound[1])

// Price: Lower High

priceLH = high[lbR] < valuewhen(phFound, high[lbR], 1)

hiddenBearCond = plotHiddenBear and priceLH and oscHH and phFound

plot(
	 phFound ? osc[lbR] : na,
	 offset=-lbR,
	 title="Hidden Bearish",
	 linewidth=2,
	 color=(hiddenBearCond ? hiddenBearColor : noneColor),
	 transp=0
	 )

plotshape(
	 hiddenBearCond ? osc[lbR] : na,
	 offset=-lbR,
	 title="Hidden Bearish Label",
	 text=" H Bear ",
	 style=shape.labeldown,
	 location=location.absolute,
	 color=bearColor,
	 textcolor=textColor,
	 transp=0
	 )


alertcondition(bullCond, title="Bull", message="Regular Bull Div {{ticker}} XXmin")
alertcondition(bearCond, title="Bear", message="Regular Bear Div {{ticker}} XXmin")
alertcondition(hiddenBullCond, title="H Bull", message="Hidden Bull Div {{ticker}} XXmin")
alertcondition(hiddenBearCond, title="H Bear", message="Hidden Bear Div {{ticker}} XXmin")


if bearCond
    strategy.entry("Enter Long", strategy.long)
else if bullCond
    strategy.entry("Enter Short", strategy.short)
متعلقہ مواد
- ملٹی انڈیکیٹرز اسمارٹ پرامڈ حکمت عملی
- رفتار RSI پر مبنی اعلی تعدد ریورس ٹریڈنگ کی حکمت عملی
- RSI متحرک حد میں الٹ کی مقدار کی حکمت عملی اور اتار چڑھاؤ کی شرح کو بہتر بنانے کے ماڈل
- آر ایس آئی اور بی بی اور بیک وقت اوور سیلڈ
- RSI + سپر ٹرینڈ ٹریڈنگ کی حکمت عملی
- آر ایس آئی کی رفتار کو توڑنے کی حکمت عملی سے ہٹایا گیا
- آر ایس آئی کی تبدیلی کی سمت حکمت عملی کو تبدیل کرتی ہے
- RSI نسبتا مضبوط اور کمزور اشاریہ کی حکمت عملی
- رشتہ دار طاقت کا انڈیکس - اختلافات - لبرٹوس
- RSI شماریاتی سودے بازی کی حکمت عملی
مزید معلومات
- ٹوئن رینج فلٹر
- SAR - اعلی اور کم
- درست سوئنگ ٹریڈنگ سسٹم
- لکیری رجحان
- فبونیکی ٹائمنگ پیٹرن
- ڈارواس باکس خریدیں فروخت کریں
- ڈیمارک سیٹ اپ اشارے
- بولنگر بینڈ اسٹوکاسٹک آر ایس آئی انتہائی
- اے کے ایم اے سی ڈی بی بی اشارے V 1.00
- پارابولک SAR
- او بی وی ایم اے سی ڈی اشارے
- محور رجحان
- قیمتوں میں فرق کی حکمت عملی v1.0
- سپورٹ- مزاحمت توڑ
- ڈھلوان موافقت پذیر چلتی اوسط
- ڈیلٹا-آر ایس آئی آسکیلیٹر حکمت عملی
- کم سکینر حکمت عملی کریپٹو
- [بلیک کیٹ] L2 ریورس لیبلز حکمت عملی
- سپر بی
- اعلی کم SAR