概述
该策略结合了相对强弱指数(RSI)和Supertrend两个技术指标,用于捕捉市场趋势和识别潜在的交易机会。策略的主要思路是利用RSI来判断市场的超买和超卖状态,同时使用Supertrend指标来确认趋势方向。当RSI和Supertrend指标同时满足特定条件时,策略会产生买入或卖出信号。
策略原理
- 计算RSI和Supertrend指标的值。
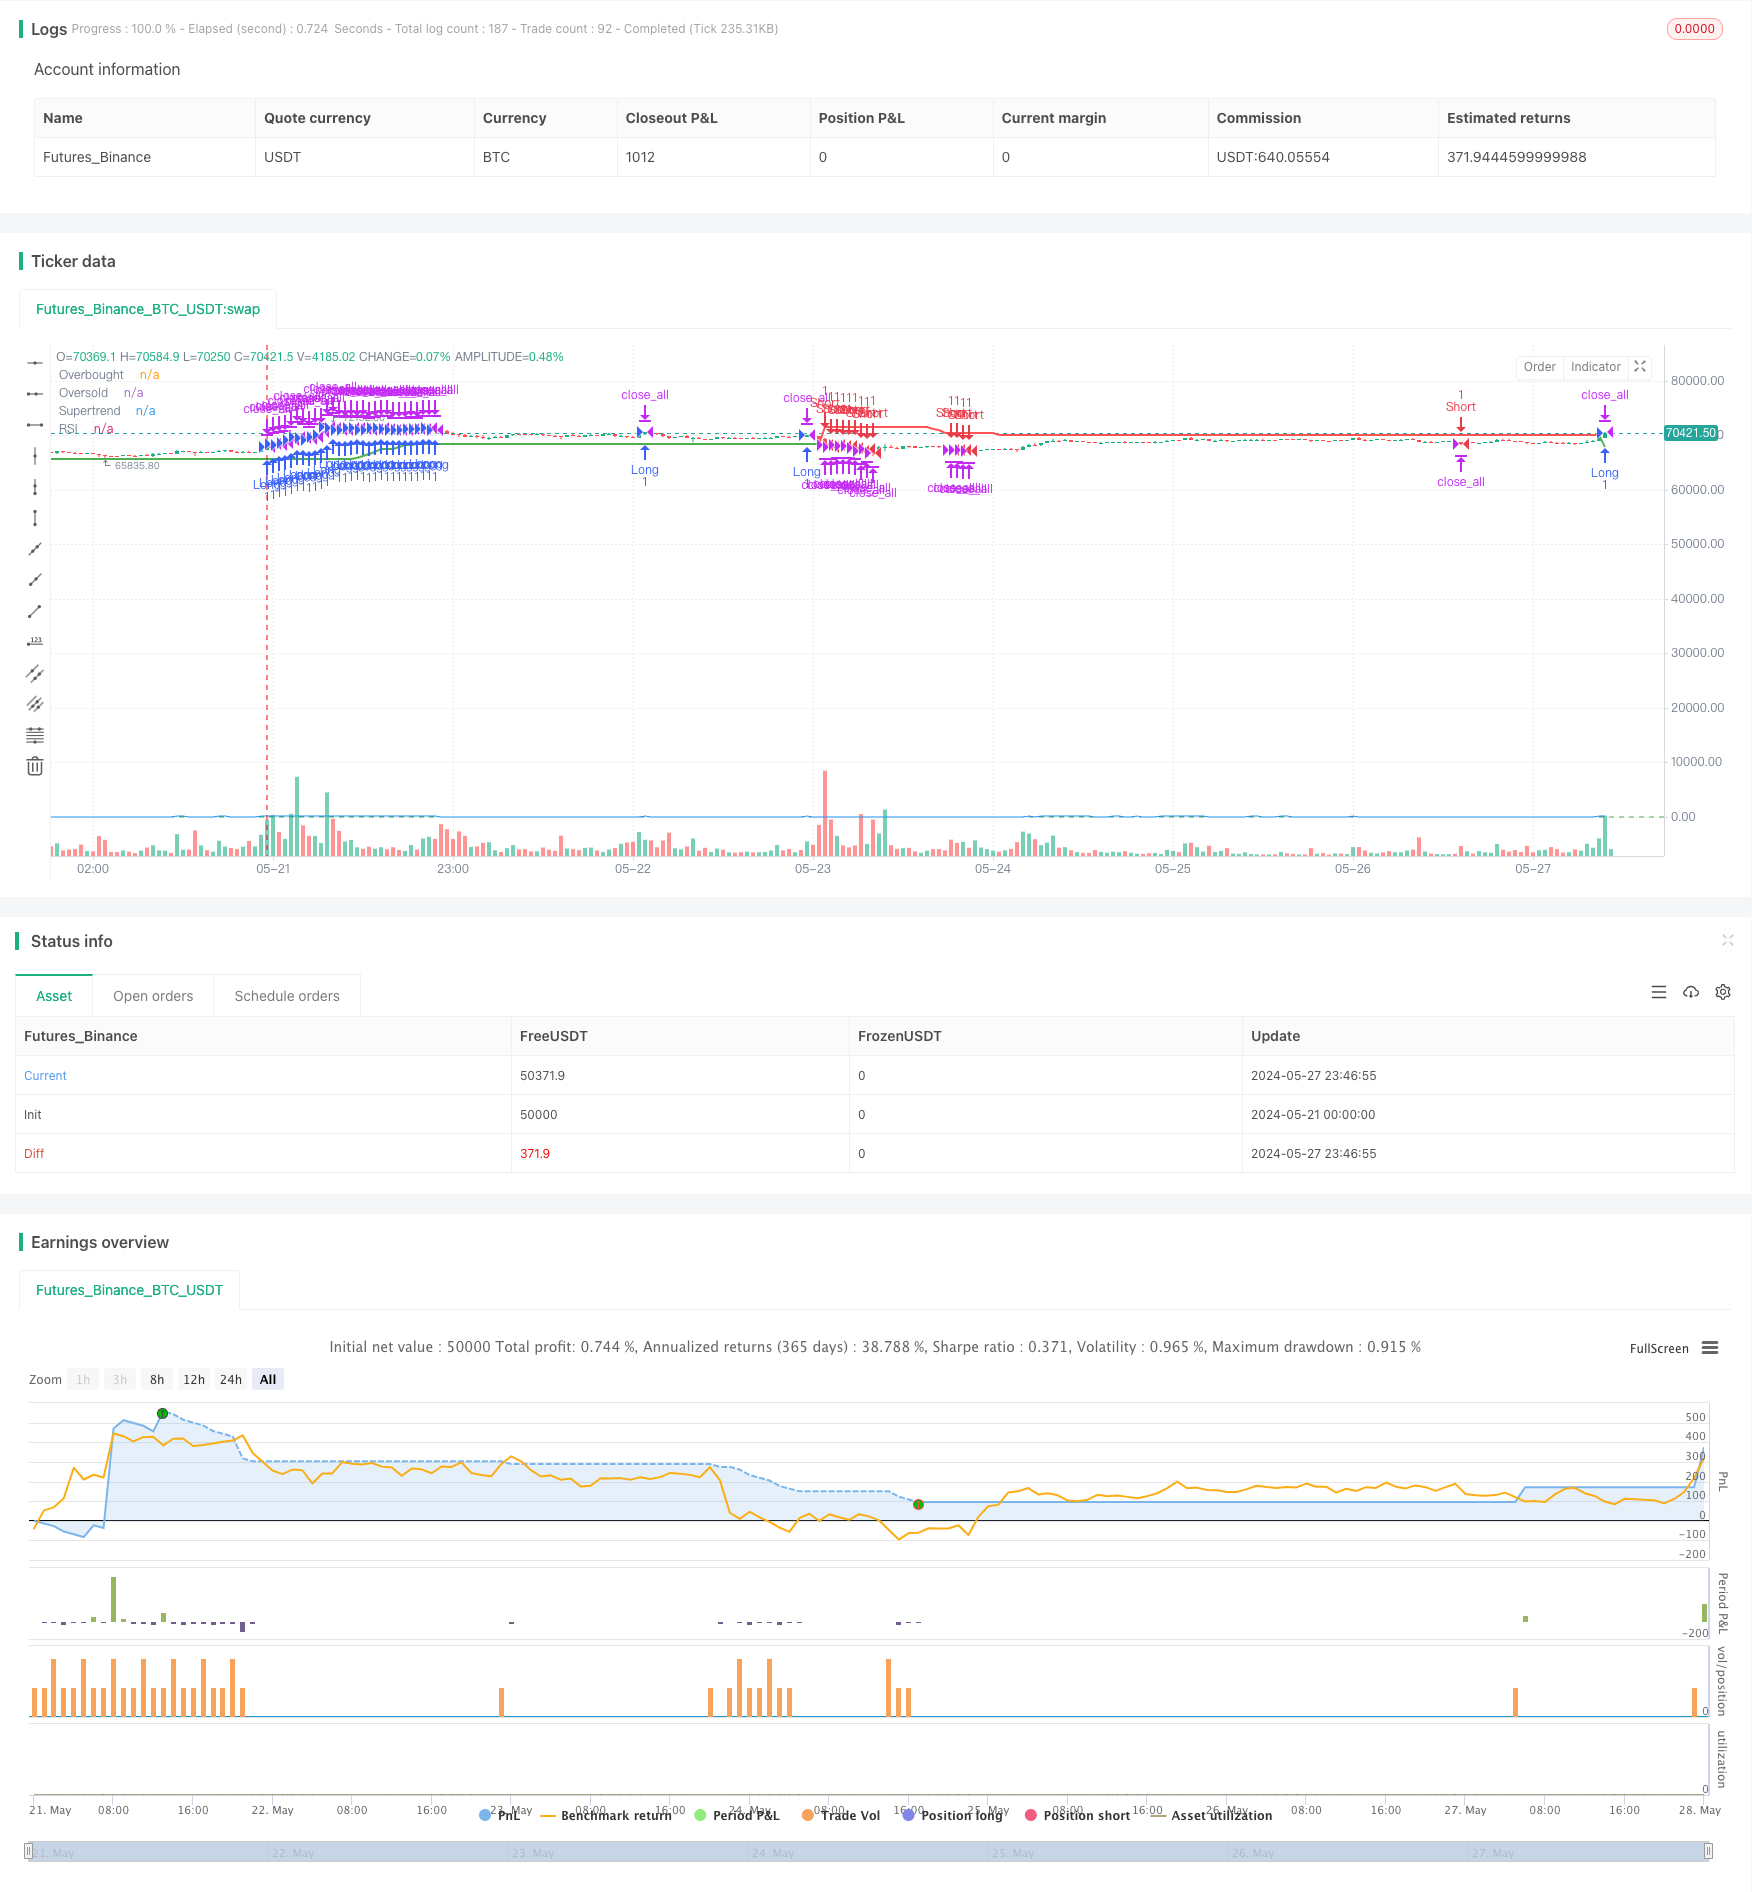
- 当RSI上穿58且Supertrend指标呈现绿色时,产生买入信号,开仓做多。
- 当RSI下穿50且Supertrend指标变为红色时,平掉多头仓位。
- 当RSI下穿38且Supertrend指标呈现红色时,产生卖出信号,开仓做空。
- 当RSI上穿45且Supertrend指标变为绿色时,平掉空头仓位。
优势分析
- 结合了动量指标(RSI)和趋势指标(Supertrend),可以有效捕捉市场趋势。
- RSI可以帮助识别市场的超买和超卖状态,避免在极端情况下进行交易。
- Supertrend指标可以提供明确的趋势方向信号,有助于做出正确的交易决策。
- 策略逻辑清晰,易于理解和实现。
风险分析
- 在震荡市场中,频繁的交易信号可能导致过多的交易次数和手续费成本。
- RSI和Supertrend指标可能产生相互矛盾的信号,导致策略效果下降。
- 策略依赖于固定的参数设置,可能无法适应不同的市场环境。
优化方向
- 考虑引入其他技术指标,如移动平均线,以提高策略的可靠性。
- 对RSI和Supertrend的参数进行优化,以适应不同的市场状况。
- 加入风险管理措施,如止损和仓位管理,以控制潜在的损失。
- 对策略进行回测和实时监控,及时调整策略参数。
总结
RSI+Supertrend趋势跟踪交易策略通过结合RSI和Supertrend两个技术指标,可以有效捕捉市场趋势并产生交易信号。策略的优势在于逻辑清晰,易于实现,同时考虑了动量和趋势因素。然而,策略也存在一些风险,如频繁交易和参数设置的局限性。为了进一步提高策略的性能,可以考虑引入其他指标、优化参数、加强风险管理措施并进行持续的监控和调整。
策略源码
/*backtest
start: 2024-05-21 00:00:00
end: 2024-05-28 00:00:00
period: 45m
basePeriod: 5m
exchanges: [{"eid":"Futures_Binance","currency":"BTC_USDT"}]
*/

//@version=5
strategy("RSI + Supertrend Strategy", overlay=true)

// Input parameters
rsiLength = input.int(14, title="RSI Length")
rsiOverbought = input.int(58, title="RSI Overbought Level")
rsiOversold = input.int(38, title="RSI Oversold Level")

supertrendLength = input.int(10, title="Supertrend Length")
supertrendMultiplier = input.int(3, title="Supertrend Multiplier")

// Calculate indicators
rsiValue = ta.rsi(close, rsiLength)

[supertrend, _] = ta.supertrend(supertrendLength, supertrendMultiplier)

// Plot Supertrend on main chart
plot(supertrend, color = supertrend < close ? color.green : color.red, linewidth = 2, title="Supertrend")

// Plot RSI
hline(rsiOverbought, "Overbought", color.red)
hline(rsiOversold, "Oversold", color.green)
plot(rsiValue, title="RSI", color=color.blue)

// Strategy
var float entryPrice = na

// Long conditions
longCondition = (rsiValue > rsiOverbought) and (supertrend < close)

// Short conditions
shortCondition = (rsiValue < rsiOversold) and (supertrend > close)

// Exit conditions
longExitCondition = (rsiValue < 50) and (supertrend > close)
shortExitCondition = (rsiValue > 45) and (supertrend < close)

// Execute strategy
if (longCondition)
    strategy.entry("Long", strategy.long)
    entryPrice := close

if (shortCondition)
    strategy.entry("Short", strategy.short)
    entryPrice := close

if (longExitCondition and strategy.position_size > 0)
    strategy.close("Long")

if (shortExitCondition and strategy.position_size < 0)
    strategy.close("Short")

// Date and time range for backtest
startDate = timestamp("2023-01-01 00:00")
endDate = timestamp("2024-01-01 00:00")
if (time < startDate or time > endDate)
    strategy.close_all()
相关推荐
- 双指标动量趋势量化策略系统
- 双均线-RSI多重信号趋势交易策略
- 动态均线系统结合RSI动量指标的日内交易优化策略
- 多重技术指标交叉动量趋势跟踪策略
- 动态调整止损的大象柱形态趋势跟踪策略
- 双周期RSI趋势动量强度策略结合金字塔式仓位管理系统
- 多均线交叉辅助RSI动态参数量化交易策略
- 动态趋势判定RSI指标交叉策略
- 多维度K近邻算法与烛台形态的量价分析交易策略
- 自适应多策略动态切换系统:融合趋势跟踪与区间震荡的量化交易策略
- 多指标多维度趋势交叉高级量化策略
更多内容
- 双均线交叉止盈止损策略
- TEMA双均线交叉策略
- 多时间尺度SMA趋势跟踪与动态止损策略
- Bollinger Bands准确入场和风险控制策略
- 基于波动率和动量指标的波林格带+RSI+随机RSI策略
- TURTLE-ATR布林带突破策略
- VWAP与超级趋势买卖策略
- MACD与限制性马丁格尔相结合的高级策略
- Keltner通道EMA ATR策略
- MA MACD BB多指标交易策略回测工具
- Ichimoku Kumo交易策略
- 动态ATR止盈止损移动均线交叉策略
- EMA趋势动量K线形态策略
- G-Channel趋势检测策略
- 均线交叉移动止盈止损策略
- EMA 交叉动态止盈止损交易策略
- 波林格带和EMA趋势跟踪策略
- 波动趋势震荡指标背离策略,
- 基于波动率和回归线的多空市场机制优化策略
- 混合双态Z评分量化策略