ڈبل کنفرمیشن بریک آؤٹ حکمت عملی
جائزہ
اس حکمت عملی میں 4 گھنٹے کے وقت کے دورانیے اور سورج کی لکیر کے وقت کے دورانیے پر بریک سگنل کا امتزاج کیا گیا ہے۔ اس سے زیادہ قابل اعتماد بریک ٹریڈنگ حکمت عملی حاصل کرنے کے لئے تجارتی سگنل جاری کرنے سے پہلے K لائن کی شکل کی جانچ پڑتال کی جاتی ہے۔
حکمت عملی کا اصول
دوہری تصدیق کی بریکآؤٹ حکمت عملی مختصر اور طویل دورانیے کے بریکآؤٹ سگنل کا استعمال کرتے ہوئے ، طویل مدتی رجحانات کی مستقل مزاجی کو مدنظر رکھتے ہوئے ، زیادہ موثر بریکآؤٹ پوائنٹس کی نشاندہی کرتی ہے۔ خاص طور پر ، اس حکمت عملی میں 4 گھنٹے اور دن کی لکیر کے دورانیے پر الگ الگ اوسط کا حساب لگایا جاتا ہے ، جب مختصر دورانیے کی اوسط طویل مدتی اوسط سے ٹوٹ جاتی ہے تو خریدنے کا اشارہ ہوتا ہے ، اور اس کے برعکس توڑنے سے فروخت کا اشارہ ہوتا ہے۔ اس کے علاوہ ، اس حکمت عملی میں تجارتی سگنل جاری کرنے سے پہلے ، موجودہ K لائن کی شکل کی جانچ پڑتال کی جاتی ہے ، تاکہ K لائن پر پوزیشن کھولنے سے بچنے کے لئے۔
مندرجہ بالا دوہری تصدیق اور K لائن فلٹرنگ کے طریقہ کار کے ذریعہ ، تجارت کے سگنل کے معیار کو بہتر بنانے کے لئے ، کثیر سر اسٹاپ یا خالی سر کے بندھے ہوئے خطرے سے مؤثر طریقے سے بچا جاسکتا ہے۔
طاقت کا تجزیہ
ڈبل ٹائم سائیکل توڑنے سے سگنل کی کوالٹی میں اضافہ ہوتا ہے۔ 4 گھنٹے اور دن کی لکیر کا امتزاج ، سگنل کو ایک ساتھ مختصر مدت کے رجحانات کی پیروی کرنے اور طویل مدتی رجحانات کا حوالہ دینے کی صلاحیت فراہم کرتا ہے۔
K لائن شکل کی جانچ پڑتال ، غلط سگنل سے بچنے کے لئے سگنل جاری کرنے سے پہلے شکل کی جانچ پڑتال ، کچھ جھوٹی توڑ پھوڑ یا غیر متحرک توڑ پھوڑ کو فلٹر کرنے کے لئے ، نقصان سے بچنے کے لئے
خود کار طریقے سے اصلاح ، لچکدار اور آسان۔ اس حکمت عملی کے بریک اپ پیرامیٹرز اور سائیکل پیرامیٹرز کو اپنی مرضی کے مطابق ترتیب دیا جاسکتا ہے ، صارف مختلف تجارتی اقسام اور مارکیٹوں کے مطابق بہترین پیرامیٹرز کا مجموعہ منتخب کرسکتا ہے۔
خطرے کا تجزیہ
دوہری توڑنے کی حکمت عملی میں طوفان کے خاتمے کے لئے مارکیٹ کی کم صلاحیت ہے۔ جب قلیل دور اور طویل دور میں شدید تجارت ہوتی ہے تو ، اس حکمت عملی میں بہترین نقطہ نظر سے محروم ہونے کا خطرہ ہوتا ہے۔
K لائن کی شکل کی توثیق کا طریقہ کار کچھ مواقع سے محروم ہوسکتا ہے۔ انتہائی حالات میں K لائن اکثر مسخ ہوتی ہے ، توثیق کا طریقہ کار حکمت عملی کو محفوظ بنا دیتا ہے اور کچھ مواقع سے محروم ہوجاتا ہے۔
غلط پیرامیٹرز بھی غلط سگنل پیدا کرسکتے ہیں۔ صارف کو مخصوص قسم کے مطابق مناسب ڈبل توڑ پیرامیٹرز اور K لائن پیرامیٹرز کا انتخاب کرنے کی ضرورت ہے۔ غلط پیرامیٹرز حکمت عملی کے اثر کو بہت زیادہ چھوٹ دیتے ہیں۔
مذکورہ بالا خطرات کے لئے ، پیرامیٹرز کے مجموعے کو ایڈجسٹ کرنے ، اسٹاپ نقصان کی روک تھام کے حالات قائم کرنے اور اس طرح کے طریقوں سے بہتری اور اصلاح کی جاسکتی ہے۔
اصلاح کی سمت
بیولنگر بینڈس کے دباؤ کے دوران جاری ہونے والے بریک سگنل کے معیار میں اضافہ ہوتا ہے۔
اضافی سٹاپ لاسٹ اسٹاپ ماڈیول۔ مناسب اسٹاپ لاسٹ سیٹنگ منافع کو لاک کرنے اور خطرے سے بچنے کے لئے فعال ہے۔
ڈبل توڑ پیرامیٹرز کو بہتر بنائیں ◄ پیرامیٹرز کو مختلف قسم کے دن کے اندر اتار چڑھاؤ کی شرح ، دن کی لکیری اتار چڑھاؤ کی شرح جیسی خصوصیات کے لئے ایڈجسٹ کیا جاسکتا ہے ◄
K لائن کی توثیق کے پیرامیٹرز کو بہتر بنائیں۔ مختلف دورانیوں اور پیرامیٹرز کے مجموعے کے ساتھ K لائن کی توثیق ، زیادہ مستحکم نتائج حاصل کریں۔
خلاصہ کریں۔
دوہری تصدیق کی کامیابی کی حکمت عملی ، دوہری وقت کی مدت اور K لائن کی شکل کی توثیق کے طریقہ کار کو یکجا کرکے ، فنڈ کی کارکردگی اور سگنل کے معیار کے درمیان موثر توازن حاصل کرتی ہے ، اور یہ ایک سفارش کی گئی شارٹ لائن کامیابی کی حکمت عملی ہے۔ صارف اپنی ضرورت کے مطابق متعلقہ پیرامیٹرز کو بہتر اثر کے ل adjust ایڈجسٹ کرسکتا ہے۔
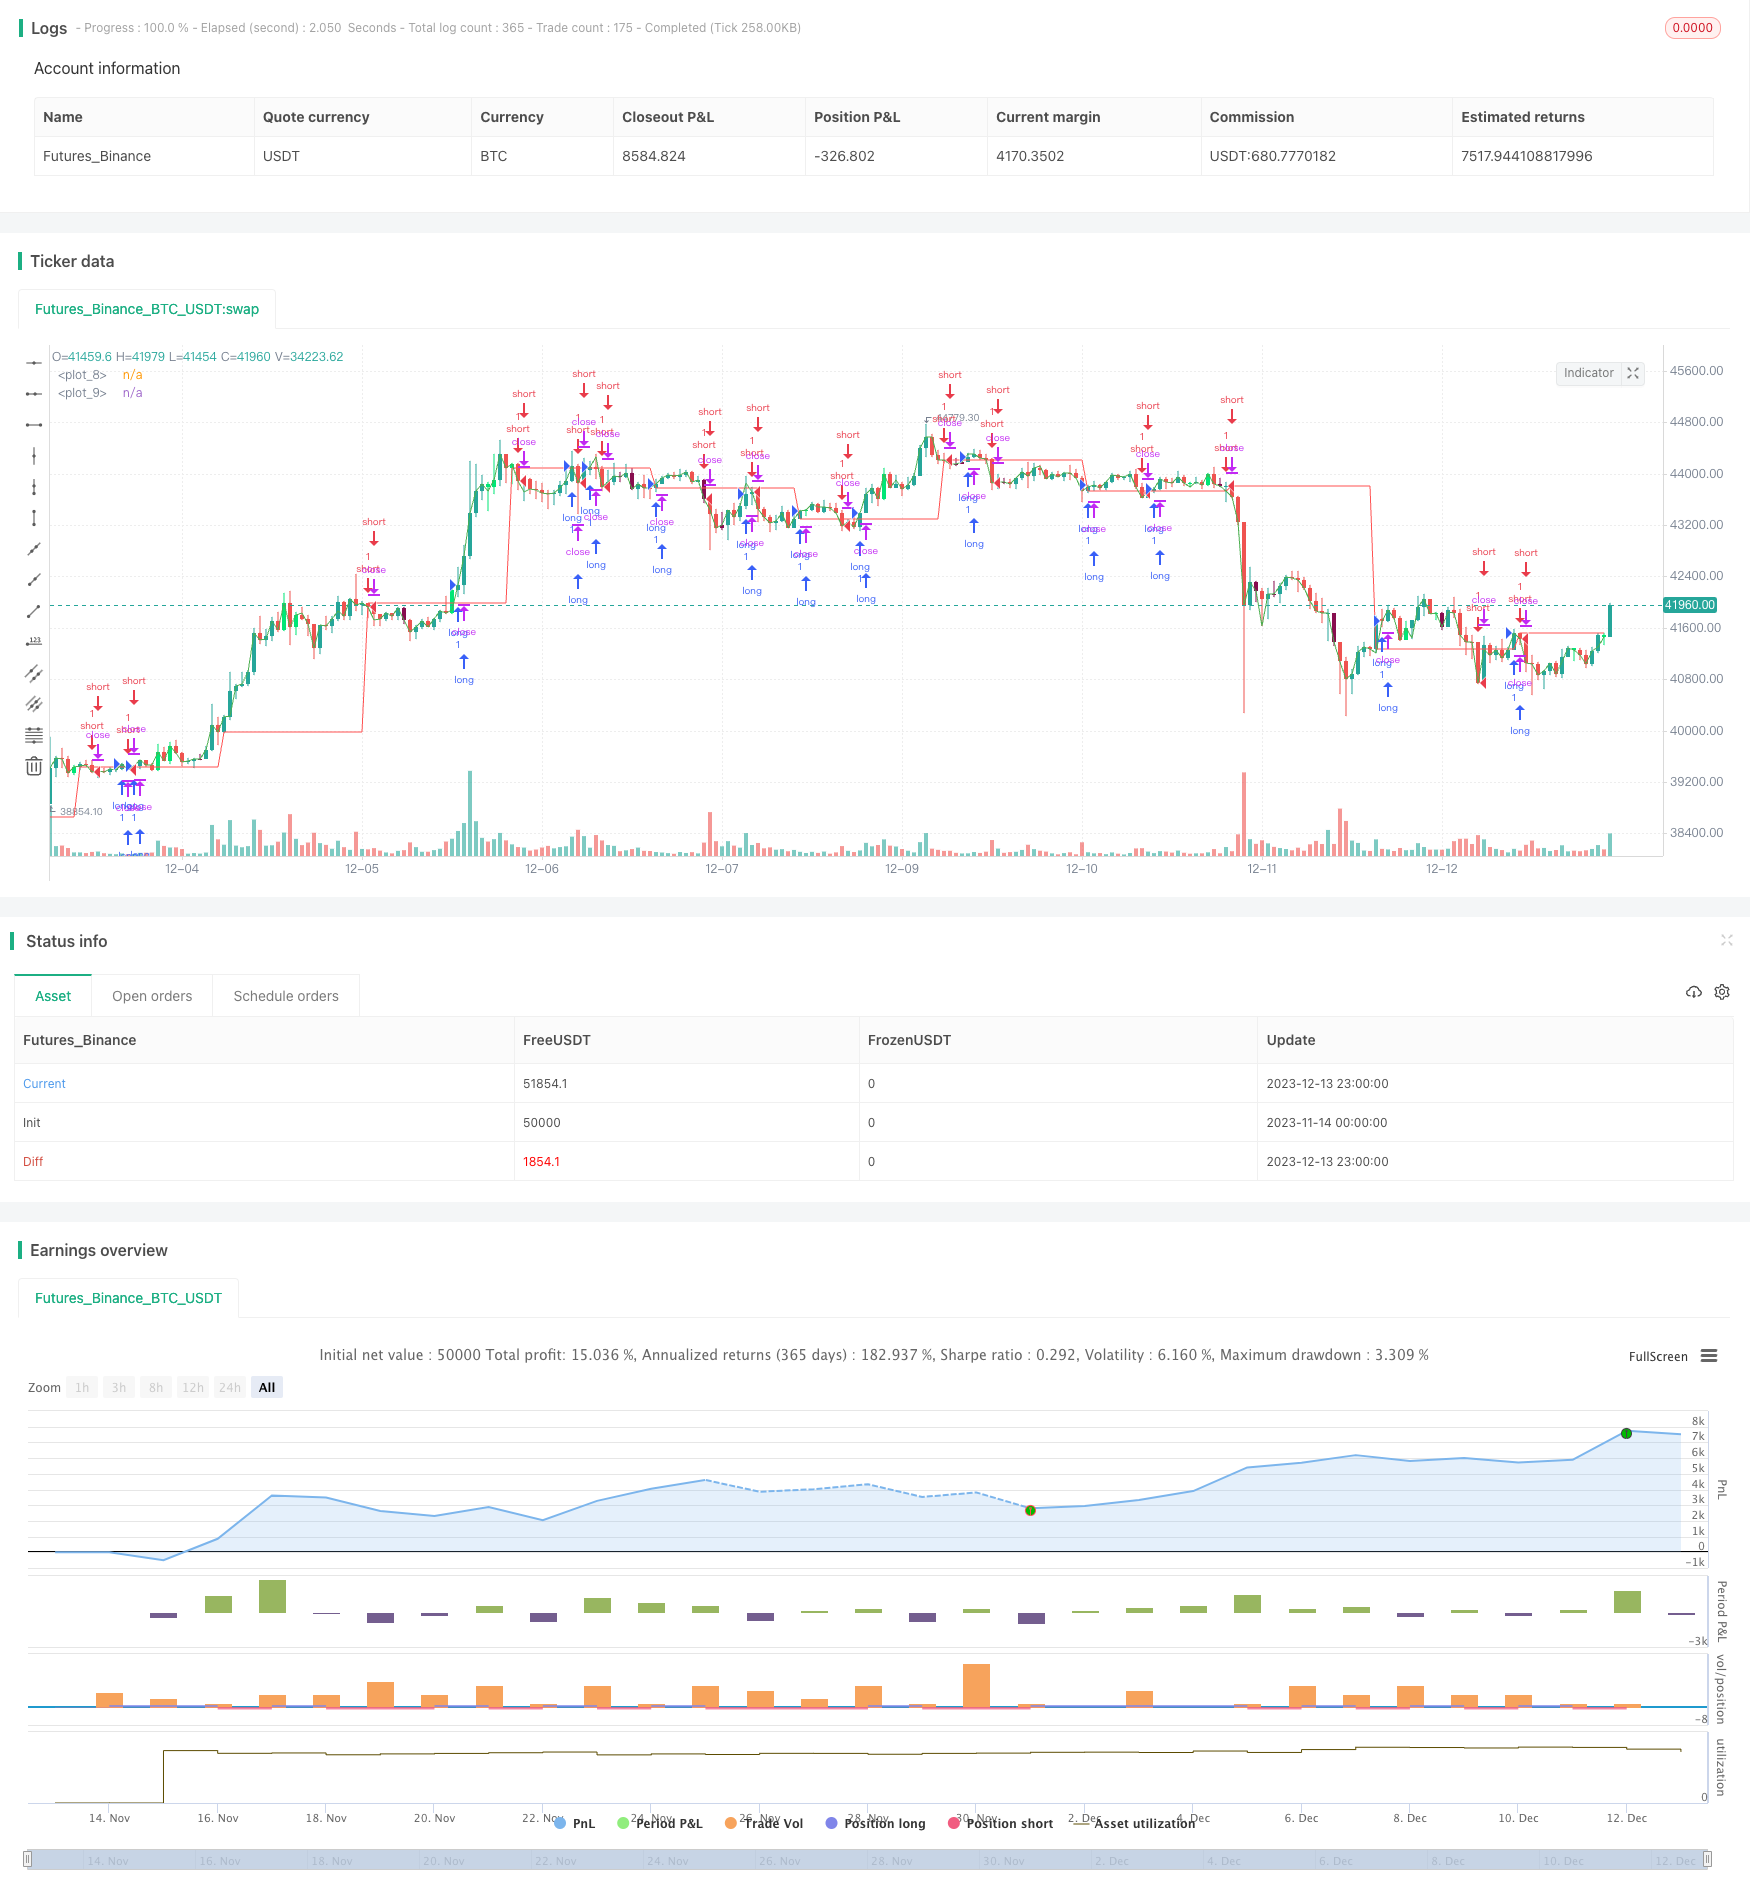
/*backtest
start: 2023-11-14 00:00:00
end: 2023-12-14 00:00:00
period: 1h
basePeriod: 15m
exchanges: [{"eid":"Futures_Binance","currency":"BTC_USDT"}]
*/

//@version=2
strategy("breakout ", overlay=true)
tim=input('1440')
sim=input('370')

out1 = request.security(syminfo.tickerid, tim, open)
out2 = request.security(syminfo.tickerid, sim, close)
plot(out1,color=red)
plot(out2,color=green)

length = input(20, title="BB Length")
mult = input(2.0,title="BB MultFactor")
lengthKC=input(20, title="KC Length")
multKC = input(1.5, title="KC MultFactor")

useTrueRange = input(true, title="Use TrueRange (KC)", type=bool)

// Calculate BB
source = close
basis = sma(source, length)
dev = multKC * stdev(source, length)
upperBB = basis + dev
lowerBB = basis - dev

// Calculate KC
ma = sma(source, lengthKC)
range1 = useTrueRange ? tr : (high - low)
rangema = sma(range1, lengthKC)
upperKC = ma + rangema * multKC
lowerKC = ma - rangema * multKC

sqzOn  = (lowerBB > lowerKC) and (upperBB < upperKC)
sqzOff = (lowerBB < lowerKC) and (upperBB > upperKC)
noSqz  = (sqzOn == false) and (sqzOff == false)

val = linreg(source  -  avg(avg(highest(high, lengthKC), lowest(low, lengthKC)),sma(close,lengthKC)),lengthKC,0)

bcolor = iff( val > 0,iff( val > nz(val[1]), lime, green),iff( val < nz(val[1]), red, maroon))
scolor = noSqz ? blue : sqzOn ? black : gray
//plot(val, color=bcolor, style=histogram, linewidth=4)
//plot(0, color=scolor, style=cross, linewidth=2)

// this section based on Almost Zero Lag EMA [LazyBear]
// Fast MA - type, length
matype   = input(defval="HullMA", title="Fast MA Type: SMA, EMA, WMA, VWMA, SMMA, DEMA, TEMA, HullMA, TMA, ZEMA ( case sensitive )")
malength = input(defval=20, title="Moving Average Length", minval=1)
src      = input(close,title="Moving average Source")

// Returns MA input selection variant, default to SMA if blank or typo.
variant(type, src, len) =>
    v1 = sma(src, len)                                                  // Simple
    v2 = ema(src, len)                                                  // Exponential
    v3 = wma(src, len)                                                  // Weighted
    v4 = vwma(src, len)                                                 // Volume Weighted
    v5 = na(v5[1]) ? sma(src, len) : (v5[1] * (len - 1) + src) / len    // Smoothed
    v6 = 2 * v2 - ema(v2, len)                                          // Double Exponential
    v7 = 3 * (v2 - ema(v2, len)) + ema(ema(v2, len), len)               // Triple Exponential
    v8 = wma(2 * wma(src, len / 2) - wma(src, len), round(sqrt(len)))   // Hull
    ema1 = ema(src, len)
    ema2 = ema(ema1, len)
    v10 = ema1+(ema1-ema2)                                              // Zero Lag Exponential
    v11 = sma(sma(src,len),len)                                         // Trianglular
    // return variant, defaults to SMA if input invalid.
    type=="EMA"?v2 : type=="WMA"?v3 : type=="VWMA"?v4 : type=="SMMA"?v5 : type=="DEMA"?v6 : type=="TEMA"?v7 : type=="HullMA"?v8 : type=="ZEMA"?v10 : type=="TMA"?v11 : v1

// Calculate selected MA and get direction of trend from it.
zlema= variant(matype,src,malength)
col =  zlema > zlema[1] ? green : red
up = zlema > zlema[1] ? 1 : 0
down = zlema < zlema[1] ? 1 : 0
//plot(zlema,color=col, style=line, linewidth=4, transp=0)


// Find all Fractals.
// This section based on [RS]Fractal Levels  by RicardoSantos
hidefractals = input(false)
hidelevels = input(false)
topfractal = high[2] > high[1] and high[2] > high and high[2] > high[3] and high[2] > high[4]
botfractal = low[2] < low[1] and low[2] < low and low[2] < low[3] and low[2] < low[4]

//plotshape(hidefractals ? na : topfractal, color=green, transp=0, style=shape.triangleup, location=location.abovebar, offset=-2, size=size.tiny)
//plotshape(hidefractals ? na : botfractal, color=red, transp=0, style=shape.triangledown, location=location.belowbar, offset=-2, size=size.tiny)

topfractals = topfractal ? high[2] : topfractals[1]
botfractals = botfractal ? low[2] : botfractals[1]

topfcolor = topfractals != topfractals[1] ? na : green
botfcolor = botfractals != botfractals[1] ? na : red

//plot(hidelevels ? na : topfractals, color=topfcolor, transp=0, linewidth=2)
//plot(hidelevels ? na : botfractals, color=botfcolor, transp=0, linewidth=2)

//
// This section based on Candlestick Patterns With EMA by rmwaddelljr
//
ufb  = input(false, title="Use Fractal S/R Cross Patterns")
udc  = input(true, title="Use Dark Cloud Cover Patterns" )
upl  = input(true, title="Use Piecing Line Patterns" )
ube  = input(true, title="Use Engulfing Candle Patterns" )
ubh  = input(true, title="Use Harami Candle Patterns" )
upb  = input(true,  title="Use Defined PinBar Patterns")
pctP = input(66, minval=1, maxval=99, title="Directional PBars, % of Range of Candle the Long Wick Has To Be")
// This section based on CM_Price-Action-Bars by ChrisMoody
// Change the pin bar calculation, so can be used for market direction.
urpb= input(false, title="Use CM Price Action Reversal Pin Bars")
usb = input(false, title="Use CM Price Action Shaved Bars")
uob = input(false, title="Use CM Price Action Outside Bars")
uib = input(false, title="Use CM Price Action Inside Bars")
pctRP = input(72, minval=1, maxval=99, title="CM Reversal PBars, % of Range of Candle the Long Wick Has To Be")
pctS = input(5, minval=1, maxval=99, title="CM Shaved Bars, % of Range it Has To Close On The Lows or Highs")
pblb =input(6,minval=1,title="CM Reversal Pin Bar Lookback Length")
//
stnd = input(true, title="Alert Only Patterns Following Trend")
//
// Get MACD for Alert Filtering
umacd  = input(true,title="Alert Only Patterns Confirmed by MACD")
fastMA = input(title="MACD Fast MA Length",  defval = 12, minval = 2)
slowMA = input(title="MACD Slow MA Length",  defval = 26, minval = 7)
signal = input(title="MACD Signal Length",defval=9,minval=1)

//
sgb = input(false, title="Check Box To Turn Bars Gray")
salc = input(true, title="Show Alert condition Dot")
//
[currMacd,_,_] = macd(close[0], fastMA, slowMA, signal)
[prevMacd,_,_] = macd(close[1], fastMA, slowMA, signal)
plotColor = currMacd > 0 ? currMacd > prevMacd ? green : red : currMacd < prevMacd ? red : green

// Show alert on this bar?
sbarUp = (not umacd or plotColor == green) and (not stnd or up)
sbarDn = (not umacd or plotColor == red) and (not stnd or down)

//PBar Percentages
pctCp = pctP * .01

//Shaved Bars Percentages
pctCs = pctS * .01
pctSPO = pctCs
//ma50 = sma(close,50)

range = high - low

///Reversal PinBars
pctCRp = pctRP * .01
pctCRPO = 1 - pctCRp
//
//pBarRUp= upb and open<close and open > high - (range * pctCRPO) and close > high - (range * pctCRPO) and low <= lowest(pblb) ? 1 : 0
//pBarRDn = upb and open>close and open < high - (range *  pctCRp) and close < high-(range * pctCRp) and high >= highest(pblb) ? 1 : 0
pBarRUp = urpb and  open > high - (range * pctCRPO) and close > high - (range * pctCRPO) and low <= lowest(pblb) ? 1 : 0
pBarRDn = urpb and  open < high - (range *  pctCRp) and close < high-(range * pctCRp) and high >= highest(pblb) ? 1 : 0

//Shaved Bars filter to the MA50 line
sBarUp   = usb and (close >= (high - (range * pctCs))) // and close>ma50
sBarDown = usb and (close <= (low + (range * pctCs)))  // and close<ma50

//Inside Bars
insideBarUp = uib and (high < high[1] and low > low[1])
insideBarDn = uib and (high < high[1] and low > low[1])
outsideBarUp= uob and (high > high[1] and low < low[1])
outsideBarDn= uob and (high > high[1] and low < low[1])

// PinBars representing possible change in trend direction
barcolor(pBarRUp ? green : na)
barcolor(pBarRDn ? red : na)

//Shaved Bars
barcolor(sBarDown ? fuchsia : na)
barcolor(sBarUp   ? aqua : na)

//Inside and Outside Bars
barcolor((insideBarUp or insideBarDn)? yellow : na )
barcolor((outsideBarUp or outsideBarDn) ? orange : na )


//Long shadow PinBars supporting market direction
///PinBars Long Upper Shadow represent selling pressure
pBarDn = upb and open < high - (range * pctCp) and close < high - (range * pctCp)
//plotshape(pBarDn and (not pBarRUp and not pBarRDn), title= "Bearish Pin Bar",  color=red, style=shape.arrowdown, text="Bearish\nPinBar")
///PinBars with Long Lower Shadow represent buying pressure
pBarUp = upb and open > low + (range * pctCp) and close > low + (range * pctCp)
//plotshape(pBarUp and (not pBarRUp and not pBarRDn),  title= "Bullish Pin Bar", location=location.belowbar, color=green, style=shape.arrowup, text="Bullish\nPinBar")

dcc = udc and (close[1]>open[1] and abs(close[1]-open[1])/range[1]>=0.7 and close<open and abs(close-open)/range>=0.7 and open>=close[1] and close>open[1] and close<((open[1]+close[1])/2))
//plotshape(dcc, title="Dark Cloud Cover",text='DarkCloud\nCover',color=red, style=shape.arrowdown,location=location.abovebar)
ts = timestamp(2021,8,1,8,18)
pln= upl and (close[1]<open[1] and abs(open[1]-close[1])/range[1]>=0.7 and close>open and abs(close-open)/range>=0.7 and open<=close[1] and close<open[1] and close>((open[1]+close[1])/2))
//plotshape(pln, title="Piercieng Line",text="Piercing\nLine",color=green, style=shape.arrowup,location=location.belowbar)

beh = ubh and (close[1] > open[1] and open > close and open <= close[1] and low >= open[1] and open - close < close[1] - open[1] and (high < high[1] and low > low[1]))
//plotshape(beh and not dcc, title= "Bearish Harami",  color=red, style=shape.arrowdown, text="Bear\nHarami")

blh = ubh and (open[1] > close[1] and close > open and close <= open[1] and high <= open[1] and close - open < open[1] - close[1] and (high < high[1] and low > low[1]))
//plotshape(blh and not pln,  title= "Bullish Harami", location=location.belowbar, color=green, style=shape.arrowup, text="Bull\nHarami")

bee = ube and (close[1] > open[1] and close < open and close<=low[1] and open>= close[1])
//plotshape(bee,  title= "Bearish Engulfing", color=red, style=shape.arrowdown, text="Bearish\nEngulf")

ble = ube and (close[1] < open[1] and close > open and close >= high[1] and open<=close[1])
//plotshape(ble, title= "Bullish Engulfing", location=location.belowbar, color=green, style=shape.arrowup, text="Bullish\nEngulf")

blfr = ufb and crossover(close,topfractals)
//plotshape(blfr and not ble and not blh and not sBarUp, title= "Bullish Fractal Cross", location=location.belowbar, color=green, style=shape.arrowup, text="Fractal\nCross")
befr = ufb and crossunder(close,botfractals)
//plotshape(befr and not bee and not beh and not sBarDown,  title= "Bearish Fractal Cross", color=red, style=shape.arrowdown, text="Fractal\nCross")
//
//
bcolorDn = sbarDn and not(pBarRDn or pBarRUp or sBarDown or insideBarDn or outsideBarDn) and (beh or bee or dcc or befr or pBarDn)
bcolorUp = sbarUp and not(pBarRDn or pBarRUp or sBarUp or insideBarUp or outsideBarUp) and (blh or ble or pln or blfr or pBarUp)
barcolor(bcolorDn ? maroon : na)
barcolor(bcolorUp ? lime : na)
//
barcolor(sgb and close ? gray : na)

bullcnd = pBarUp or pln or blh or ble or blfr
bearcnd = pBarDn or dcc or beh or bee or befr
if(true )
    longCondition = crossover(out2,out1)
    if(longCondition or close > out1 and bullcnd and strategy.position_size == 0)
        strategy.entry("long", strategy.long)

    //if (pBarRUp) // and bullcnd) //and strategy.position_size == 0)
    //    strategy.entry("long", strategy.long)

    shortCondition = crossunder(out2,out1)
    if (shortCondition or close < out1 and bearcnd and strategy.position_size == 0)
        strategy.entry("short", strategy.short)

//
barAlertDn = (sbarDn and (befr or bee or beh or pBarDn  or dcc)) or (sbarDn and (insideBarDn or outsideBarDn or sBarDown)) or pBarRDn
barAlertUp = (sbarUp and (blfr or ble or blh or pBarUp  or pln)) or (sbarUp and (insideBarUp or outsideBarUp or sBarUp))  or pBarRUp
barAlert = barAlertDn or barAlertUp
alertcondition(barAlert,title="CDLTRD Alert", message="CDLTRD Bar Alert")
// show only when alert condition is met and bar closed.
//plotshape(salc and barAlert[1],title= "Alert Indicator Closed", location=location.bottom, color=barAlertDn[1]?red:green, transp=0, style=shape.circle,offset=-1)
//EOF


    //if (pBarRDn) //and bearcnd//and strategy.position_size == 0)
     //   strategy.entry("short", strategy.short)

//strategy.close("long", when = exit)
//strategy.close("short", when = exit2)


//exit3 = sqzOn and sqzOn[1] and sqzOn[2] and sqzOn[3] and sqzOn[4] and sqzOn[5] and sqzOn[6]
//strategy.close("long", when = exit3)
//strategy.close("short", when = exit3)


//else
  //  alertcondition(condition = time > t, message = "Time exceeded")