مومنٹم ٹریڈنگ: ڈبل موونگ ایوریج کراس اوور حکمت عملی
جائزہ
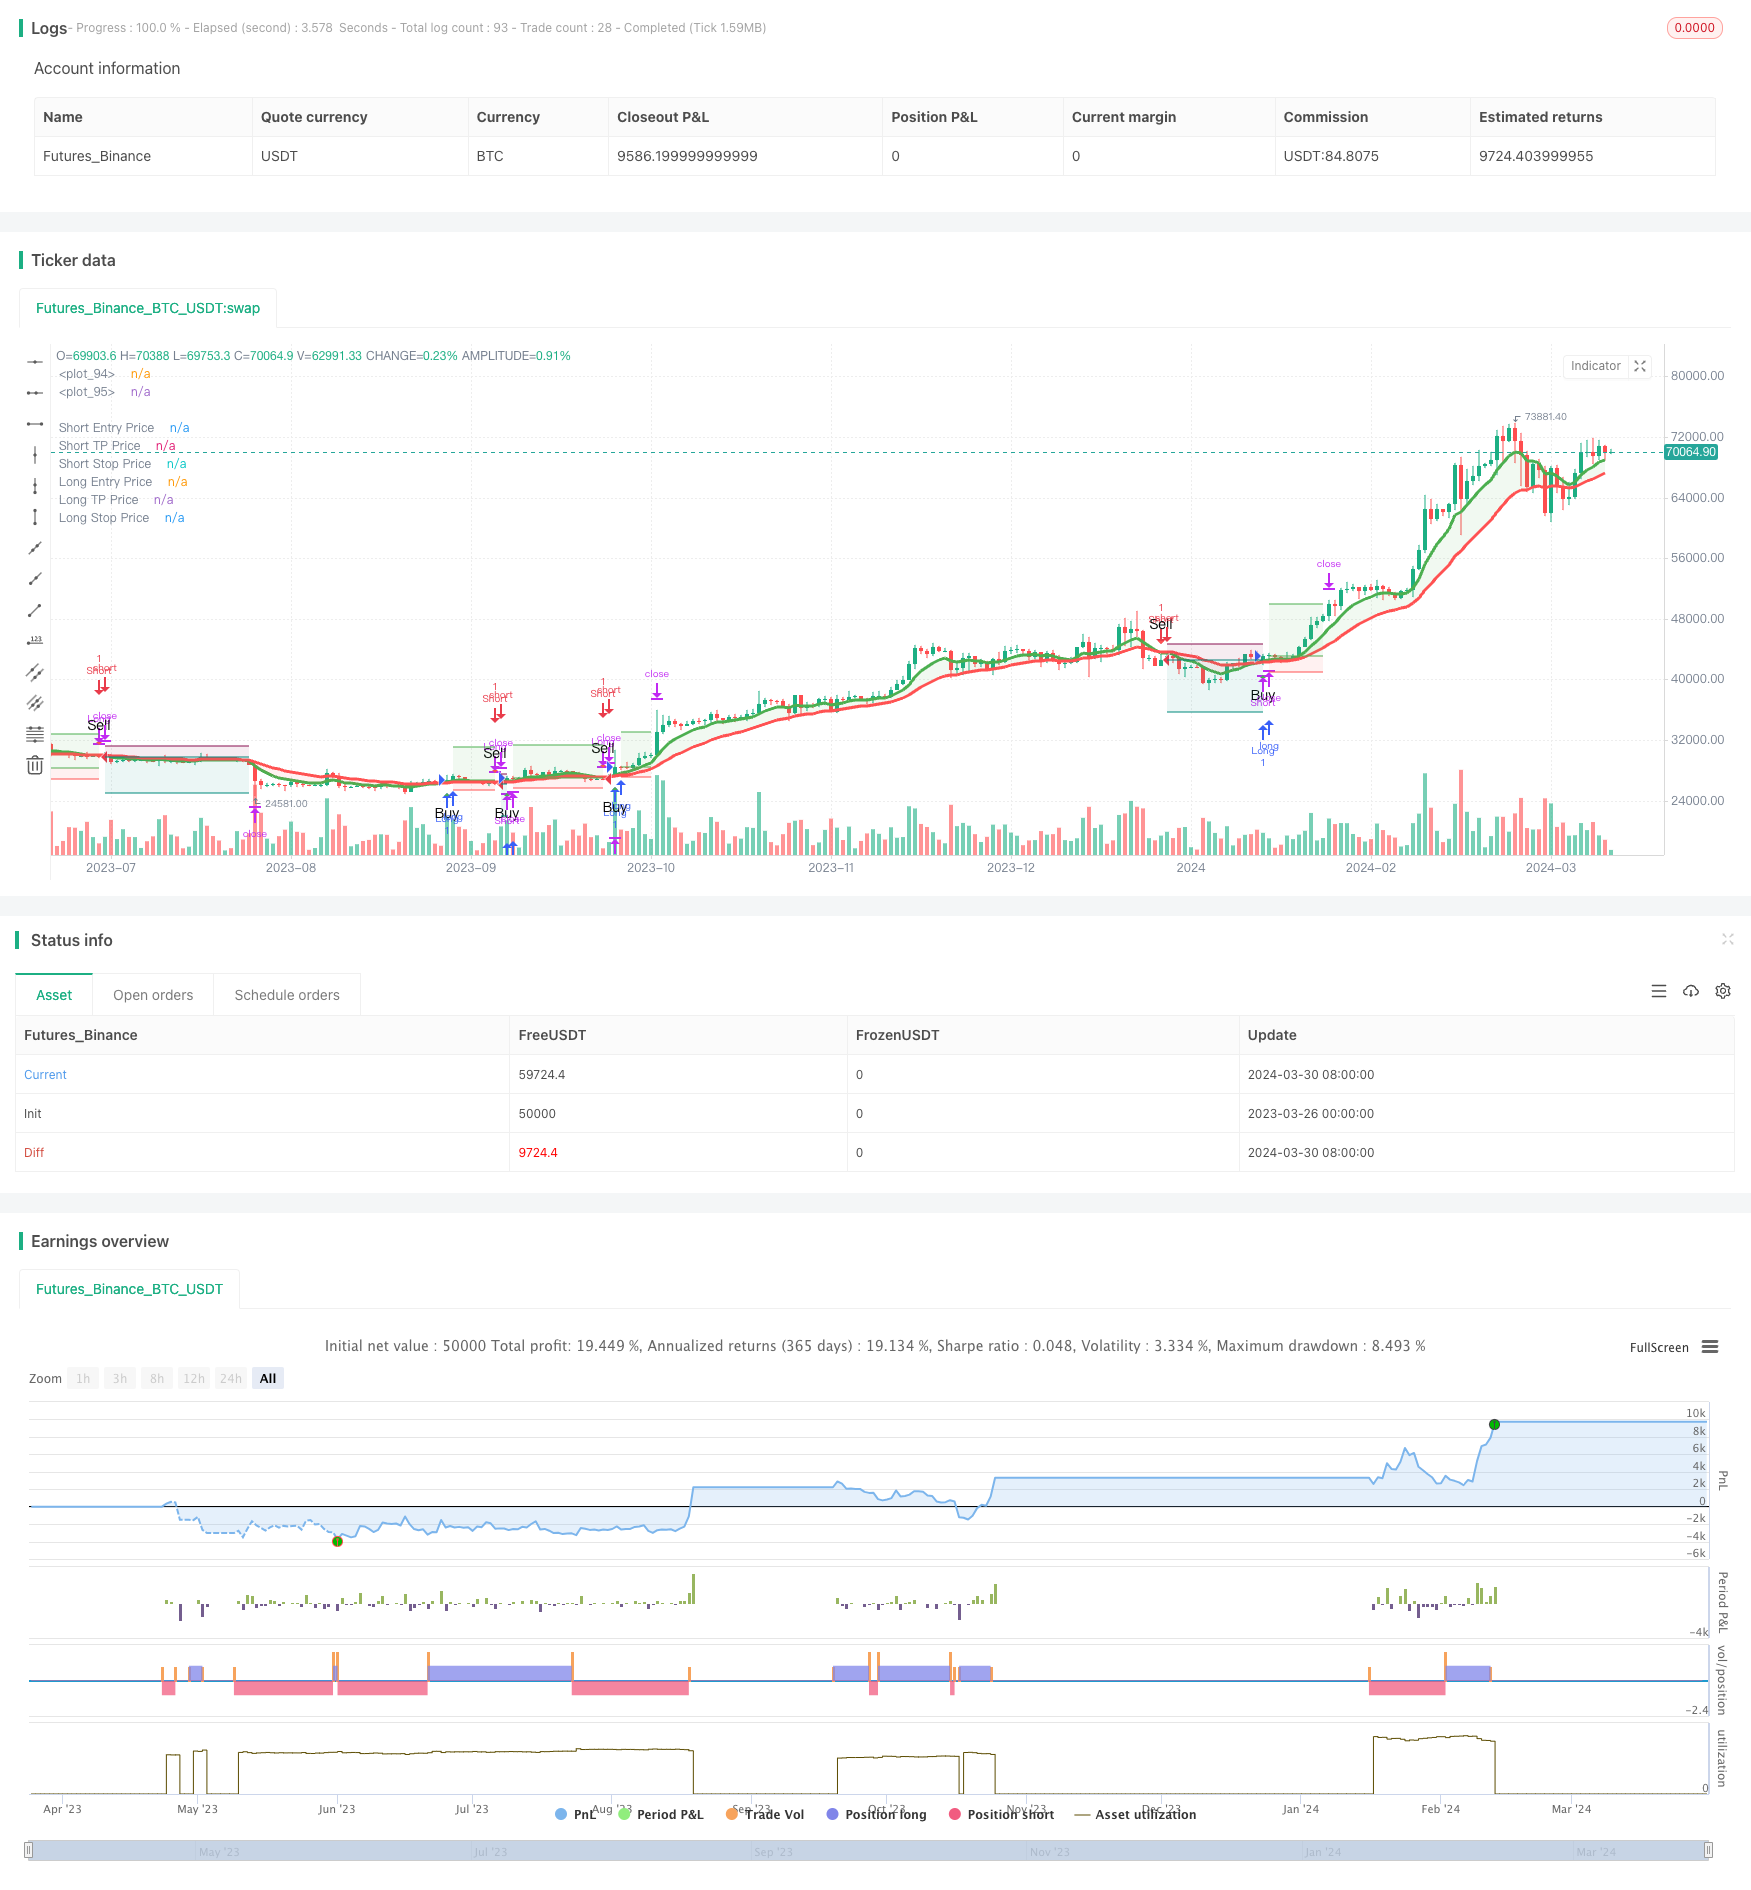
اس حکمت عملی میں 8 اور 21 دوروں کی اشاریہ حرکت پذیری اوسط ((EMA) کا استعمال کیا جاتا ہے تاکہ مارکیٹ کے رجحانات میں تبدیلیوں کی نشاندہی کی جاسکے۔ جب مختصر دورانیے کی EMA نیچے سے طویل دورانیے کی EMA کو عبور کرتی ہے تو ، خریدنے کا اشارہ پیدا ہوتا ہے۔ اس کے برعکس ، جب مختصر دورانیے کی EMA اوپر سے طویل دورانیے کی EMA کو عبور کرتی ہے تو ، فروخت کا اشارہ پیدا ہوتا ہے۔ اس حکمت عملی میں تین مسلسل اعلی کم ((HLL) اور تین مسلسل کم اونچائی ((LLH) کو بھی شامل کیا گیا ہے تاکہ اس رجحان میں مزید تبدیلی کی تصدیق کی جاسکے۔ اس کے علاوہ ، اس حکمت عملی میں خطرے کو کنٹرول کرنے اور منافع کو مقفل کرنے کے لئے اسٹاپ نقصان اور اسٹاپ آؤٹ کی سطح بھی رکھی گئی ہے۔
حکمت عملی کا اصول
- اہم رجحانات کی سمت کی شناخت کے لئے 8 اور 21 سائیکلوں کے EMAs کا حساب لگائیں۔
- تین مسلسل اعلی کم ((HLL) اور تین مسلسل کم اونچائی ((LLH) کی نشاندہی کریں ، جو رجحان کے الٹ جانے کا ابتدائی اشارہ ہے۔
- جب 8 سائیکل ای ایم اے نیچے سے 21 سائیکل ای ایم اے کو پار کرتا ہے اور ایچ ایل ایل کی توڑ پھوڑ ہوتی ہے تو ، خریدنے کا اشارہ ہوتا ہے۔ جب 8 سائیکل ای ایم اے اوپر سے 21 سائیکل ای ایم اے کو پار کرتا ہے اور ایل ایل ایچ کی توڑ پھوڑ ہوتی ہے تو ، فروخت کا اشارہ ہوتا ہے۔
- خطرے کو کنٹرول کرنے اور منافع کو لاک کرنے کے لئے اسٹاپ نقصان کی سطح کو داخلے کی قیمت کا 5٪ اور اسٹاپ لاک کی سطح کو داخلے کی قیمت کا 16٪ مقرر کریں۔
- جب ریورس سگنل ظاہر ہوتا ہے تو ، پوزیشن کو بند کردیں اور ریورس پوزیشن کھولیں۔
اسٹریٹجک فوائد
- ای ایم اے اور قیمتوں کے رویے کے نمونوں ((HLL اور LLH) کے ساتھ مل کر رجحانات کی تصدیق کرنے کے لئے ، سگنل کی وشوسنییتا کو بہتر بنائیں۔
- خطرے کو کنٹرول کرنے اور منافع کو لاک کرنے میں مدد کے لئے واضح اسٹاپ نقصان اور روک تھام کی سطح کا تعین کریں۔
- مختلف ٹائم فریموں اور مختلف مارکیٹوں کے لئے قابل اطلاق، کچھ عالمگیریت کے ساتھ۔
- واضح منطق، سمجھنے اور لاگو کرنے میں آسان۔
اسٹریٹجک رسک
- ہلچل والی مارکیٹوں میں ، بار بار کراسنگ سے متعدد غلط سگنل پیدا ہوسکتے ہیں ، جس سے نقصان ہوتا ہے۔
- فکسڈ سٹاپ نقصان اور روک تھام کی سطح مختلف مارکیٹ کے حالات کے مطابق نہیں ہوسکتی ہے، جس میں ممکنہ موقع کی قیمت یا زیادہ نقصان ہوتا ہے.
- حکمت عملی تاریخی اعداد و شمار پر انحصار کرتی ہے اور اچانک ہونے والے واقعات یا بنیادی تبدیلیوں کے لیے ناقابل عمل ہے۔
حکمت عملی کی اصلاح کی سمت
- ایڈجسٹمنٹ اسٹاپ اور اسٹاپ میکانیزم متعارف کروائیں ، جیسے اتار چڑھاؤ کی بنیاد پر (جیسے اے ٹی آر) تاکہ اسٹاپ اور اسٹاپ کی سطح کو مختلف مارکیٹ کے حالات کے مطابق بہتر بنایا جاسکے۔
- دوسرے اشارے یا عوامل کے ساتھ مل کر ، جیسے کہ تبادلوں کی مقدار ، رشتہ دار طاقت انڈیکس (RSI) ، وغیرہ ، سگنل کو مزید فلٹر کرنے اور وشوسنییتا کو بہتر بنانے کے لئے۔
- پیرامیٹرز (جیسے ای ایم اے کی مدت ، اسٹاپ اسٹاپ تناسب ، وغیرہ) کو بہتر بنانے کے لئے ، کسی خاص مارکیٹ یا معیار پر بہترین کارکردگی کا مظاہرہ کرنے والے پیرامیٹرز کا مجموعہ تلاش کریں۔
- خطرے کے انتظام کے اقدامات کو متعارف کرانے پر غور کریں ، جیسے پوزیشن سائزنگ ، تاکہ ایک ہی تجارت کے خطرے کو کنٹرول کیا جاسکے۔
خلاصہ کریں۔
یہ حکمت عملی 8 سائیکل اور 21 سائیکل EMA کے کراس کا استعمال کرتی ہے ، HLL اور LLH قیمت کے ماڈل کے ساتھ مل کر ، رجحانات کے الٹ کو پہچاننے اور تجارتی سگنل پیدا کرنے کے لئے۔ واضح اسٹاپ نقصان کے قواعد خطرے کو کنٹرول کرنے اور منافع کو بند کرنے میں معاون ہیں۔ تاہم ، یہ حکمت عملی ہلچل مچانے والے بازاروں میں جھوٹے سگنل پیدا کرسکتی ہے ، اور مقررہ اسٹاپ نقصان کی سطح مختلف مارکیٹ کے ماحول کے مطابق نہیں ہوسکتی ہے۔ مزید بہتری کے لئے ، ایڈجسٹ اسٹاپ نقصان کو متعارف کرانے ، دوسرے اشارے ، اصلاحی پیرامیٹرز کو جوڑنے اور خطرے سے متعلق انتظامات متعارف کرانے پر غور کیا جاسکتا ہے۔
/*backtest
start: 2023-03-26 00:00:00
end: 2024-03-31 00:00:00
period: 1d
basePeriod: 1h
exchanges: [{"eid":"Futures_Binance","currency":"BTC_USDT"}]
*/

//@version=5
strategy('Trend Following 8&21EMA with strategy tester [ukiuro7]', overlay=true, process_orders_on_close=true, calc_on_every_tick=true, initial_capital = 10000)

//INPUTS
lh3On = true
hl3On = true
emaOn = input(title='105ema / 30min', defval=true)
assistantOn = input(title='Assistant', defval=true)
textOn = input(title='Text', defval=true)

showRiskReward = input.bool(true, title='Show Risk/Reward Area', group="TP/SL")
stopPerc = input.float(5.0, step=0.1, minval=0.1, title='Stop-Loss %:',group="TP/SL") / 100
tpPerc = input.float(16.0, step=0.1, minval=0.1, title='Take-Profit %:',group="TP/SL") / 100

backtestFilter = input(false, title='Backtest Entries to Date Range',group="Backtest Date Range")
i_startTime = input(defval=timestamp('01 Jan 2022 00:00'), inline="b_1", title='Start',group="Backtest Date Range")
i_endTime = input(defval=timestamp('01 Jan 2029 00:00'), inline="b_1", title='End',group="Backtest Date Range")
inDateRange = true

message_long_entry = input.string(title='Alert Msg: LONG Entry', defval ='', group='Alert Message')
message_short_entry = input.string(title='Alert Msg: SHORT Entry', defval='', group='Alert Message')
message_long_exit = input.string(title='Alert Msg: LONG SL/TP', defval='', group='Alert Message')
message_short_exit = input.string(title='Alert Msg: SHORT SL/TP', defval='', group='Alert Message')

//CALCS
threeHigherLows() =>
    low[0] >= low[1] and low[1] >= low[2]

threeLowerHighs() =>
    high[2] >= high[1] and high[1] >= high[0]

breakHigher() =>
    padding = timeframe.isintraday ? .02 : .1
    high >= high[1] + padding

breakLower() =>
    padding = timeframe.isintraday ? .02 : .1
    low <= low[1] - padding

lh3 = threeLowerHighs() and lh3On
lh3bh = lh3[1] and breakHigher() and lh3On

hl3 = threeHigherLows() and hl3On
hl3bl = hl3[1] and breakLower() and hl3On

ema8 = ta.ema(close, 8)
ema21 = ta.ema(close, 21)

//VARS
var float longStop = na, var float longTp = na
var float shortStop = na, var float shortTp = na

//CONDS
isUptrend = ema8 >= ema21
isDowntrend = ema8 <= ema21
trendChanging = ta.cross(ema8, ema21)

buySignal = lh3bh and lh3[2] and lh3[3] and isUptrend and timeframe.isintraday
sellSignal = hl3bl and hl3[2] and hl3[3] and isDowntrend and timeframe.isintraday

goingDown = hl3 and isDowntrend and timeframe.isintraday
goingUp = lh3 and isUptrend and timeframe.isintraday

projectXBuy = trendChanging and isUptrend
projectXSell = trendChanging and isDowntrend

longCond = trendChanging and isUptrend and assistantOn
shortCond = trendChanging and isDowntrend and assistantOn

//STRATEGY
if shortCond and strategy.position_size > 0 and barstate.isconfirmed
    strategy.close('Long', comment='CLOSE LONG', alert_message=message_long_exit)

if longCond and strategy.position_size < 0 and barstate.isconfirmed
    strategy.close('Short', comment='CLOSE SHORT', alert_message=message_short_exit)

if longCond and strategy.position_size <= 0 and barstate.isconfirmed and inDateRange
    longStop := close * (1 - stopPerc)
    longTp := close * (1 + tpPerc)
    strategy.entry('Long', strategy.long, comment='LONG', alert_message=message_long_entry)
    strategy.exit('Long Exit', 'Long', comment_loss="SL LONG", comment_profit = "TP LONG", stop=longStop, limit=longTp, alert_message=message_long_exit)

if shortCond and strategy.position_size >= 0 and barstate.isconfirmed and inDateRange
    shortStop := close * (1 + stopPerc)
    shortTp := close * (1 - tpPerc)
    strategy.entry('Short', strategy.short, comment='SHORT', alert_message=message_short_entry)
    strategy.exit('Short Exit', 'Short', comment_loss="SL SHORT", comment_profit="TP SHORT", stop=shortStop, limit=shortTp, alert_message=message_short_exit)

//PLOTS
plotshape(longCond, style=shape.triangleup, location=location.belowbar, color=color.new(color.green, 0), size=size.small, text='Buy')
plotshape(shortCond, style=shape.triangledown, location=location.abovebar, color=color.new(color.red, 0), size=size.small, text='Sell')
plotchar(trendChanging and isUptrend and close < open and assistantOn, char='!', location=location.abovebar, color=color.new(color.green, 0), size=size.small)

aa = plot(ema8, linewidth=3, color=color.new(color.green, 0), editable=true)
bb = plot(ema21, linewidth=3, color=color.new(color.red, 0), editable=true)
fill(aa, bb, color=isUptrend ? color.new(color.green,90) : color.new(color.red,90))
buyZone = isUptrend and lh3 and high < ema21 and timeframe.isintraday
sellZone = isDowntrend and hl3 and low > ema21 and timeframe.isintraday

L1 = plot(showRiskReward and strategy.position_size > 0 ? strategy.position_avg_price : na, color=color.new(color.green, 0), linewidth=1, style=plot.style_linebr, title='Long Entry Price')
L2 = plot(showRiskReward and strategy.position_size > 0 ? longTp : na, color=color.new(color.green, 0), linewidth=1, style=plot.style_linebr, title='Long TP Price')
L3 = plot(showRiskReward and strategy.position_size > 0 ? longStop : na, color=color.new(color.red, 0), linewidth=1, style=plot.style_linebr, title='Long Stop Price')

S1 = plot(showRiskReward and strategy.position_size < 0 ? strategy.position_avg_price : na, color=color.new(color.teal, 0), linewidth=1, style=plot.style_linebr, title='Short Entry Price')
S2 = plot(showRiskReward and strategy.position_size < 0 ? shortTp : na, color=color.new(color.teal, 0), linewidth=1, style=plot.style_linebr, title='Short TP Price')
S3 = plot(showRiskReward and strategy.position_size < 0 ? shortStop : na, color=color.new(color.maroon, 0), linewidth=1, style=plot.style_linebr, title='Short Stop Price')

fill(L1, L2, color=color.new(color.green, 90))
fill(L1, L3, color=color.new(color.red, 90))
fill(S1, S2, color=color.new(color.teal, 90))
fill(S1, S3, color=color.new(color.maroon, 90))

bgcolor(inDateRange == false ? color.new(color.red,90) : na, title="Backtest Off-Range")