حکمت عملی کا جائزہ
یہ ایک سمارٹ ٹریڈنگ حکمت عملی ہے جس میں برن بینڈ اور سپر ٹرینڈ اشارے شامل ہیں۔ یہ حکمت عملی بنیادی طور پر مارکیٹ میں اتار چڑھاؤ کی حد کی نشاندہی کرنے کے لئے برن کے ذریعہ لائی جاتی ہے ، جبکہ سپر ٹرینڈ اشارے کا استعمال کرتے ہوئے مارکیٹ کی رجحان کی سمت کی تصدیق کی جاتی ہے ، تاکہ اعلی امکانات والے مقامات پر تجارت کی جاسکے۔ حکمت عملی کا ڈیزائن مختلف قسم کے تجارت کی اقسام اور وقت کی مدت کے لئے موزوں ہے ، خاص طور پر 30 منٹ اور 2 گھنٹے کی مدت پر۔
حکمت عملی کا اصول
حکمت عملی کی بنیادی منطق درج ذیل کلیدی عناصر پر مبنی ہے:
- 20 دوروں کے ساتھ برن بینڈ ، 2 معیاری فرق کی چوڑائی ، اوپری ریل ، مڈل ریل ، نچلی ریل اور دو درمیانی لائنوں کی تعمیر
- 10 سائیکل اے ٹی آر اور 3 گنا فیکٹر کے حساب سے سپر ٹرینڈ اشارے
- داخلہ سگنل:
- ملٹی ہیڈ انٹری: جب قیمتوں میں بلین باؤنڈ ریل سے ٹکراؤ اور سپر ٹرینڈ اشارے ملٹی ہیڈ سمت میں ہوں
- ہیڈ انٹری: جب قیمتوں میں برن کی پٹریوں کو چھوتا ہے اور سپر ٹرینڈ کا اشارے ہیڈ سمت میں ہوتا ہے
- باہر نکلنے کا اشارہ:
- کثیر سر کا آغاز: جب اختتامی قیمت سپر ٹرینڈ لائن سے نیچے آجاتی ہے اور رجحان کا رخ اوپر کی طرف ہوتا ہے
- خالی سر سے باہر نکلنا: جب اختتامی قیمت سپر ٹرینڈ لائن کو توڑ دیتی ہے اور رجحان کثیر سر میں بدل جاتا ہے
اسٹریٹجک فوائد
- دوہری تصدیق کے طریقہ کار سے تجارت کی وشوسنییتا میں اضافہ ہوتا ہے: بورن بینڈ میں اتار چڑھاؤ کی حدود اور سپر ٹرینڈ کی سمت کا فیصلہ ، جعلی توڑنے کے خطرے کو مؤثر طریقے سے کم کرتا ہے
- مارکیٹ میں اتار چڑھاؤ کے لئے خود کار طریقے سے لچکدار: برن بینڈ خود بخود مارکیٹ میں اتار چڑھاؤ کے مطابق بینڈوڈتھ کو ایڈجسٹ کرتا ہے ، حکمت عملی کو اچھی طرح سے لچکدار بناتا ہے
- واضح ٹریڈنگ سگنل: داخلہ اور باہر نکلنے کے حالات واضح ہیں ، ان پر عمل درآمد اور پیمائش کرنا آسان ہے
- لچکدار پیرامیٹرز کی ترتیب: مختلف مارکیٹ کے حالات کے مطابق برن بینڈ کی لمبائی ، بینڈوڈتھ ضرب اور سپر ٹرینڈ پیرامیٹرز کو ایڈجسٹ کیا جاسکتا ہے
- بہترین بصری اثرات: تجزیہ اور نگرانی کے لئے مختلف رنگوں اور شکلوں میں ٹریڈنگ سگنل کو نشان زد کرنا
اسٹریٹجک رسک
- زلزلے کا خطرہ: زلزلے کے حالات میں اکثر غلط سگنل پیدا ہوسکتے ہیں
- پسماندگی کا خطرہ: برین بینڈ اور سپر ٹرینڈ دونوں ہی پسماندہ اشارے ہیں ، جو تیز رفتار رجحانات میں بہترین داخلے کے مقامات سے محروم ہوسکتے ہیں
- پیرامیٹر کی حساسیت: مختلف پیرامیٹر کی ترتیبات حکمت عملی کی کارکردگی میں بڑے فرق کا باعث بن سکتی ہیں۔ حکمت عملی کے لئے مندرجہ ذیل خطرے کو کنٹرول کرنے کی سفارش کی جاتی ہے:
- اسٹاپ نقصان کی پوزیشن کا تعین کرنے کے لئے انفرادی خطرے کو کنٹرول کریں
- شدید اتار چڑھاؤ کے دوران تجارت روکنے پر غور کریں
- مارکیٹ میں تبدیلیوں کے مطابق پیرامیٹرز کو باقاعدگی سے بہتر بنائیں
حکمت عملی کی اصلاح کی سمت
- مارکیٹ میں اتار چڑھاؤ کی شرح کو فلٹر کریں:
- اعلی اتار چڑھاؤ کے ماحول میں پوزیشن کا سائز ایڈجسٹ کریں
- اے ٹی آر فلٹرز کا اضافہ کریں تاکہ زیادہ اتار چڑھاؤ کے دوران تجارت سے بچا جاسکے
- روک تھام اور نقصان کے نظام کو بہتر بنانا:
- بلین بینڈوڈتھ کی بنیاد پر متحرک طور پر سیٹ کی گئی سٹاپ لوکیشن
- سپر ٹرینڈ سلپ کے ساتھ متحرک اسٹاپ اسٹاپ حکمت عملی ڈیزائن کریں
- ٹائم فلٹر:
- اہم اعداد و شمار کے اجراء سے گریز
- مختلف وقت کے لئے مختلف پیرامیٹرز مقرر کریں
- بہتر سگنل کی تصدیق کے طریقہ کار:
- حجم کی تصدیق میں اضافہ کریں۔
- رجحان کی طاقت کے اشارے کو بڑھانے پر غور کریں
خلاصہ کریں۔
یہ تکنیکی تجزیہ کلاسیکی اشارے کے ساتھ مل کر ایک مکمل تجارتی نظام ہے ، جو برن بینڈ اور سپر ٹرینڈ کے ہم آہنگی کے ذریعے رجحانات اور اتار چڑھاؤ میں اچھی کارکردگی کا مظاہرہ کرسکتا ہے۔ حکمت عملی کا بصری ڈیزائن اور پیرامیٹرز کی لچک اس کو عمدہ عملی بناتی ہے۔ حکمت عملی کی استحکام اور منافع کو مزید بہتر بنانے کے لئے تجویز کردہ اصلاحی سمتوں کے ذریعہ۔
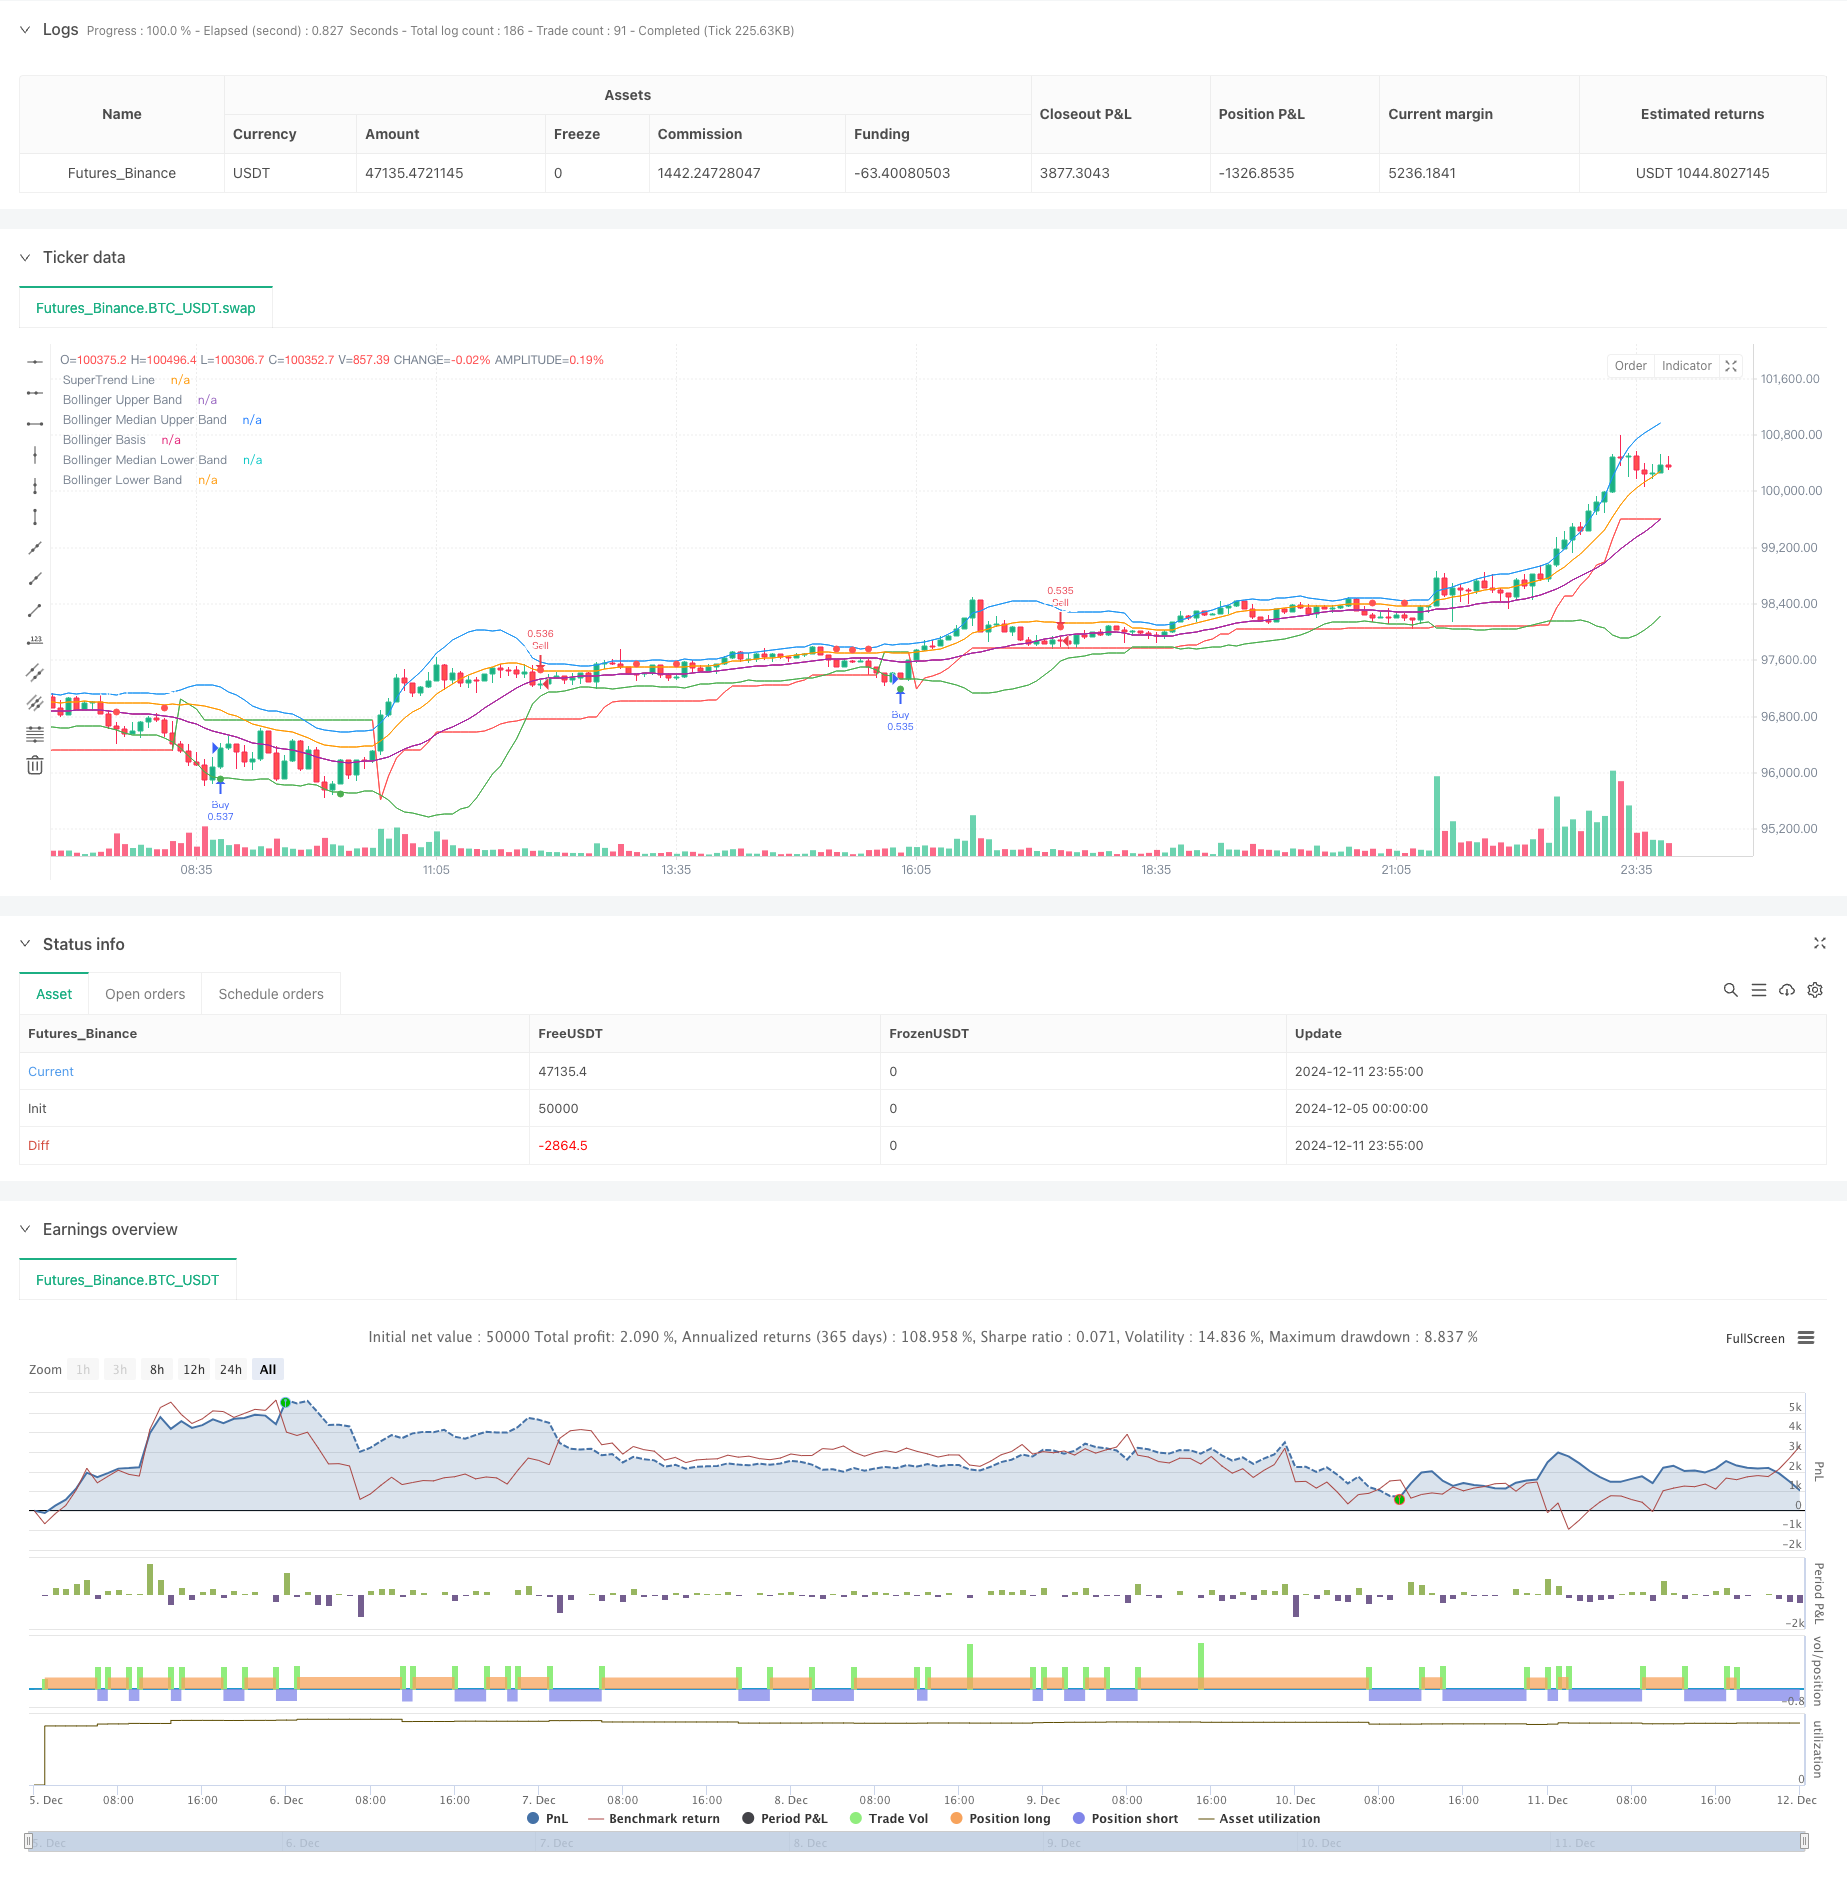
/*backtest
start: 2024-12-05 00:00:00
end: 2024-12-12 00:00:00
period: 5m
basePeriod: 5m
exchanges: [{"eid":"Futures_Binance","currency":"BTC_USDT"}]
*/

//@version=5
strategy("Bollinger Band & SuperTrend Strategy (Standard Chart)", overlay=true, default_qty_type=strategy.percent_of_equity, default_qty_value=100)

// Bollinger Bands Settings
length_bb = input.int(20, title="Bollinger Band Length")
mult_bb = input.float(2.0, title="Bollinger Band Multiplier")
[bb_upper, bb_basis, bb_lower] = ta.bb(close, length_bb, mult_bb)

// Median Bands
bb_median_upper = (bb_upper + bb_basis) / 2
bb_median_lower = (bb_lower + bb_basis) / 2

// SuperTrend Settings
atr_length = input.int(10, title="ATR Length")
factor = input.float(3.0, title="SuperTrend Factor")

// SuperTrend Calculation based on standard chart OHLC data
[supertrend, direction] = ta.supertrend(factor, atr_length)

// Plotting Bollinger Bands
plot(bb_upper, color=color.red, title="Bollinger Upper Band")
plot(bb_median_upper, color=color.orange, title="Bollinger Median Upper Band")
plot(bb_basis, color=color.blue, title="Bollinger Basis")
plot(bb_median_lower, color=color.purple, title="Bollinger Median Lower Band")
plot(bb_lower, color=color.green, title="Bollinger Lower Band")

// Plotting SuperTrend
supertrend_color = direction > 0 ? color.green : color.red
plot(supertrend, color=supertrend_color, style=plot.style_line, title="SuperTrend Line")

// Customizable Signal Shape Inputs
buy_shape = input.string("shape_triangle_up", title="Buy Signal Shape", options=["shape_triangle_up", "shape_circle", "shape_cross", "shape_diamond", "shape_flag"])
sell_shape = input.string("shape_triangle_down", title="Sell Signal Shape", options=["shape_triangle_down", "shape_circle", "shape_cross", "shape_diamond", "shape_flag"])

// Entry Conditions
buy_condition = ta.crossover(low, bb_lower) and direction > 0
sell_condition = ta.crossunder(high, bb_upper) and direction < 0

// Exit Conditions
exit_buy_condition = ta.crossunder(close, supertrend) and direction < 0
exit_sell_condition = ta.crossover(close, supertrend) and direction > 0

// Strategy Logic
if buy_condition
    strategy.entry("Buy", strategy.long)
if sell_condition
    strategy.entry("Sell", strategy.short)

if exit_buy_condition
    strategy.close("Buy")
if exit_sell_condition
    strategy.close("Sell")

// Plot Buy Signal Shape
plotshape(series=buy_condition, title="Buy Signal", location=location.belowbar, color=color.green, style=buy_shape, text="BUY", textcolor=color.white)

// Plot Sell Signal Shape
plotshape(series=sell_condition, title="Sell Signal", location=location.abovebar, color=color.red, style=sell_shape, text="SELL", textcolor=color.white)