Khái niệm Dual SuperTrend
Tác giả:ChaoZhang, Ngày: 2022-05-17 14:40:40Tags:SMAATR
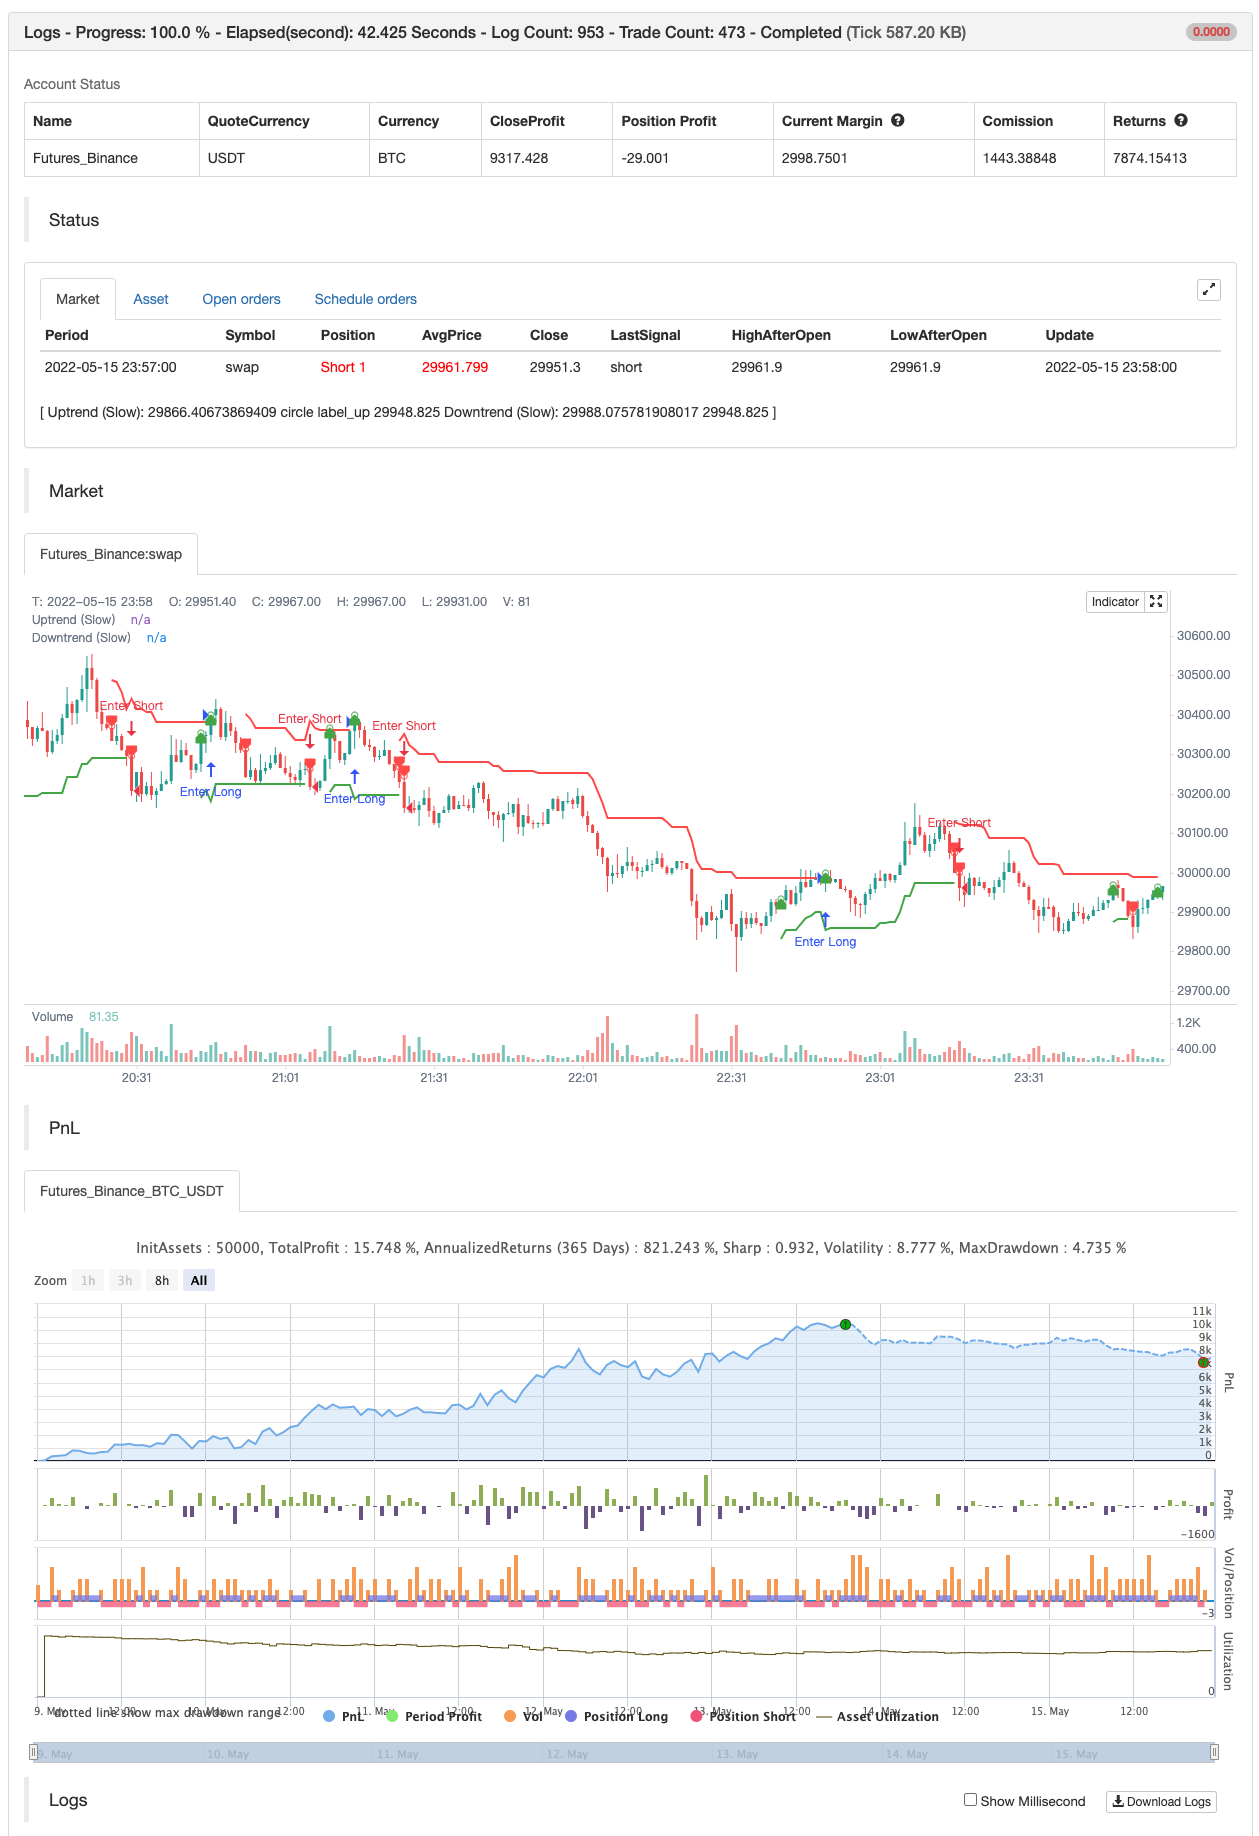
Chỉ số SuperTrend đơn giản cho phép bạn hiển thị hai SuperTrends trên một kịch bản duy nhất cộng với các tính năng tùy chỉnh bổ sung.
backtest

/*backtest
start: 2022-05-09 00:00:00
end: 2022-05-15 23:59:00
period: 1m
basePeriod: 1m
exchanges: [{"eid":"Futures_Binance","currency":"BTC_USDT"}]
*/

//@version=5
indicator(title='Concept Dual SuperTrend', shorttitle='ConceptDST', overlay=true, format=format.price, precision=2, timeframe='')

src = input(hl2, title='Source')
multiplier = input.float(title='ATR Multiplier (Fast)', step=0.1, defval=2)
multiplier2 = input.float(title='ATR Multiplier (Slow)', step=0.1, defval=3)
periods = input(title='ATR Period (Fast)', defval=10)
periods2 = input(title='ATR Period (Slow)', defval=10)
transp_st = input.float(title='Line Transparency', step=1, minval=0, maxval=100, defval=70)
transp_hl = input.float(title='Shading Transparency', step=1, minval=0, maxval=100, defval=90)
changeATR = input(title='Change ATR Calculation Method?', defval=true)
highlighting = input(title='Show Shading? (Fast)', defval=true)
highlighting2 = input(title='Show Shading? (Slow)', defval=true)
showlabels = input(title='Show Buy/Sell Labels?', defval=true)


//------------------------------------------------

// Calculations (Fast)
atrA = ta.sma(ta.tr, periods)
atr = changeATR ? ta.atr(periods) : atrA
up = src - multiplier * atr
upA = nz(up[1], up)
up := close[1] > upA ? math.max(up, upA) : up
dn = src + multiplier * atr
dnA = nz(dn[1], dn)
dn := close[1] < dnA ? math.min(dn, dnA) : dn

// Trend (Fast)
trend = 1
trend := nz(trend[1], trend)
trend := trend == -1 and close > dnA ? 1 : trend == 1 and close < upA ? -1 : trend

upPlot = plot(trend == 1 ? up : na, title='Uptrend (Slow)', style=plot.style_linebr, linewidth=2, color=color.new(color.green, transp_st))
buySignal = trend == 1 and trend[1] == -1
plotshape(buySignal ? up : na, title='Uptrend Start (Slow)', location=location.absolute, style=shape.circle, size=size.tiny, color=color.new(color.green, transp_st))
plotshape(buySignal and showlabels ? up : na, title='Buy', text='Buy', location=location.absolute, style=shape.labelup, size=size.tiny, color=color.new(color.green, 0), textcolor=color.new(color.white, 0))

dnPlot = plot(trend == 1 ? na : dn, title='Downtrend (Slow)', style=plot.style_linebr, linewidth=2, color=color.new(color.red, transp_st))
sellSignal = trend == -1 and trend[1] == 1
plotshape(sellSignal ? dn : na, title='Downtrend Start (Slow)', location=location.absolute, style=shape.circle, size=size.tiny, color=color.new(color.red, transp_st))
plotshape(sellSignal and showlabels ? dn : na, title='Sell', text='Sell', location=location.absolute, style=shape.labeldown, size=size.tiny, color=color.new(color.red, 0), textcolor=color.new(color.white, 0))

mPlot = plot(ohlc4, title='', style=plot.style_circles, linewidth=0, color=na)
longFillColor = highlighting ? trend == 1 ? color.green : color.black : color.black
shortFillColor = highlighting ? trend == -1 ? color.red : color.black : color.black
fill(mPlot, upPlot, title='Uptrend Shading (Slow)', color=color.new(longFillColor, transp_hl))
fill(mPlot, dnPlot, title='Downtrend Shading (Slow)', color=color.new(shortFillColor, transp_hl))

//------------------------------------------------

// Calculations (Slow)
atrA2 = ta.sma(ta.tr, periods2)
atr2 = changeATR ? ta.atr(periods2) : atrA2
up2 = src - multiplier2 * atr2
upA2 = nz(up2[1], up2)
up2 := close[1] > upA2 ? math.max(up2, upA2) : up2
dn2 = src + multiplier2 * atr2
dnA2 = nz(dn2[1], dn2)
dn2 := close[1] < dnA2 ? math.min(dn2, dnA2) : dn2

// Trend (Slow)
trend2 = 1
trend2 := nz(trend2[1], trend2)
trend2 := trend2 == -1 and close > dnA2 ? 1 : trend2 == 1 and close < upA2 ? -1 : trend2

upPlot2 = plot(trend2 == 1 ? up2 : na, title='Uptrend (Slow)', style=plot.style_linebr, linewidth=2, color=color.new(color.green, transp_st))
buySignal2 = trend2 == 1 and trend2[1] == -1
plotshape(buySignal2 ? up2 : na, title='Uptrend Start (Slow)', location=location.absolute, style=shape.circle, size=size.tiny, color=color.new(color.green, transp_st))
plotshape(buySignal2 and showlabels ? up2 : na, title='Buy', text='Buy', location=location.absolute, style=shape.labelup, size=size.tiny, color=color.new(color.green, 0), textcolor=color.new(color.white, 0))

dnPlot2 = plot(trend2 == 1 ? na : dn2, title='Downtrend (Slow)', style=plot.style_linebr, linewidth=2, color=color.new(color.red, transp_st))
sellSignal2 = trend2 == -1 and trend2[1] == 1
plotshape(sellSignal2 ? dn2 : na, title='Downtrend Start (Slow)', location=location.absolute, style=shape.circle, size=size.tiny, color=color.new(color.red, transp_st))
plotshape(sellSignal2 and showlabels ? dn2 : na, title='Sell', text='Sell', location=location.absolute, style=shape.labeldown, size=size.tiny, color=color.new(color.red, 0), textcolor=color.new(color.white, 0))

mPlot2 = plot(ohlc4, title='', style=plot.style_circles, linewidth=0, color=na)
longFillColor2 = highlighting2 ? trend2 == 1 ? color.green : color.black : color.black
shortFillColor2 = highlighting2 ? trend2 == -1 ? color.red : color.black : color.black
fill(mPlot2, upPlot2, title='Uptrend Shading (Slow)', color=color.new(longFillColor2, transp_hl))
fill(mPlot2, dnPlot2, title='Downtrend Shading (Slow)', color=color.new(shortFillColor2, transp_hl))


if buySignal2
    strategy.entry("Enter Long", strategy.long)
else if sellSignal2
    strategy.entry("Enter Short", strategy.short)
Nội dung liên quan
- Supertrend+4 chuyển động
- Mây mắt đầu tiên và chiến lược ATR
- Chiến lược phá vỡ giả mạo hỗ trợ nhiều đường đồng chiều kết hợp với hệ thống ngăn chặn tổn thất ATR
- AlphaTrend
- Chiến lược phá vỡ đường thẳng ATR
- Chỉ dẫn đường
- Chiến lược giao dịch biến động có thể mở rộng trong ngày
- Chiến lược theo dõi xu hướng đường tín hiệu động kết hợp ATR và khối lượng giao dịch
- Nhiều đường xu hướng vượt qua chiến lược định lượng chéo
- Chiến lược khôi phục giá trị trung bình hai đường thẳng kết hợp với kiểm soát rủi ro
Nhiều hơn nữa
- Xu hướng Fukuiz
- Bốt của Johnny.
- SSL lai
- Cửa ra đèn chùm
- RISOTTO
- Chiến lược trong ngày của EMA
- Điểm trung tâm siêu xu hướng
- Supertrend+4 chuyển động
- ZigZag dựa trên động lượng
- VuManChu Cipher B + Divergences chiến lược
- Super Scalper
- Kiểm tra ngược - Chỉ số
- Trendycious
- Sma BTC killer
- Mẫu cảnh báo ML
- Tiến trình Fibonacci với các đoạn phá vỡ
- RSI MTF Ob+Os
- Fukuiz Octa-EMA + Ichimoku
- CCI MTF Ob+Os
- MACD thông minh hơn