Xu hướng Fukuiz
Tác giả:ChaoZhang, Ngày: 2022-05-18 10:25:47Tags:RMARSI
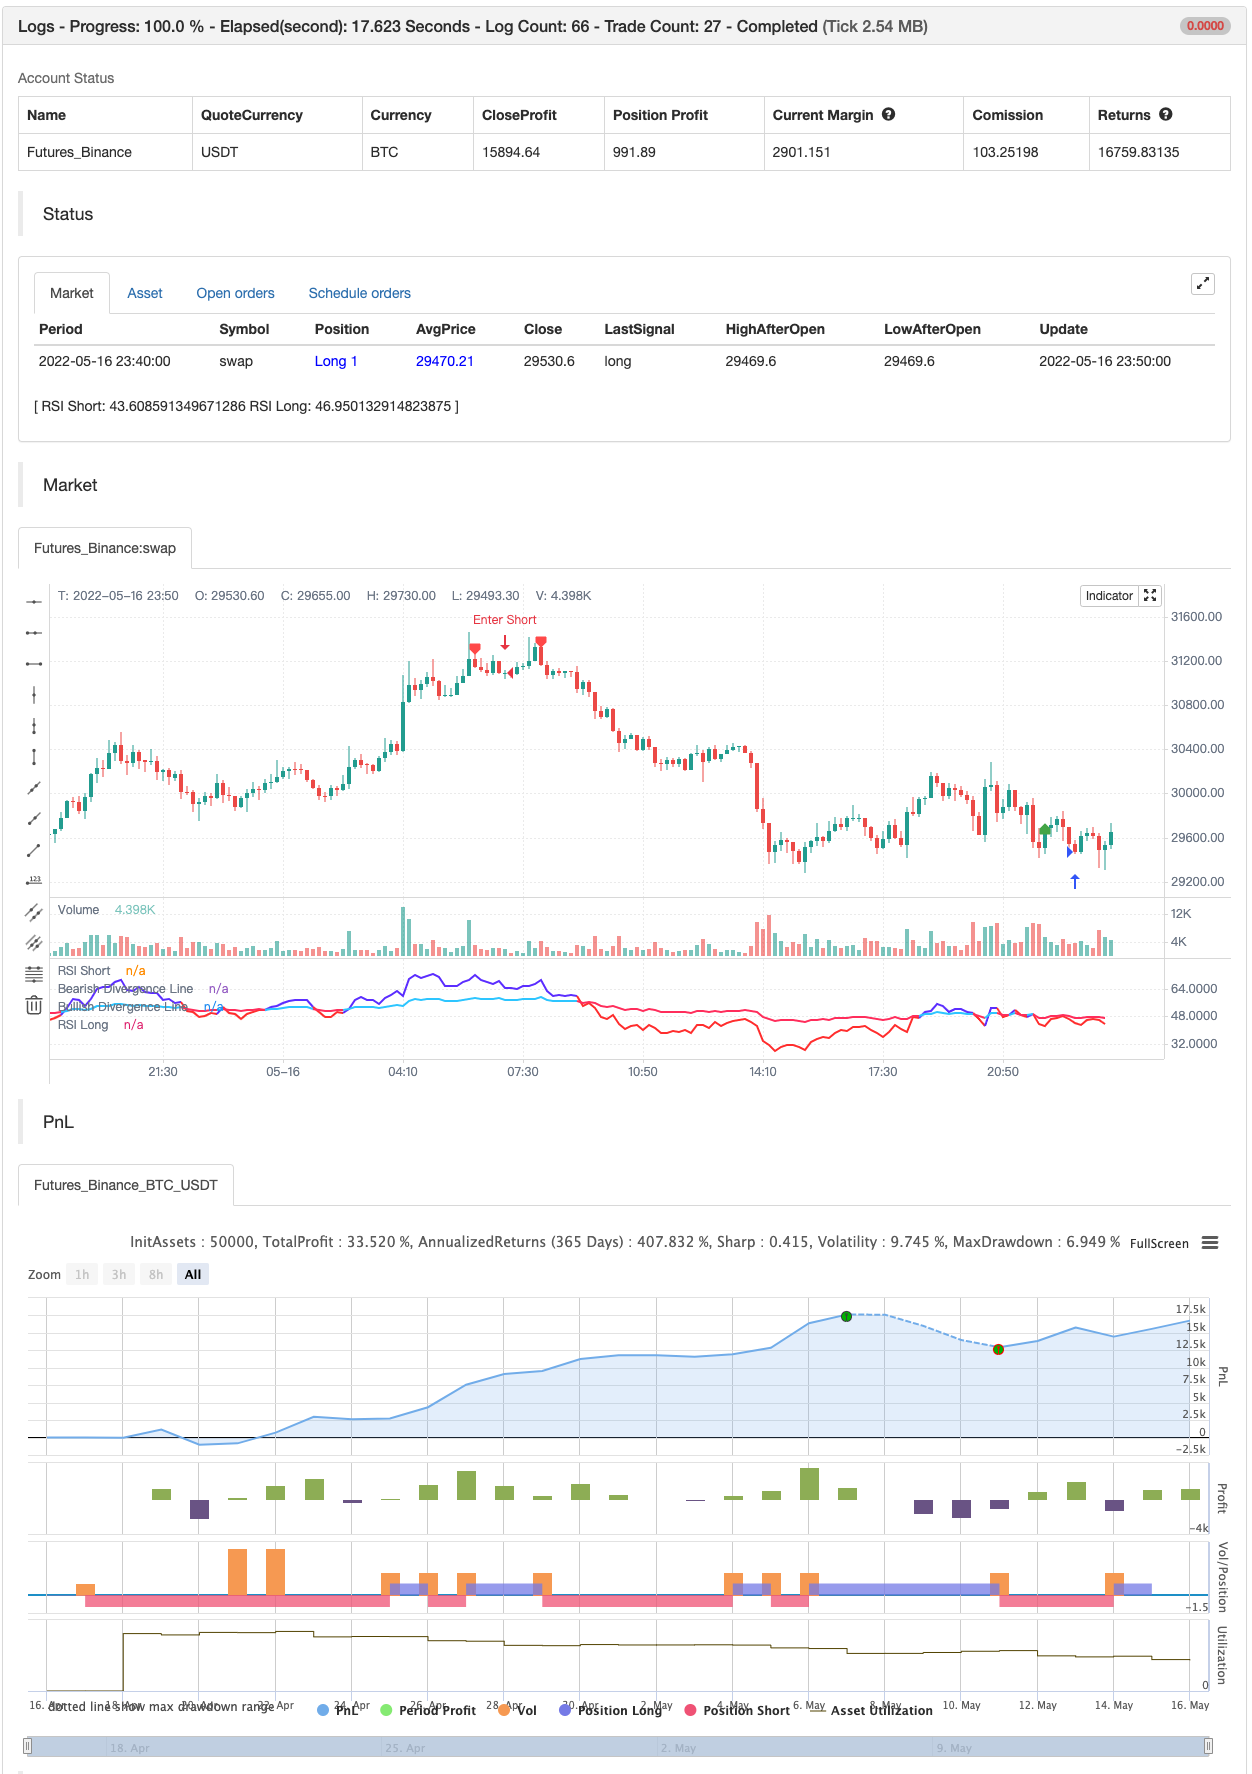
Chỉ số này dựa trên RSI của 2 giai đoạn khác nhau.
# Một giới thiệu ngắn về RSI # Chỉ số sức mạnh tương đối (RSI) là một chỉ số động lực được sử dụng trong phân tích kỹ thuật để đo cường độ của những thay đổi giá gần đây để đánh giá các điều kiện mua quá mức hoặc bán quá mức trong giá của một cổ phiếu hoặc tài sản khác.
Việc giải thích và sử dụng truyền thống của chỉ số RSI là các giá trị 70 hoặc cao hơn cho thấy một chứng khoán đang bị mua quá mức hoặc đánh giá quá cao và có thể được chuẩn bị cho một sự đảo ngược xu hướng hoặc giảm giá điều chỉnh.
Trong chỉ số này Tôi thấy rằng bạn có thể sử dụng 2 chỉ số RSI với các khoảng thời gian khác nhau để gợi ý xu hướng tăng và xu hướng giảm.
# Điều kiện giữa ngắn và dài RSI vượt qua # Crossover = xu hướng tăng (vùng xanh) Crossunder = Xu hướng giảm (vùng đỏ)
backtesting

/*backtest
start: 2022-04-17 00:00:00
end: 2022-05-16 23:59:00
period: 10m
basePeriod: 1m
exchanges: [{"eid":"Futures_Binance","currency":"BTC_USDT"}]
*/

//@version=5
//Fukuiz
indicator(title='Fukuiz Trend', shorttitle='Fukuiz Trend', format=format.price, precision=2, timeframe='')

//color//
colorwhite = #FFFFFF
colorblue = #6633FF
colorred = #FF3333
colorblue2 = #33CCFF
colorpink = #FF3366

//Fuction//
len = input.int(24, minval=1, title='RSI Short')
len2 = input.int(100, minval=1, title='RSI Long')
src = input(open, 'Source')
up = ta.rma(math.max(ta.change(src), 0), len)
down = ta.rma(-math.min(ta.change(src), 0), len)
up2 = ta.rma(math.max(ta.change(src), 0), len2)
down2 = ta.rma(-math.min(ta.change(src), 0), len2)
rsi = down == 0 ? 100 : up == 0 ? 0 : 100 - 100 / (1 + up / down)
rsi2 = down2 == 0 ? 100 : up2 == 0 ? 0 : 100 - 100 / (1 + up2 / down2)

Bullish = rsi > rsi2
Bearish = rsi < rsi2
Fukuizcolor = Bullish ? color.new(colorblue,0) : Bearish ? color.new(colorred,0) : na
Fukuizcolor2 = Bullish ? color.new(colorblue2,0) : Bearish ? color.new(colorpink,0) : na
Fukuizcolor3 = Bullish ? color.new(colorblue,75) : Bearish ? color.new(colorred,75) : na

//Plot//
l1 = plot(rsi, 'RSI Short', color=Fukuizcolor, linewidth=2, style=plot.style_line)
l2 = plot(rsi2, 'RSI Long', color=Fukuizcolor2, linewidth=2, style=plot.style_line)
band2 = hline(50, 'Middle Band', color=#FFCC99)
band1 = hline(70, 'Upper Band', color=#FFCC99)
band0 = hline(30, 'Lower Band', color=#FFCC99)
fill(band1, band0, color.new(#0946CA, 90), title='Background')
fill(l1, l2, color=Fukuizcolor3, title='Trend Background')


//DIVERGENCE//
lbR = input(title='Pivot Lookback Right', defval=5)
lbL = input(title='Pivot Lookback Left', defval=5)
rangeUpper = input(title='Max of Lookback Range', defval=60)
rangeLower = input(title='Min of Lookback Range', defval=5)
plotBull = input(title='Bullish Divergence', defval=true)
plotBear = input(title='Bearish Divergence', defval=true)
bearColor = color.red
bullColor = color.green
hiddenBullColor = color.new(color.green, 80)
hiddenBearColor = color.new(color.red, 80)
textColor = color.white
noneColor = color.new(color.white, 100)
osc = ta.rsi(src, len)

plFound = na(ta.pivotlow(osc, lbL, lbR)) ? false : true
phFound = na(ta.pivothigh(osc, lbL, lbR)) ? false : true
_inRange(cond) =>
    bars = ta.barssince(cond == true)
    rangeLower <= bars and bars <= rangeUpper

oscHL = osc[lbR] > ta.valuewhen(plFound, osc[lbR], 1) and _inRange(plFound[1])
priceLL = low[lbR] < ta.valuewhen(plFound, low[lbR], 1)
bullCond = plotBull and priceLL and oscHL and plFound

plot(plFound ? osc[lbR] : na, offset=-lbR, title='Bullish Divergence Line', linewidth=2, color=bullCond ? bullColor : noneColor,display=display.none)

plotshape(bullCond ? osc[lbR] : na, offset=-lbR, title='Bullish Divergence Label', text=' Bull ', style=shape.labelup, location=location.absolute, color=color.new(bullColor, 0), textcolor=color.new(textColor, 0))

oscLH = osc[lbR] < ta.valuewhen(phFound, osc[lbR], 1) and _inRange(phFound[1])
priceHH = high[lbR] > ta.valuewhen(phFound, high[lbR], 1)
bearCond = plotBear and priceHH and oscLH and phFound

plot(phFound ? osc[lbR] : na, offset=-lbR, title='Bearish Divergence Line', linewidth=2, color=bearCond ? bearColor : noneColor,display=display.none)

plotshape(bearCond ? osc[lbR] : na, offset=-lbR, title='Bearish Divergence Label', text=' Bear ', style=shape.labeldown, location=location.absolute, color=color.new(bearColor, 0), textcolor=color.new(textColor, 0))


if bullCond
    strategy.entry("Enter Long", strategy.long)
else if bearCond
    strategy.entry("Enter Short", strategy.short)
- Chiến lược kim tự tháp thông minh đa chỉ số
- Chiến lược giao dịch chỉ số tương đối mạnh và yếu trên nhiều chỉ số
- Scalping EMA ADX RSI với Buy/Sell
- Super Scalper - 5 phút 15 phút
- VAWSI và chiến lược đảo ngược xu hướng liên tục kết hợp với hệ thống phân tích tổng hợp đa chỉ số tính toán độ dài động
- Chiến lược giao dịch định lượng các thông số động của RSI hỗ trợ giao dịch đa đường
- Động lực RSI thông minh chọn thời gian chiến lược giao dịch
- Chiến lược giao dịch tự nhiên kết hợp MACD và RSI
- Chiến lược giao dịch định lượng theo dõi và xác nhận nhiều xu hướng chéo động đa trượt trung tuyến
- Chiến lược chỉ số RSI tương đối mạnh và yếu
- CM MACD Chỉ số tùy chỉnh - Khung thời gian đa - V2
- HODL LINE
- 2 Phát hiện hướng màu trung bình chuyển động
- Scalping PullBack Tool R1
- Chiến lược mua&bán phụ thuộc vào AO+Stoch+RSI+ATR
- EMA TREND CLOUD
- Tỷ lệ năng lượng hướng tăng tốc theo khối lượng RedK
- Donchian Breakout không sơn lại
- RedK Momentum Bars
- SuperJump quay lại Bollinger Band
- Bốt của Johnny.
- SSL lai
- Cửa ra đèn chùm
- RISOTTO
- Chiến lược trong ngày của EMA
- Điểm trung tâm siêu xu hướng
- Supertrend+4 chuyển động
- ZigZag dựa trên động lượng
- VuManChu Cipher B + Divergences chiến lược
- Khái niệm Dual SuperTrend