概述
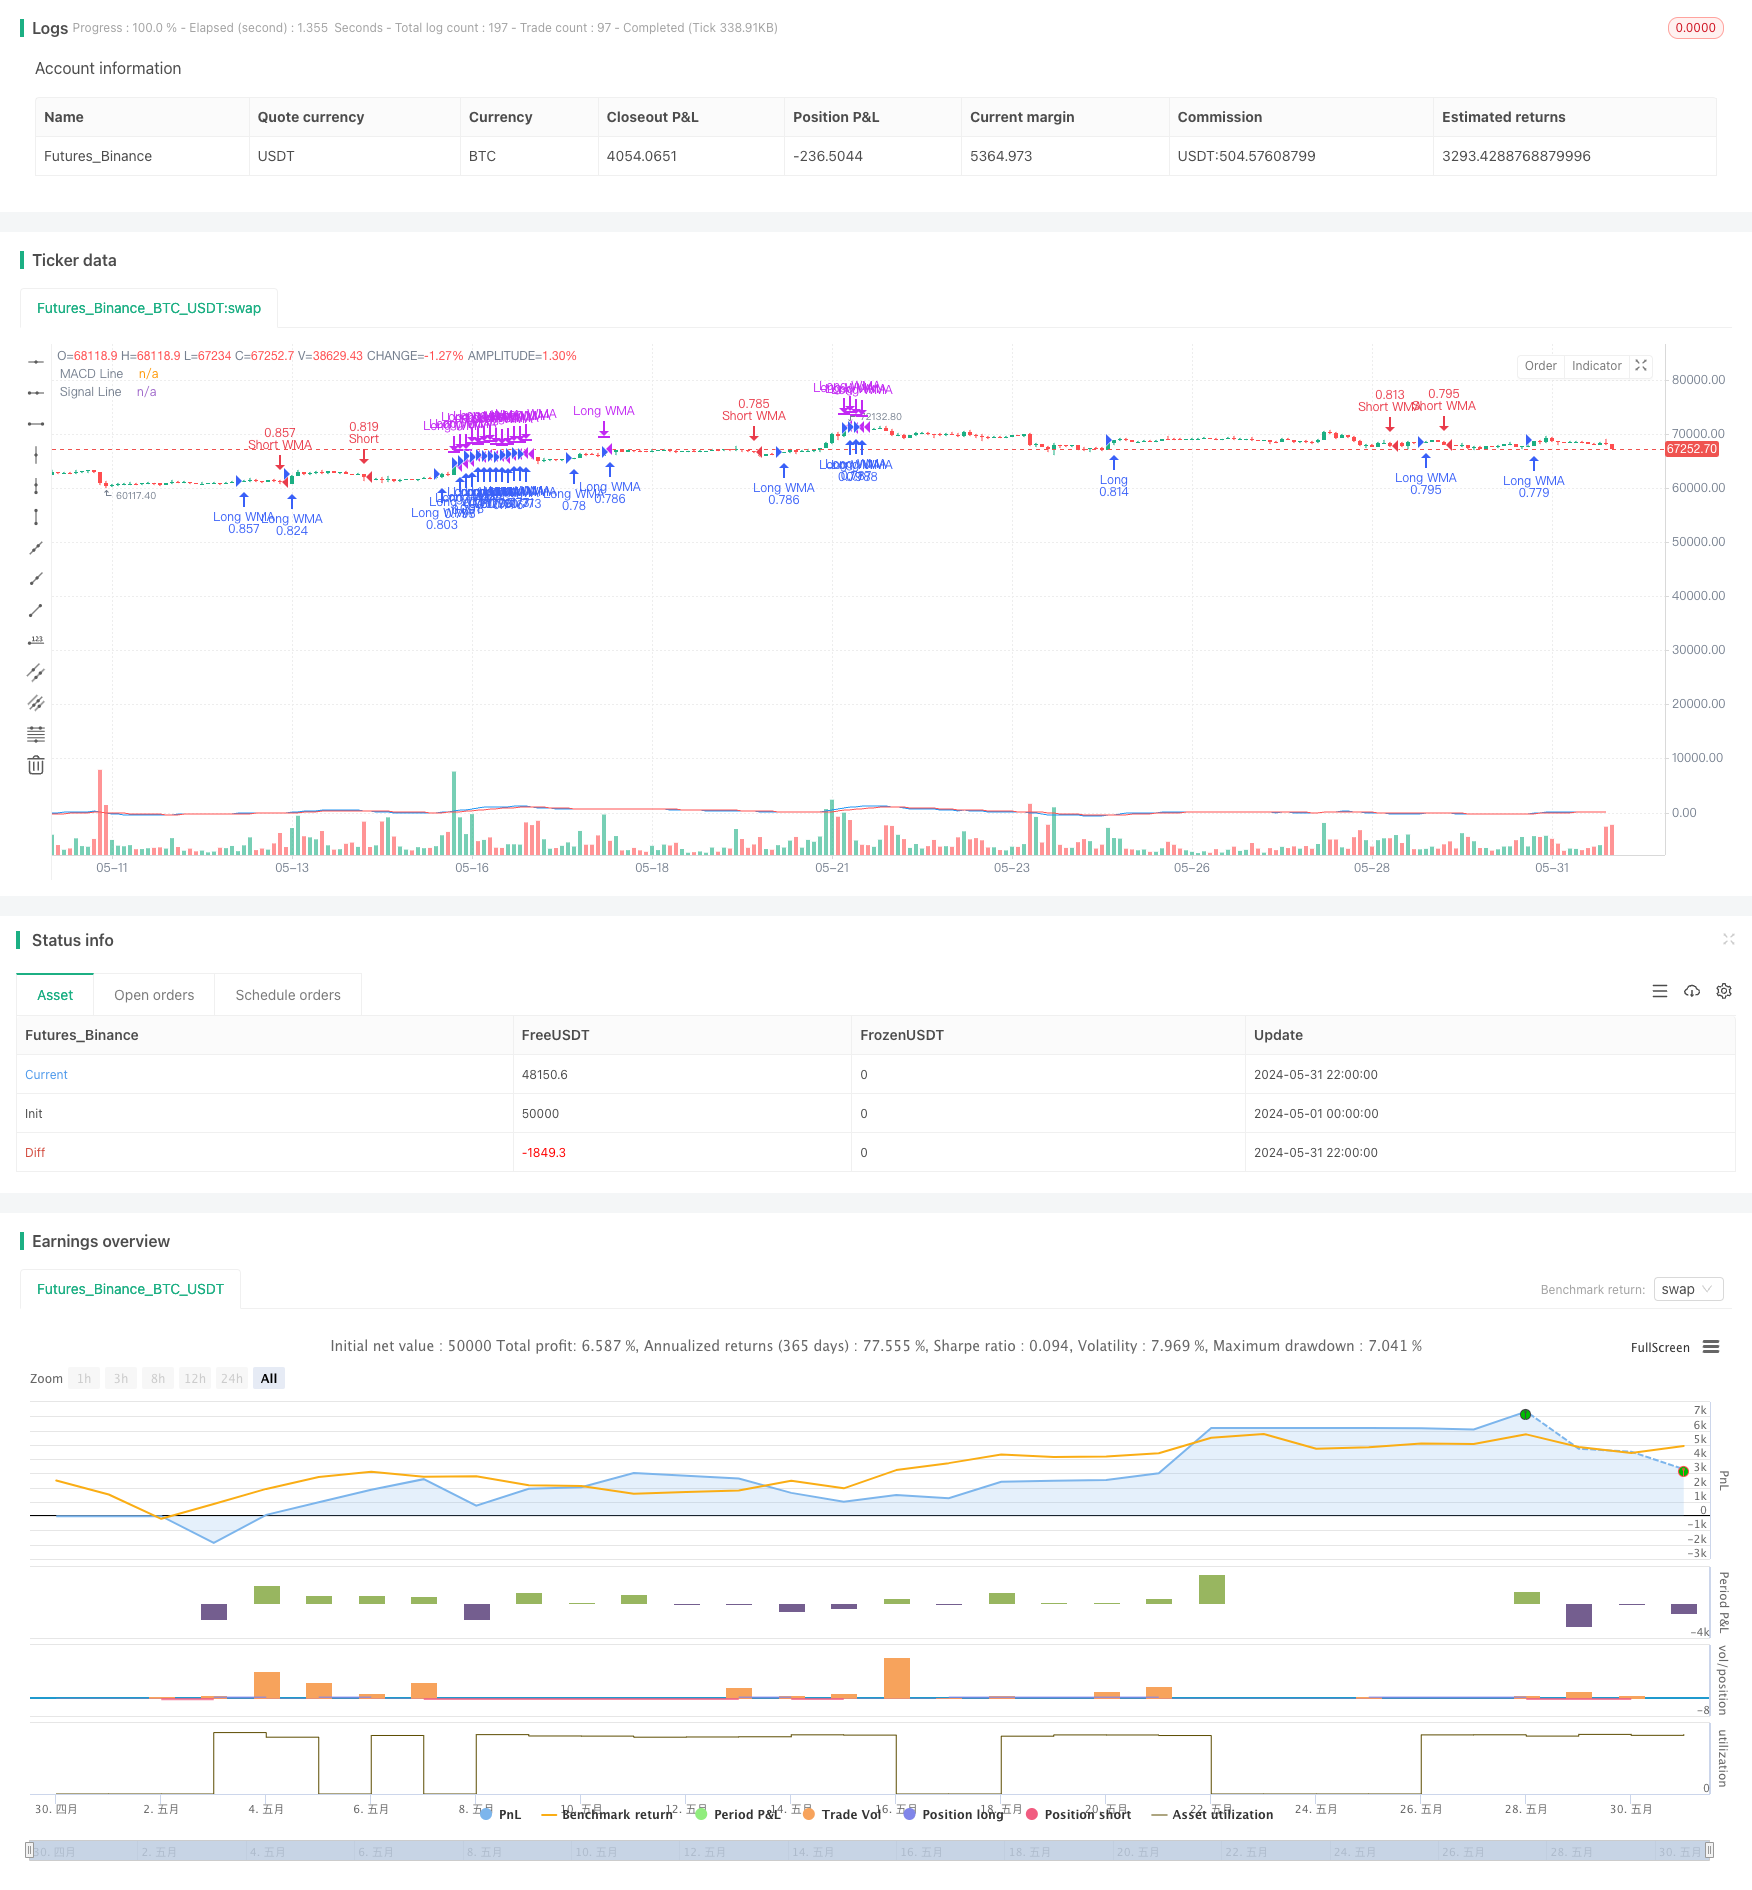
该策略结合了MACD和RSI两个技术指标,利用MACD的交叉信号和RSI的超买超卖信号来判断交易时机。同时,策略还引入了加权移动平均线(WMA)作为辅助判断,以提高策略的可靠性。策略在1小时时间框架下运行,当MACD出现金叉且RSI大于50时开多仓,当MACD出现死叉且RSI小于50时开空仓。同时,当RSI大于70时平多仓,RSI小于30时平空仓。此外,策略还设置了多个时间框架的变量,用于判断不同时间尺度下的趋势变化。
策略原理
该策略的核心是MACD和RSI两个技术指标的结合运用。MACD由快线(短期移动平均线)和慢线(长期移动平均线)的差值构成,能够反映市场的趋势变化。当快线上穿慢线时,形成金叉,表明上升趋势,反之则形成死叉,表明下跌趋势。RSI是衡量市场超买超卖状态的指标,当RSI大于70时,表明市场处于超买状态,可能面临回调风险;当RSI小于30时,表明市场处于超卖状态,可能迎来反弹机会。
该策略将MACD和RSI结合起来,利用MACD的趋势判断和RSI的超买超卖判断,可以更准确地把握交易时机。同时,策略还引入了加权移动平均线(WMA)作为辅助判断,WMA相比普通移动平均线更加重视近期价格,能够更敏感地反映价格变化。
此外,策略还设置了多个时间框架的变量(如15分钟、30分钟、1小时、2小时等),用于判断不同时间尺度下的趋势变化。这种多时间框架的分析方法,可以帮助策略更全面地把握市场趋势,提高决策的准确性。
优势分析
- 结合了MACD和RSI两个有效的技术指标,能够较好地把握市场趋势和超买超卖状态,提高交易决策的准确性。
- 引入了加权移动平均线(WMA)作为辅助判断,WMA更加重视近期价格,能够更敏感地反映价格变化,提高策略的适应性。
- 设置了多个时间框架的变量,实现了多时间框架的联合分析,可以更全面地把握市场趋势,提高决策的可靠性。
- 在1小时的时间框架下运行,交易频率适中,可以较好地平衡交易成本和收益。
- 设置了明确的开仓和平仓条件,如MACD金叉死叉、RSI超买超卖等,易于理解和实施。
风险分析
- MACD和RSI都是滞后指标,在市场快速变化时,可能出现指标信号与价格脱节的情况,导致错误信号。
- 策略在单一时间框架(1小时)下运行,可能无法充分捕捉到不同时间尺度下的趋势变化,存在一定的局限性。
- 策略缺乏对风险的控制措施,如止损和仓位管理等,在市场剧烈波动时,可能面临较大的回撤风险。
- 策略的参数设置(如MACD的快慢线周期、RSI的时间周期等)可能需要根据不同的市场状况进行调整,参数的选择存在一定的主观性和不确定性。
优化方向
- 引入更多的技术指标,如布林带、ATR等,构建更加稳健的交易信号,提高策略的可靠性。
- 优化策略的时间框架选择,如增加日线等更高级别的时间框架,以更好地把握大趋势,同时在低级别时间框架(如15分钟、5分钟等)设置具体的入场点,提高策略的精准度。
- 加入风险控制措施,如设置合理的止损位,对持仓头寸进行限制,以控制回撤风险。
- 对策略的参数进行优化,可以使用机器学习等方法,根据历史数据自动寻找最优参数组合,减少主观判断的影响。
- 考虑引入市场情绪等其他因素,如交易量、持仓量等,以更全面地把握市场状态,提高策略的适应性。
总结
该策略通过结合MACD和RSI两个有效的技术指标,同时引入WMA作为辅助判断,在1小时时间框架下进行交易决策。策略逻辑清晰,易于理解和实施,能够较好地把握市场趋势和超买超卖状态,具有一定的可行性。但是,策略也存在一些局限性和风险,如滞后性、单一时间框架、缺乏风险控制等。未来可以从引入更多指标、优化时间框架、加强风险控制、参数优化等方面对策略进行改进,以提高其稳健性和盈利能力。总的来说,该策略为量化交易提供了一种思路,但还需要在实践中不断优化和完善。
/*backtest
start: 2024-05-01 00:00:00
end: 2024-05-31 23:59:59
period: 2h
basePeriod: 15m
exchanges: [{"eid":"Futures_Binance","currency":"BTC_USDT"}]
*/

//@version=5
strategy("Improved MACD and RSI Trading Strategy", overlay=true, initial_capital=10000, commission_type=strategy.commission.percent, commission_value=0.01, default_qty_type=strategy.percent_of_equity, default_qty_value=100)

// MACD 設置
fast_length = input(12, title="MACD Fast Length")
slow_length = input(26, title="MACD Slow Length")
signal_smoothing = input(9, title="MACD Signal Smoothing")

// RSI 設置
input_rsi_length = input.int(14, title="RSI Length")
input_rsi_source = input(close, "RSI Source")

RSI = ta.rsi(input_rsi_source, input_rsi_length)

// 計算MACD和信號線
[macdLine, signalLine, _] = ta.macd(close, fast_length, slow_length, signal_smoothing)

// 自然交易理論:利用MACD和RSI的結合
ma(source, length, type) =>
    switch type
        "SMA" => ta.sma(source, length)
        "EMA" => ta.ema(source, length)
        "SMMA (RMA)" => ta.rma(source, length)
        "WMA" => ta.wma(source, length)
        "VWMA" => ta.vwma(source, length)

maTypeInput = input.string("SMA", title="Moving Average Type", options=["SMA", "EMA", "SMMA (RMA)", "WMA", "VWMA"], group="MA Settings")
maLengthInput = input.int(14, title="Moving Average Length", group="MA Settings")

macdMA = ma(macdLine, maLengthInput, maTypeInput)

// 設置交易信號
longCondition = ta.crossover(macdLine, signalLine) and macdLine > macdMA and RSI < 70
shortCondition = ta.crossunder(macdLine, signalLine) and macdLine < macdMA and RSI > 30

// 定義時間框架
tf_15m = ta.change(RSI, 15) > 0 ? 1 : 0
tf_30m = ta.change(RSI, 30) > 0 ? 1 : 0
tf_1h = ta.change(RSI, 60) > 0 ? 1 : 0
tf_2h = ta.change(RSI, 120) > 0 ? 1 : 0
tf_4h = ta.change(RSI, 240) > 0 ? 1 : 0
tf_6h = ta.change(RSI, 360) > 0 ? 1 : 0
tf_8h = ta.change(RSI, 480) > 0 ? 1 : 0
tf_12h = ta.change(RSI, 720) > 0 ? 1 : 0
tf_1d = ta.change(RSI, 1440) > 0 ? 1 : 0

// 設置開倉、平倉和空倉條件
if (longCondition and tf_1h and RSI > 50)
    strategy.entry("Long", strategy.long)
if (shortCondition and tf_1h and RSI < 50)
    strategy.entry("Short", strategy.short)

if (tf_1h and RSI > 70)
    strategy.close("Long")
if (tf_1h and RSI < 30)
    strategy.close("Short")

// 加入其他策略
// 定義加權平均價格
wma(source, length) =>
    wma = 0.0
    sum = 0.0
    sum_wts = 0.0
    for i = 0 to length - 1
        wts = (length - i) * (length - i)
        sum := sum + source[i] * wts
        sum_wts := sum_wts + wts
    wma := sum / sum_wts

wmaLength = input.int(20, title="WMA Length", group="Other Strategies")
wmaValue = wma(close, wmaLength)

// 設置交易信號
longWMACondition = close > wmaValue
shortWMACondition = close < wmaValue

if (longWMACondition and tf_1h and RSI > 50)
    strategy.entry("Long WMA", strategy.long)
if (shortWMACondition and tf_1h and RSI < 50)
    strategy.entry("Short WMA", strategy.short)

if (tf_1h and RSI > 70)
    strategy.close("Long WMA")
if (tf_1h and RSI < 30)
    strategy.close("Short WMA")

// 繪製MACD和RSI
plot(macdLine, color=color.blue, title="MACD Line")
plot(signalLine, color=color.red, title="Signal Line")