Chiến lược giao dịch điểm đảo chiều trung bình động kép
Tổng quan
Chiến lược giao dịch điểm chuyển đổi hai dòng đồng bằng là một chiến lược giao dịch dựa trên giao dịch chéo đường đồng bằng. Nó sử dụng hai trung bình di chuyển với các tham số khác nhau để đánh giá thời gian vào và ra dựa trên tình trạng chuyển đổi của chúng. Chiến lược này đơn giản, trực quan, dễ thực hiện và phù hợp với giao dịch đường dài và trung bình.
Nguyên tắc chiến lược
Chiến lược này sử dụng giá làm nguồn đầu vào giá, tính toán đường trung bình cho hai tham số khác nhau, SMA1 và SMA2. Chiến lược sử dụng chỉ số ROC để xác định sự chuyển động của đường trung bình. SMA1 được coi là chuyển động lên khi ROC của SMA1 vượt quá ngưỡng tích cực được đặt và ghi lại tín hiệu tăng của SMA1; SMA1 được coi là chuyển động xuống khi ROC của SMA1 giảm xuống và ghi lại tín hiệu giảm của SMA1.
Khi SMA1 quay lên và một đường K SMA2 quay xuống, tạo ra một tín hiệu mua, làm nhiều; khi SMA1 quay xuống và một đường K SMA2 quay lên, tạo ra một tín hiệu bán, làm trống.
Chiến lược này sử dụng hai đường cong để xác định hướng giao dịch, một đường cong để xác nhận thời điểm vào, và hai đường cong để đảm bảo thay đổi xu hướng vào thời điểm, có thể lọc hiệu quả các phá vỡ giả.
Phân tích lợi thế
Sử dụng hai đường chéo và chuyển hướng, có thể lọc hiệu quả các đột phá giả và tăng độ chính xác của lối vào.
Chuyển đổi đường trung bình kết hợp với chỉ số ROC có thể xác định rõ thời gian chuyển đổi, tránh giao dịch thường xuyên.
Sử dụng đường trung bình hai đường, bạn có thể theo dõi xu hướng chính và có được lợi nhuận lớn hơn.
Chiến lược logic đơn giản, rõ ràng, dễ hiểu và phù hợp cho người mới bắt đầu giao dịch số lượng.
Các tham số có thể tùy chỉnh, thích ứng với các môi trường thị trường khác nhau, có khả năng thích ứng mạnh mẽ.
Phân tích rủi ro
Giao nhau giữa hai đường cong có thể tạo ra một số lượng lớn tín hiệu giả trong tình huống chấn động, dẫn đến tổn thất.
Các tham số ROC cần được tối ưu hóa chính xác, nếu không chuyển sang nhận dạng sẽ có lỗi và ảnh hưởng đến hiệu suất của chiến lược.
Các biến động lớn có thể gây ra nhiều lần dừng lỗ, có thể tránh được bằng cách mở rộng mức dừng lỗ.
Chỉ cần dựa trên chỉ số trung bình, các sự kiện bất ngờ như tin tức quan trọng có thể gây ra thiệt hại.
Cần lưu ý rằng các tham số được tối ưu hóa quá phù hợp, chu kỳ thử nghiệm phải đủ dài để bao gồm các trường hợp khác nhau.
Hướng tối ưu hóa
Tối ưu hóa tham số trung bình di chuyển để tìm kết hợp chu kỳ trung bình tốt nhất
Tối ưu hóa các tham số ROC để tăng độ chính xác nhận định hướng
Tăng cơ chế dừng lỗ, có thể sử dụng dừng lỗ động vượt qua mức giá tùy chỉnh
Thêm các điều kiện bổ sung, chẳng hạn như kích hoạt chỉ số khối lượng giao dịch, tránh phá vỡ giả
Kết hợp với các chỉ số khác như MACD, BOLL, để tăng hiệu quả ra quyết định
Sử dụng phương pháp học máy để tự động tối ưu hóa các tham số để thích ứng với sự thay đổi của thị trường
Tóm tắt
Chiến lược điểm chuyển đổi hai đường đều là một chiến lược theo dõi xu hướng đơn giản và thực tế. Nó chỉ cần các chỉ số đường đều cơ bản để thực hiện, logic rõ ràng và dễ hiểu, rất phù hợp để học và thực hành cho người mới bắt đầu giao dịch định lượng.
Overview
The Dual Moving Average Turning Point strategy is a trend following strategy based on moving average crossovers. It uses two moving averages with different parameter settings and determines entry and exit points according to their turning directions. This strategy is simple and intuitive, easy to implement, and suitable for medium-to-long term trading.
Strategy Logic
The strategy uses Price as the price input source and calculates two moving averages, SMA1 and SMA2, with different parameters. It uses the ROC indicator to determine the turning directions of the moving averages. When SMA1’s ROC value exceeds the positive threshold, it is considered an upward turn of SMA1 and an upward signal is recorded. When SMA1’s ROC value breaks the negative threshold, it is considered a downward turn of SMA1 and a downward signal is recorded. The judgment logic for SMA2 is similar.
When SMA1 turns upward and the previous bar’s SMA2 turns downward, a buy signal is generated to go long. When SMA1 turns downward and the previous bar’s SMA2 turns upward, a sell signal is generated to go short.
The strategy uses the turning directions of two moving averages to determine the trading direction and the turning of one moving average to confirm entry timing. The dual moving average crossover ensures the trend has changed when entering the market, which helps avoid false breakouts.
Advantage Analysis
Using dual moving average crossover and turning points can effectively filter out false breakouts and improve entry accuracy.
Combining moving average turning points with the ROC indicator can clearly identify turning points and avoid frequent trading.
Adopting medium-to-long-term dual moving averages can track the main trend and achieve sizable trend profits.
The strategy logic is simple and clear, easy to understand and implement, suitable for quant trading beginners.
Customizable parameters suit different market environments with strong adaptability.
Risk Analysis
Dual moving average crossovers may generate many false signals in ranging markets, leading to losses.
The ROC parameters need precise optimization, otherwise turn recognition will have errors, affecting strategy performance.
Large periodic ranging markets may trigger stop loss multiple times. Expanding stop loss range can avoid it.
Relying solely on moving averages, it’s hard to respond to sudden events like major news, which may lead to losses.
Note the overfitting problem in parameter optimization. Test period should be long enough to include different market conditions.
Optimization Directions
Optimize moving average parameters to find the best moving average period combination.
Optimize ROC parameters to improve turning point recognition accuracy.
Add stop loss mechanisms such as dynamic stop loss based on breaking customized price levels.
Add additional conditions like volume indicators to avoid false breakouts.
Incorporate other indicators like MACD, BOLL to improve decision making.
Use machine learning etc. to auto optimize parameters and adapt to market changes.
Summary
In summary, the Dual Moving Average Turning Point strategy is a simple and practical trend following strategy. It can be implemented with basic moving average indicators and has clear, easy-to-understand logic, making it very suitable for quant trading beginners to learn and practice. With parameter optimization and stop loss optimization, the strategy stability can be greatly improved. Combining with other auxiliary indicators can further enhance the strategy. The highly customizable strategy can be flexibly applied to different market environments and is a recommended dual moving average trading strategy.
[/trans]
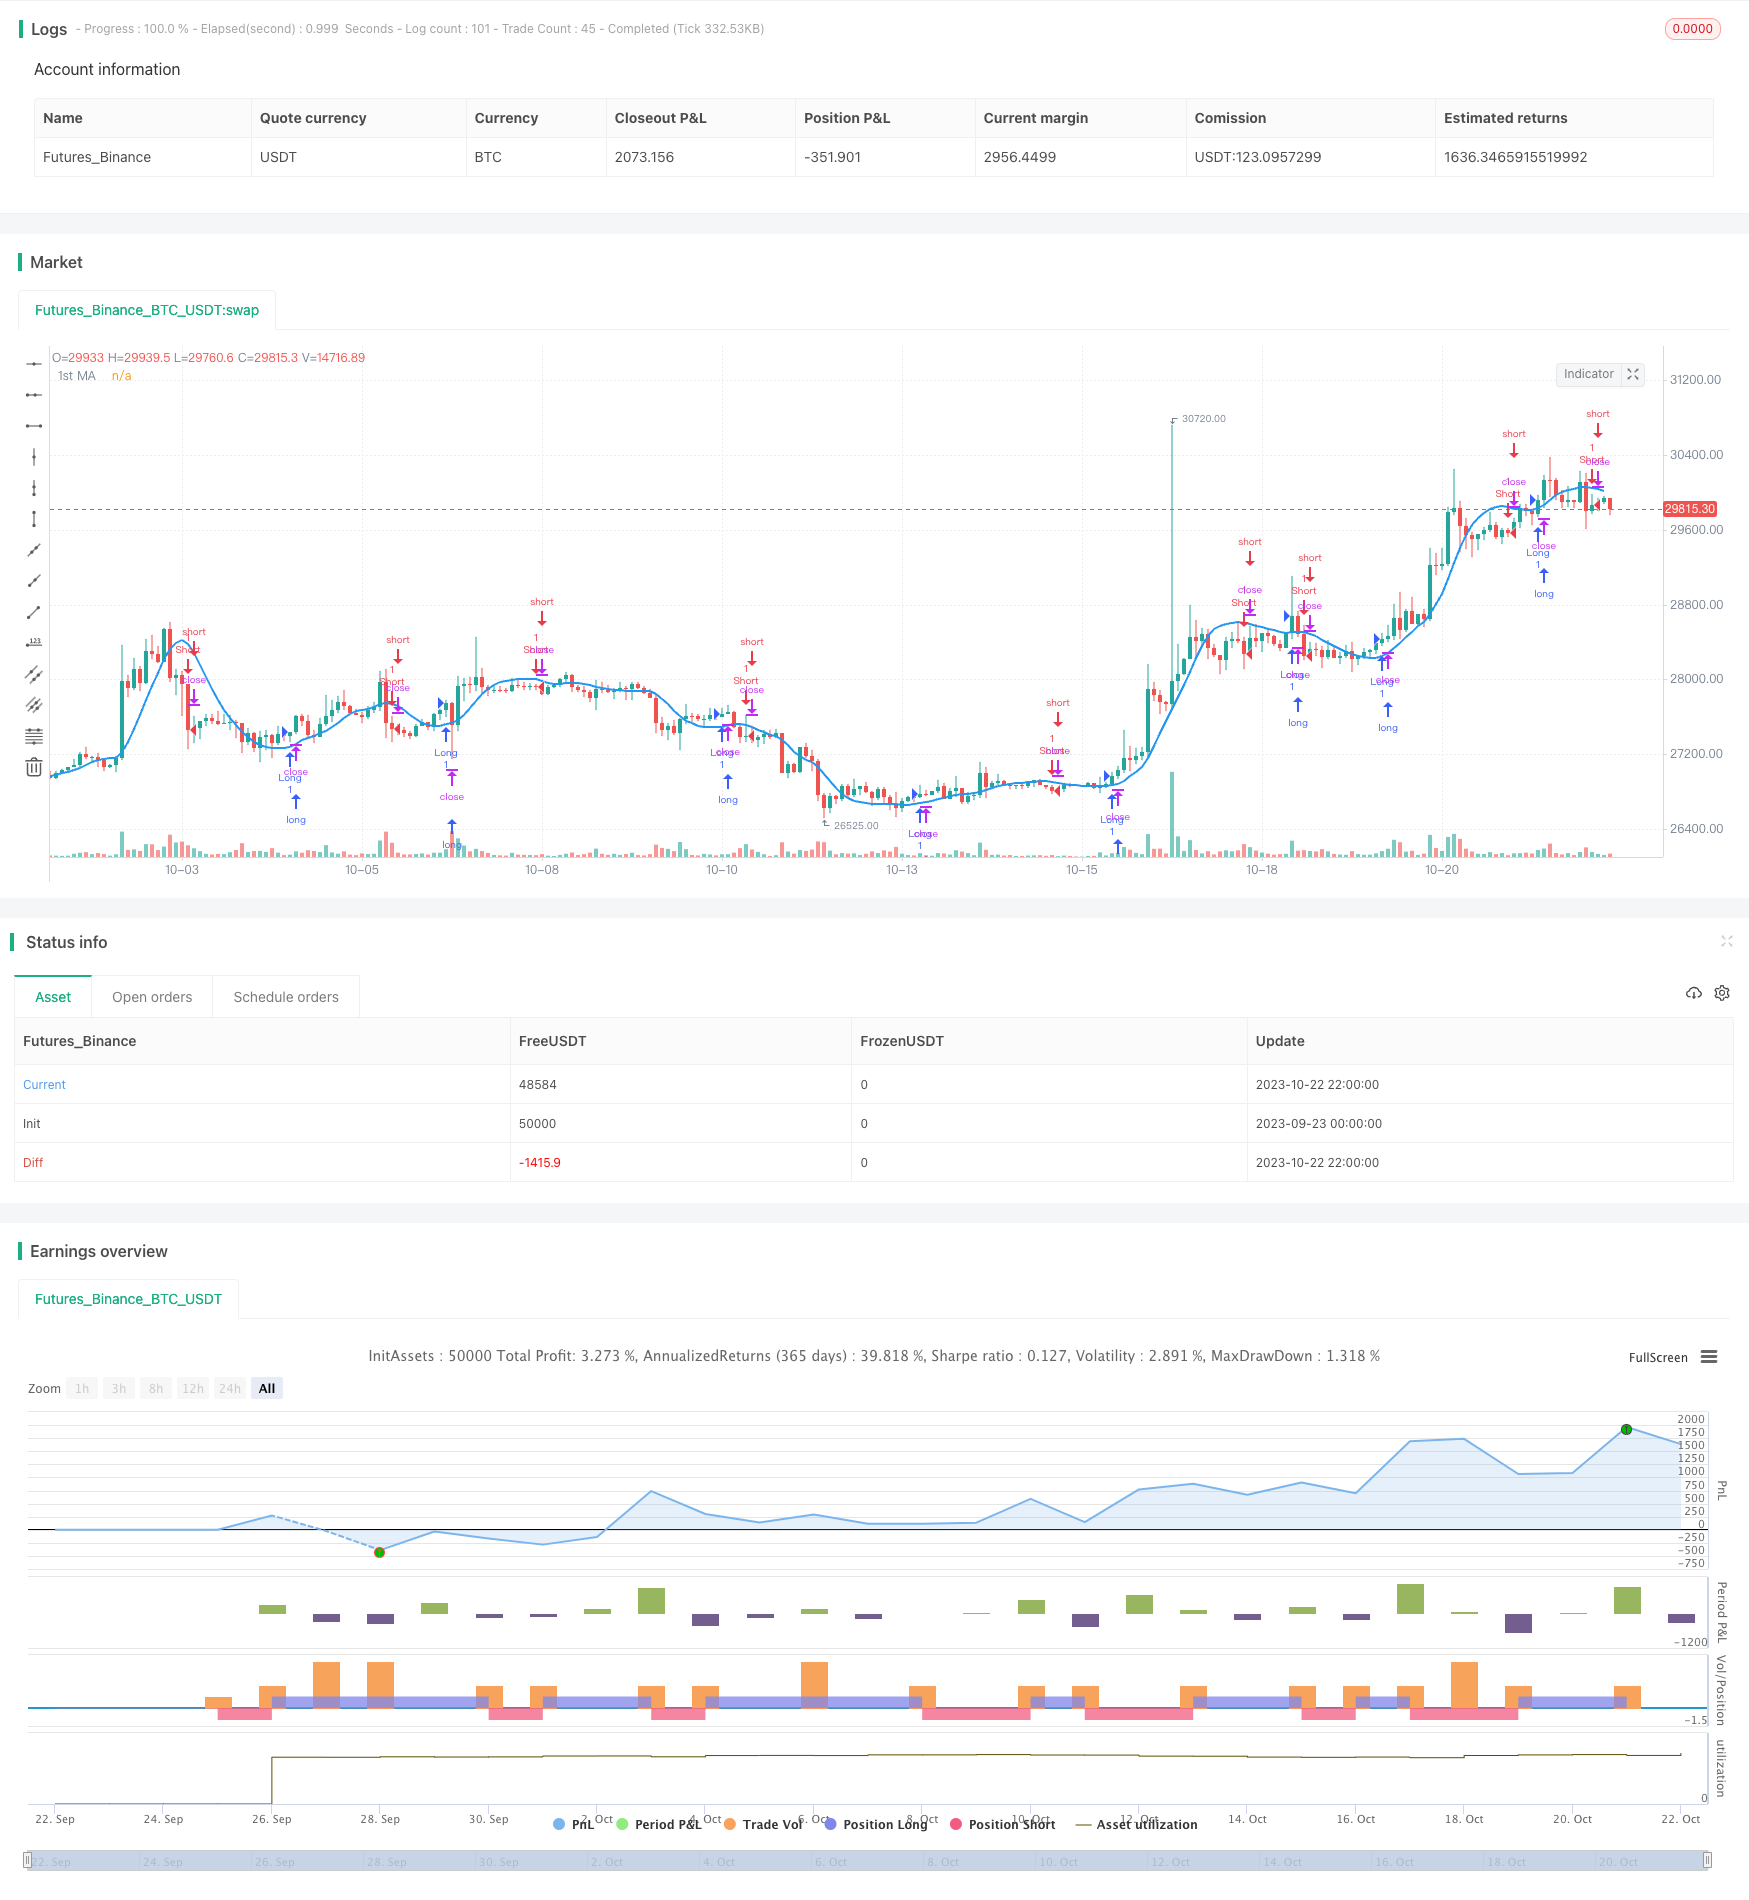
/*backtest
start: 2023-09-23 00:00:00
end: 2023-10-23 00:00:00
period: 2h
basePeriod: 15m
exchanges: [{"eid":"Futures_Binance","currency":"BTC_USDT"}]
*/

//@version=3
strategy("MA Turning Point Strategy", overlay=true)
src = input(close, title="Source")

price = request.security(syminfo.tickerid, timeframe.period, src)
ma1 = input(25, title="1st MA Length")
type1 = input("HMA", "1st MA Type", options=["SMA", "EMA", "HMA", "VWMA"])
f_hma(_src, _length)=>
    _return = wma((2*wma(_src, _length/2))-wma(_src, _length), round(sqrt(_length)))

price1 = if (type1 == "SMA")
    sma(price, ma1)
else
    if (type1 == "EMA")
        ema(price, ma1)
    else
        if (type1 == "VWMA")
            vwma(price, ma1)
        else
            f_hma(price, ma1)

plot(series=price1, style=line,  title="1st MA", color=blue, linewidth=2, transp=0)

lookback1 = input(1, "Lookback 1")
roc1 = roc(price1, lookback1)

ma1up = false
ma1down = false
ma2up = false
ma2down = false

ma1up := nz(ma1up[1])
ma1down := nz(ma1down[1])
ma2up := nz(ma2up[1])
ma2down := nz(ma2down[1])

trendStrength1 = input(2.5, title="Minimum slope magnitude * 100", type=float) * 0.01

if crossover(roc1, trendStrength1)
    ma1up := true
    ma1down := false

if crossunder(roc1, -trendStrength1)
    ma1up := false
    ma1down := true

longCondition = ma1up and ma1down[1]
if (longCondition)
    strategy.entry("Long", strategy.long)

shortCondition = ma1down and ma1up[1]
if (shortCondition)
    strategy.entry("Short", strategy.short)