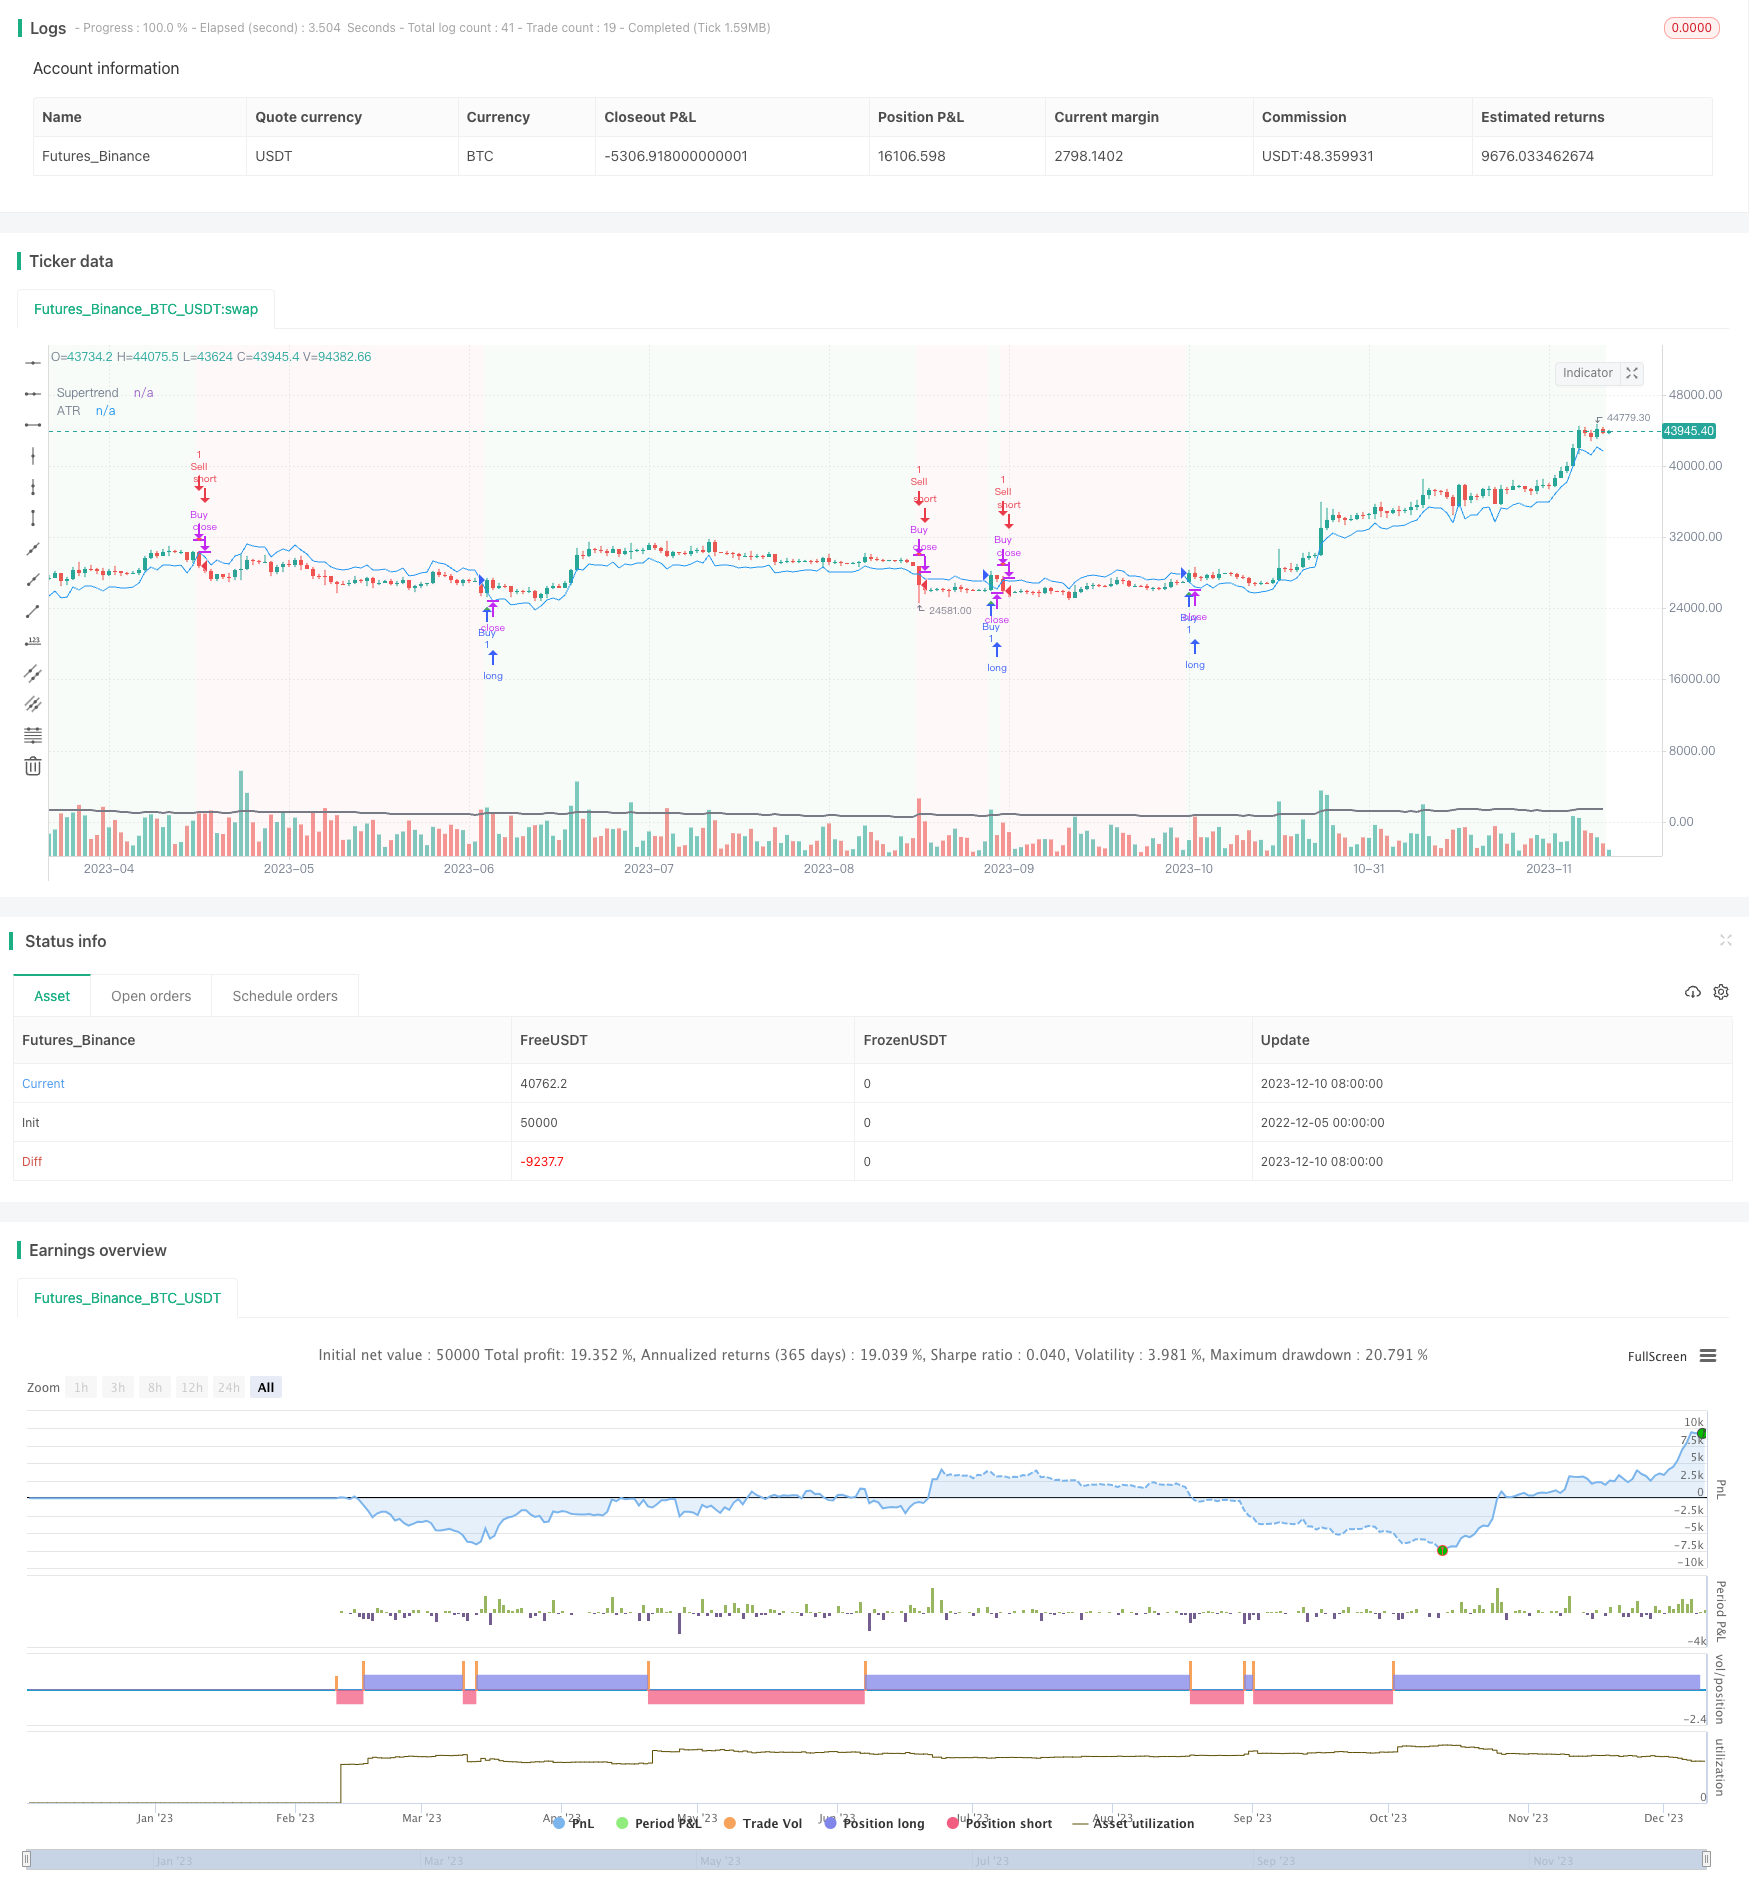
Chiến lược theo xu hướng dựa trên SuperTrend

Chiến lược theo dõi xu hướng dựa trên chỉ số SuperTrend. Chiến lược này sử dụng chỉ số SuperTrend để xác định hướng xu hướng, kết hợp với chỉ số ATR để thiết lập điểm dừng lỗ, để theo dõi xu hướng có rủi ro thấp.
Nguyên tắc chiến lược
Chỉ số trung tâm của chiến lược này là SuperTrend, chỉ số SuperTrend kết hợp với ATR, để đánh giá hướng xu hướng dựa trên sự đột phá của giá. Các phương pháp tính toán cụ thể như sau:
Đường lên đường: đường lên đường = giá hiện tại - ((ATR nhân nhân)) Đường xuống đường: đường xuống đường = giá hiện tại + ((ATR nhân nhân))
Khi giá cao hơn đường ray trên, là xu hướng đi lên; khi giá thấp hơn đường ray dưới, là xu hướng đi xuống.
Chiến lược dựa trên chỉ số SuperTrend để xác định hướng xu hướng, làm nhiều khi xu hướng đi lên và làm rỗng khi xu hướng đi xuống. Đồng thời, chiến lược sử dụng phạm vi biến động trung bình của chỉ số ATR để thiết lập vị trí dừng lỗ và kiểm soát rủi ro.
Lợi thế chiến lược
- Sử dụng chỉ số SuperTrend để đánh giá xu hướng, nắm bắt chính xác xu hướng thị trường
- ATR Stop Loss Stop, kiểm soát hiệu quả lỗ đơn
- Kết hợp xu hướng và dừng lỗ, tổng thể đạt được tỷ lệ thắng cao
- Dễ ra thị trường, dễ bị phá sản, phù hợp để theo dõi đường ngắn
Rủi ro chiến lược
- Chỉ số SuperTrend có vấn đề về tái tạo, không thể hoàn toàn phụ thuộc vào tín hiệu
- Chỉ số ATR không thể thích ứng hoàn toàn với tình trạng khắc nghiệt, có thể bị hư hỏng quá nhiều
- Các chiến lược không thể tự mình đánh giá chất lượng của xu hướng, cần phải kiểm tra xu hướng bằng tay
Phương pháp giải quyết rủi ro: 1) Kiểm tra chất lượng của xu hướng bằng tay, tránh thực hiện thao tác đảo ngược trên đột phá giả 2) Giảm điểm dừng thích hợp để tránh bị dừng nhỏ trong biến động bình thường
Hướng tối ưu hóa chiến lược
- Tăng kiểm tra đa yếu tố để đánh giá chất lượng xu hướng
- Điều chỉnh động ATR tham số kết hợp với chỉ số biến động
- Thêm mô hình học máy hỗ trợ quyết định thời gian giao dịch
- Tối ưu hóa hệ thống chặn lỗ để ngăn chặn sự biến động bình thường bị chặn
Tóm lại: Chiến lược này sử dụng chỉ số SuperTrend để xác định hướng xu hướng, chỉ số ATR đặt trạm dừng lỗ, để thực hiện giao dịch theo dõi xu hướng có rủi ro thấp. Ý tưởng chiến lược rõ ràng, dễ hiểu, có thể điều chỉnh tham số theo sở thích rủi ro của riêng bạn, là một chiến lược theo dõi xu hướng phổ biến.
/*backtest
start: 2022-12-05 00:00:00
end: 2023-12-11 00:00:00
period: 1d
basePeriod: 1h
exchanges: [{"eid":"Futures_Binance","currency":"BTC_USDT"}]
*/

//@version=5
strategy("Advanced Trend Strategy", overlay=true)

// Input parameters
length = input(14, title="ATR Length")
multiplier = input(1.5, title="Multiplier")
src = close

// Calculate ATR
atr_value = ta.atr(length)

// Calculate Supertrend
upst = src - multiplier * atr_value
downst = src + multiplier * atr_value

var float supertrend = na
var float trend_direction = na

if (na(supertrend))
    supertrend := upst

if (src > supertrend)
    supertrend := upst

if (src < supertrend)
    supertrend := downst

// Buy and Sell conditions
buyCondition = ta.crossover(src, supertrend)
sellCondition = ta.crossunder(src, supertrend)

// Execute Buy and Sell orders
if (buyCondition)
    strategy.entry("Buy", strategy.long)

if (sellCondition)
    strategy.close("Buy")  // Close the long position

if (sellCondition)
    strategy.entry("Sell", strategy.short)

if (buyCondition)
    strategy.close("Sell")  // Close the short position

// Plot Supertrend
plot(supertrend, color=color.blue, title="Supertrend")

// Highlight bars based on trend direction
bgcolor(src > supertrend ? color.new(color.green, 95) : src < supertrend ? color.new(color.red, 95) : na)

// Plot ATR for reference
plot(atr_value, color=color.gray, title="ATR", linewidth=2)

// Plot arrows for buy and sell signals
plotshape(buyCondition, color=color.green, style=shape.triangleup, location=location.belowbar, size=size.small, title="Buy Signal")
plotshape(sellCondition, color=color.red, style=shape.triangledown, location=location.abovebar, size=size.small, title="Sell Signal")