Chiến lược giao dịch định lượng Ichimoku Cloud
Tổng quan
Chiến lược này sử dụng nhiều chỉ số như đường cong, đường K, đường trung bình di chuyển Hull, chỉ số MACD để xây dựng cơ chế ra quyết định dài hoặc dài, để thực hiện giao dịch tự động.
Nguyên tắc chiến lược
Xây dựng tín hiệu giao dịch đa không gian dựa trên đường chuyển đổi và đường chậm trễ trên dải mây Ichimoku. Xác định hướng xu hướng kết hợp với đường trung bình di chuyển của Hull.
Đường chuyển đổi là giá trung bình gần 9 ngày. Đường trì hoãn là giá trung bình gần 26 ngày. Khi đi qua đường trì hoãn trên đường chuyển đổi, hãy làm nhiều hơn. Khi đi qua đường trì hoãn dưới đường chuyển đổi, hãy làm trống.
Hull Moving Average được đánh giá là xu hướng tăng khi đường nhanh đi qua đường chậm; ngược lại, dann được đánh giá là xu hướng giảm.
MACD lấy các chỉ số 12 và 26 để phân tích chênh lệch trung bình di chuyển và đánh giá khoảng trống thông qua trục 0 và đường trung bình.
Đường K trong ngày vượt qua đường trì hoãn như một cơ hội nhập cảnh.
Lợi thế chiến lược
- Một số chỉ số tổng hợp cho thấy xu hướng chính xác.
- Chọn cẩn thận, tránh giao dịch vô nghĩa.
- Có thể kiểm soát rủi ro và ngăn chặn sự cố.
Rủi ro chiến lược
- Thiết lập tham số không đúng có thể dẫn đến quá mạnh vào sân.
- Một sự kết hợp nhiều chỉ số làm tăng sự phức tạp của chiến lược.
- Hành động rút ngắn sẽ không tránh khỏi sự rút lui.
Tối ưu hóa chiến lược
- Điều chỉnh các tham số để phù hợp với nhiều giống và chu kỳ hơn.
- Thêm mô-đun học máy để thực hiện điều chỉnh tham số.
- Tối ưu hóa các chỉ số động lực tham gia và tăng tỷ lệ chiến thắng.
Tóm tắt
Chiến lược này kết hợp nhiều tín hiệu chỉ số như Băng mây Ichimoku để xây dựng một hệ thống quyết định định lượng đầy đủ. Cơ chế dừng lỗ nghiêm ngặt kiểm soát rủi ro giao dịch. Bằng cách điều chỉnh tham số và tối ưu hóa mô hình, có thể thích nghi với nhiều loại giao dịch hơn, có triển vọng ứng dụng rộng rãi.
/*backtest
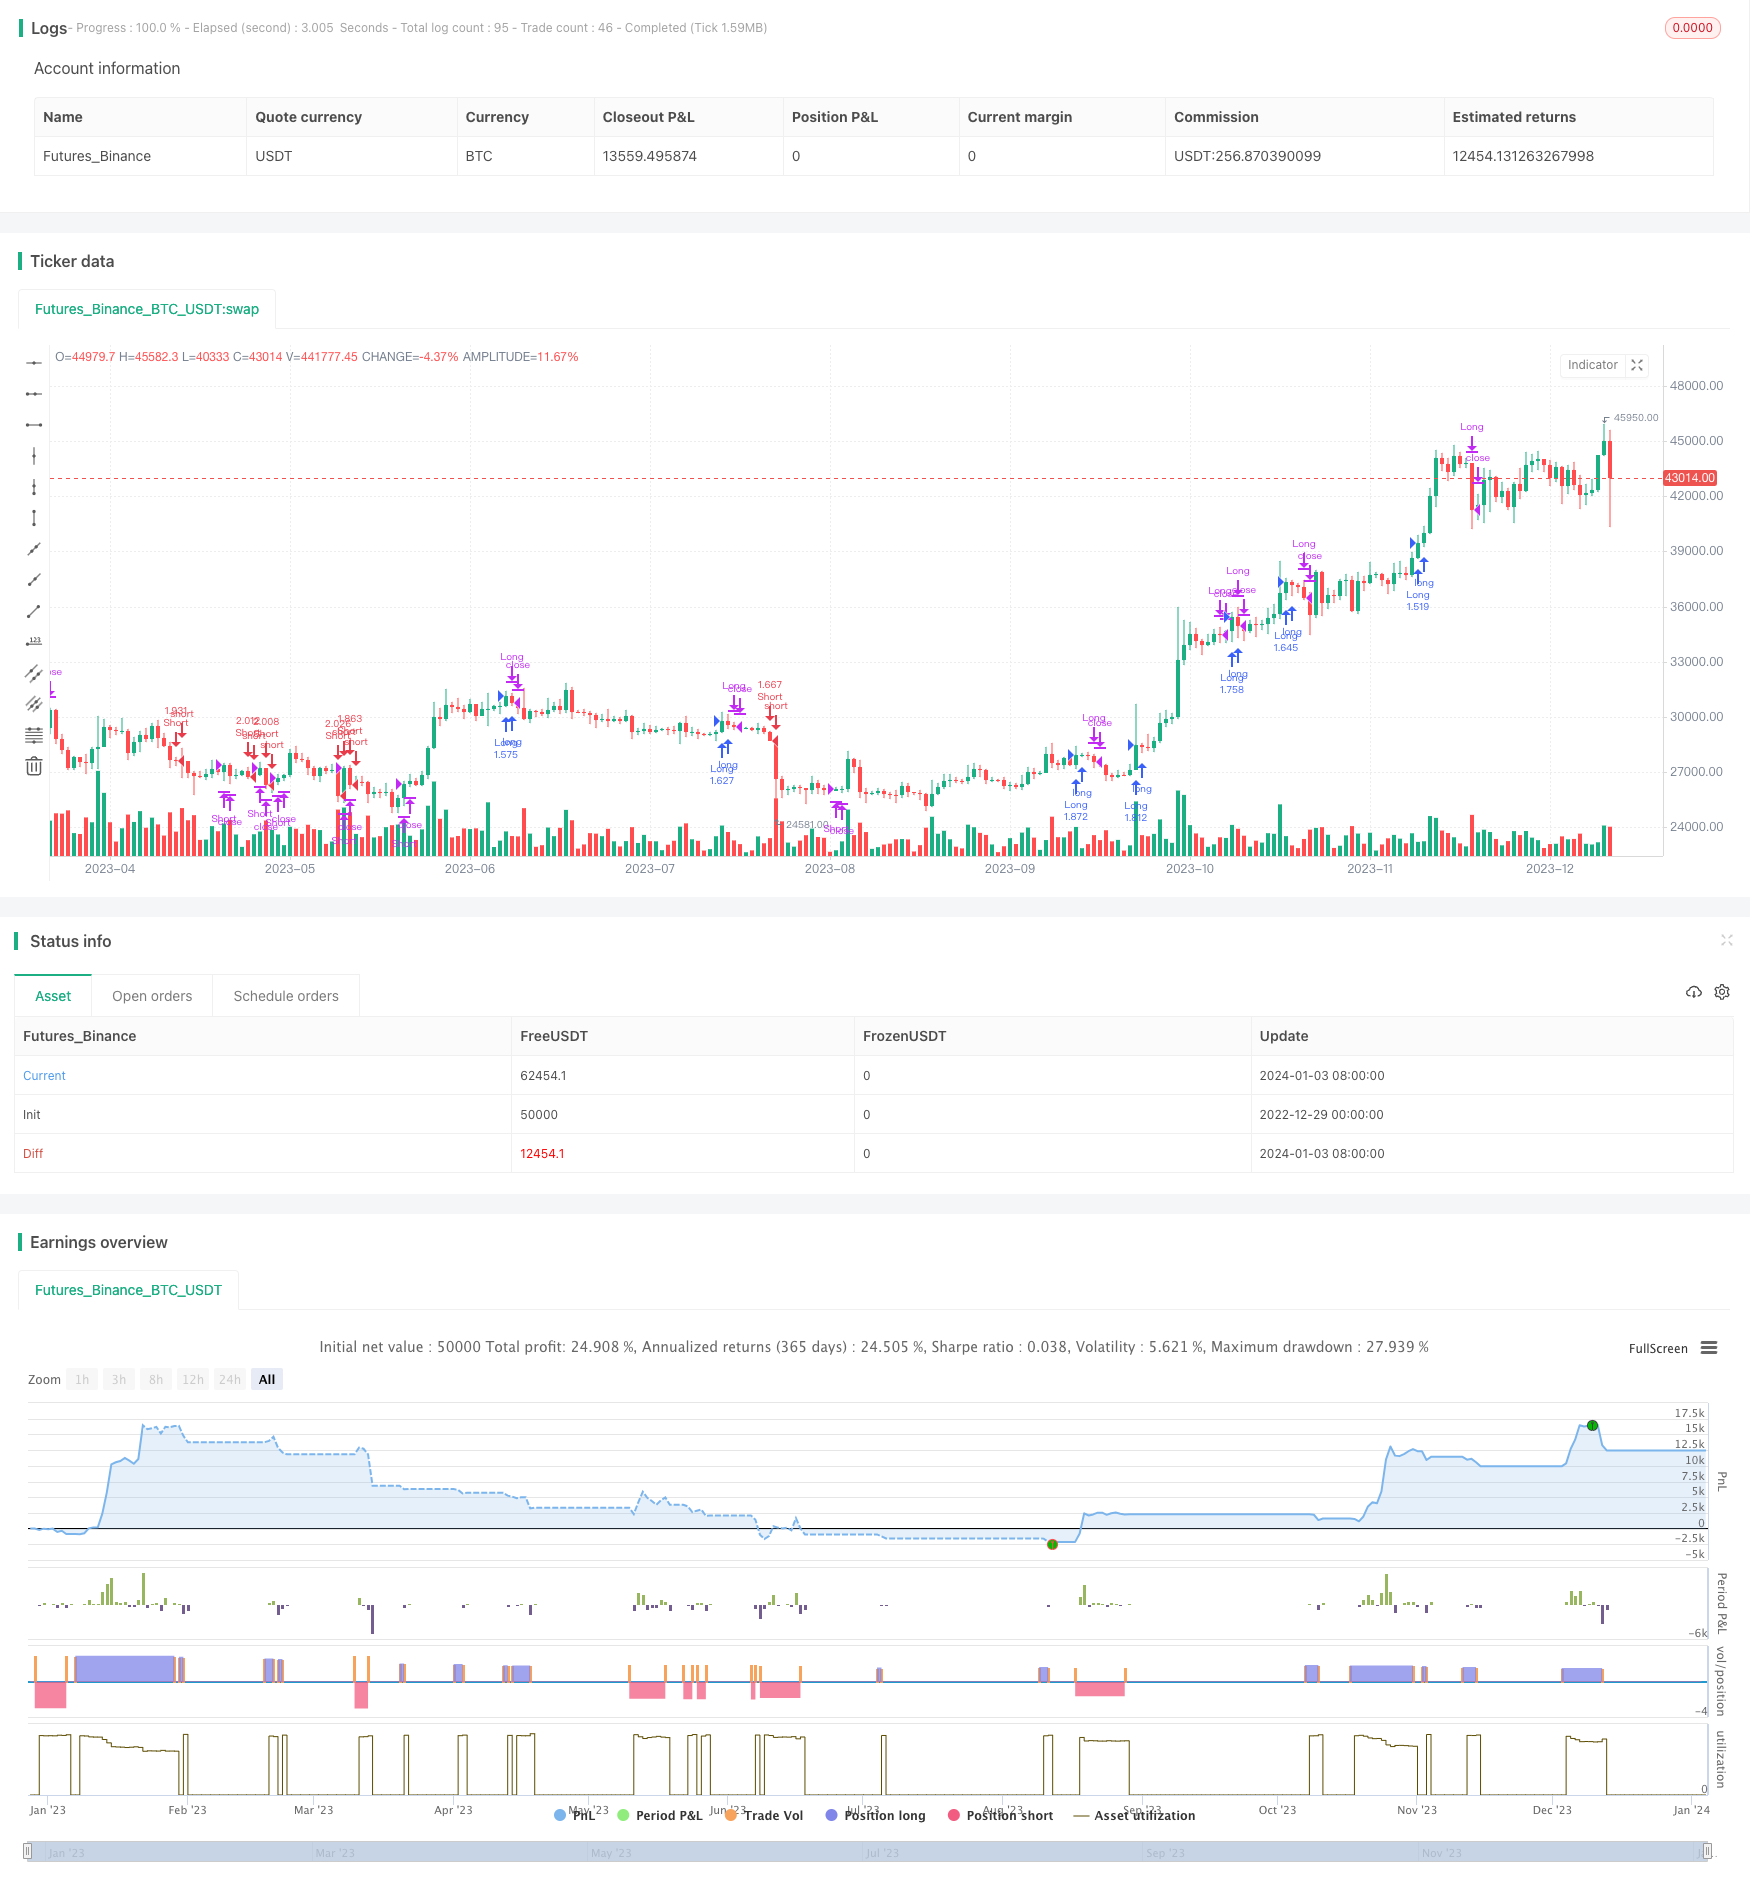
start: 2022-12-29 00:00:00
end: 2024-01-04 00:00:00
period: 1d
basePeriod: 1h
exchanges: [{"eid":"Futures_Binance","currency":"BTC_USDT"}]
*/
//@version=2
// Any timeFrame ok but good on 15 minute & 60 minute , Ichimoku + Daily-Candle_cross(DT) + HULL-MA_cross + MacD combination 420 special blend
strategy("Ichimoku + Daily-Candle_X + HULL-MA_X + MacD", shorttitle="٩(̾●̮̮̃̾•̃̾)۶", overlay=true, default_qty_type=strategy.percent_of_equity, max_bars_back=720, default_qty_value=100, calc_on_order_fills= true, calc_on_every_tick=true, pyramiding=0)
keh=input(title="Double HullMA",defval=14, minval=1)
dt = input(defval=0.0010, title="Decision Threshold (0.001)", type=float, step=0.0001)
SL = input(defval=-500.00, title="Stop Loss in $", type=float, step=1)
TP = input(defval=25000.00, title="Target Point in $", type=float, step=1)
ot=1
n2ma=2*wma(close,round(keh/2))
nma=wma(close,keh)
diff=n2ma-nma
sqn=round(sqrt(keh))
n2ma1=2*wma(close[1],round(keh/2))
nma1=wma(close[1],keh)
diff1=n2ma1-nma1
sqn1=round(sqrt(keh))
n1=wma(diff,sqn)
n2=wma(diff1,sqn)
b=n1>n2?lime:red
c=n1>n2?green:red
d=n1>n2?red:green
confidence=(request.security(syminfo.tickerid, 'D', close)-request.security(syminfo.tickerid, 'D', close[1]))/request.security(syminfo.tickerid, 'D', close[1])
conversionPeriods = input(9, minval=1, title="Conversion Line Periods")
basePeriods = input(26, minval=1, title="Base Line Periods")
laggingSpan2Periods = input(52, minval=1, title="Lagging Span 2 Periods")
displacement = input(26, minval=1, title="Displacement")
donchian(len) => avg(lowest(len), highest(len))
conversionLine = donchian(conversionPeriods)
baseLine = donchian(basePeriods)
leadLine1 = avg(conversionLine, baseLine)
leadLine2 = donchian(laggingSpan2Periods)
LS=close, offset = -displacement
MACD_Length = input(9)
MACD_fastLength = input(12)
MACD_slowLength = input(26)
MACD = ema(close, MACD_fastLength) - ema(close, MACD_slowLength)
aMACD = ema(MACD, MACD_Length)
closelong = n1<n2 and close<n2 and confidence<dt or strategy.openprofit<SL or strategy.openprofit>TP
if (closelong)
strategy.close("Long")
closeshort = n1>n2 and close>n2 and confidence>dt or strategy.openprofit<SL or strategy.openprofit>TP
if (closeshort)
strategy.close("Short")
longCondition = n1>n2 and strategy.opentrades<ot and confidence>dt and close>n2 and leadLine1>leadLine2 and open<LS and MACD>aMACD
if (longCondition)
strategy.entry("Long",strategy.long)
shortCondition = n1<n2 and strategy.opentrades<ot and confidence<dt and close<n2 and leadLine1<leadLine2 and open>LS and MACD<aMACD
if (shortCondition)
strategy.entry("Short",strategy.short)// /L'-,
// ,'-. /MM . . / L '-,
// . _,--dMMMM\ /MMM `.. / '-,
// : _,--, )MMMMMMMMM),. `QMM ,<> /_ '-,'
// ; ___,--. \MM( `-' )M//MM\ ` ,',.; .-'* ; .'
// | \MMMMMM) \MM\ ,dM//MMM/ ___ < ,; `. )`--' /
// | \MM()M MMM)__ /MM(/MP' ___, \ \ ` `. `. /__, ,'
// | MMMM/ MMMMMM( /MMMMP'__, \ | / `. `-,_\ /
// | MM /MMM---' `--'_ \ |-' |/ `./ .\----.___
// | /MM' `--' __,- \"" |-' |_, `.__) . .F. )-.
// | `--' \ \ |-' |_, _,-/ J . . . J-'-. `-.,
// | __ \`. | | | \ / _ |. . . . \ `-. F
// | ___ / \ | `| ' __ \ | /-' F . . . . \ '`
// | \ \ \ / | __ / \ | |,-' __,- J . . . . . \
// | | / |/ __,- \ ) \ / |_,- __,--' |. .__.----,'
// | |/ ___ \ |'. |/ __,--' `.-;;;;;;;;;\
// | ___ \ \ | | ` __,--' /;;;;;;;;;;;;.
// | \ \ |-'\ ' __,--' /;;;;;;;;;;;;;;\
// \ | | / | __,--' `--;;/ \;-'\
// \ | |/ __,--' / / \ \
// \ | __,--' / / \ \
// \|__,--' _,-;M-K, ,;-;\
// <;;;;;;;; '-;;;;
//a1=plot(n1,color=c)
//a2=plot(n2,color=c)
//plot(cross(n1, n2) ? n1 : na, style = circles, color=b, linewidth = 4)
//plot(cross(n1, n2) ? n1 : na, style = line, color=d, linewidth = 4)
//plot(conversionLine, color=#0496ff, title="Conversion Line")
//plot(baseLine, color=#991515, title="Base Line")
//plot(close, offset = -displacement, color=#459915, title="Lagging Span")
//p1=plot (leadLine1, offset = displacement, color=green, title="Lead 1")
//p2=plot (leadLine2, offset = displacement, color=red, title="Lead 2")
//fill(p1, p2, color = leadLine1 > leadLine2 ? green : red)
// remove the "//" from before the plot script if want to see the indicators on chart