Chiến lược giao dịch Ethereum dựa trên siêu xu hướng

Tổng quan
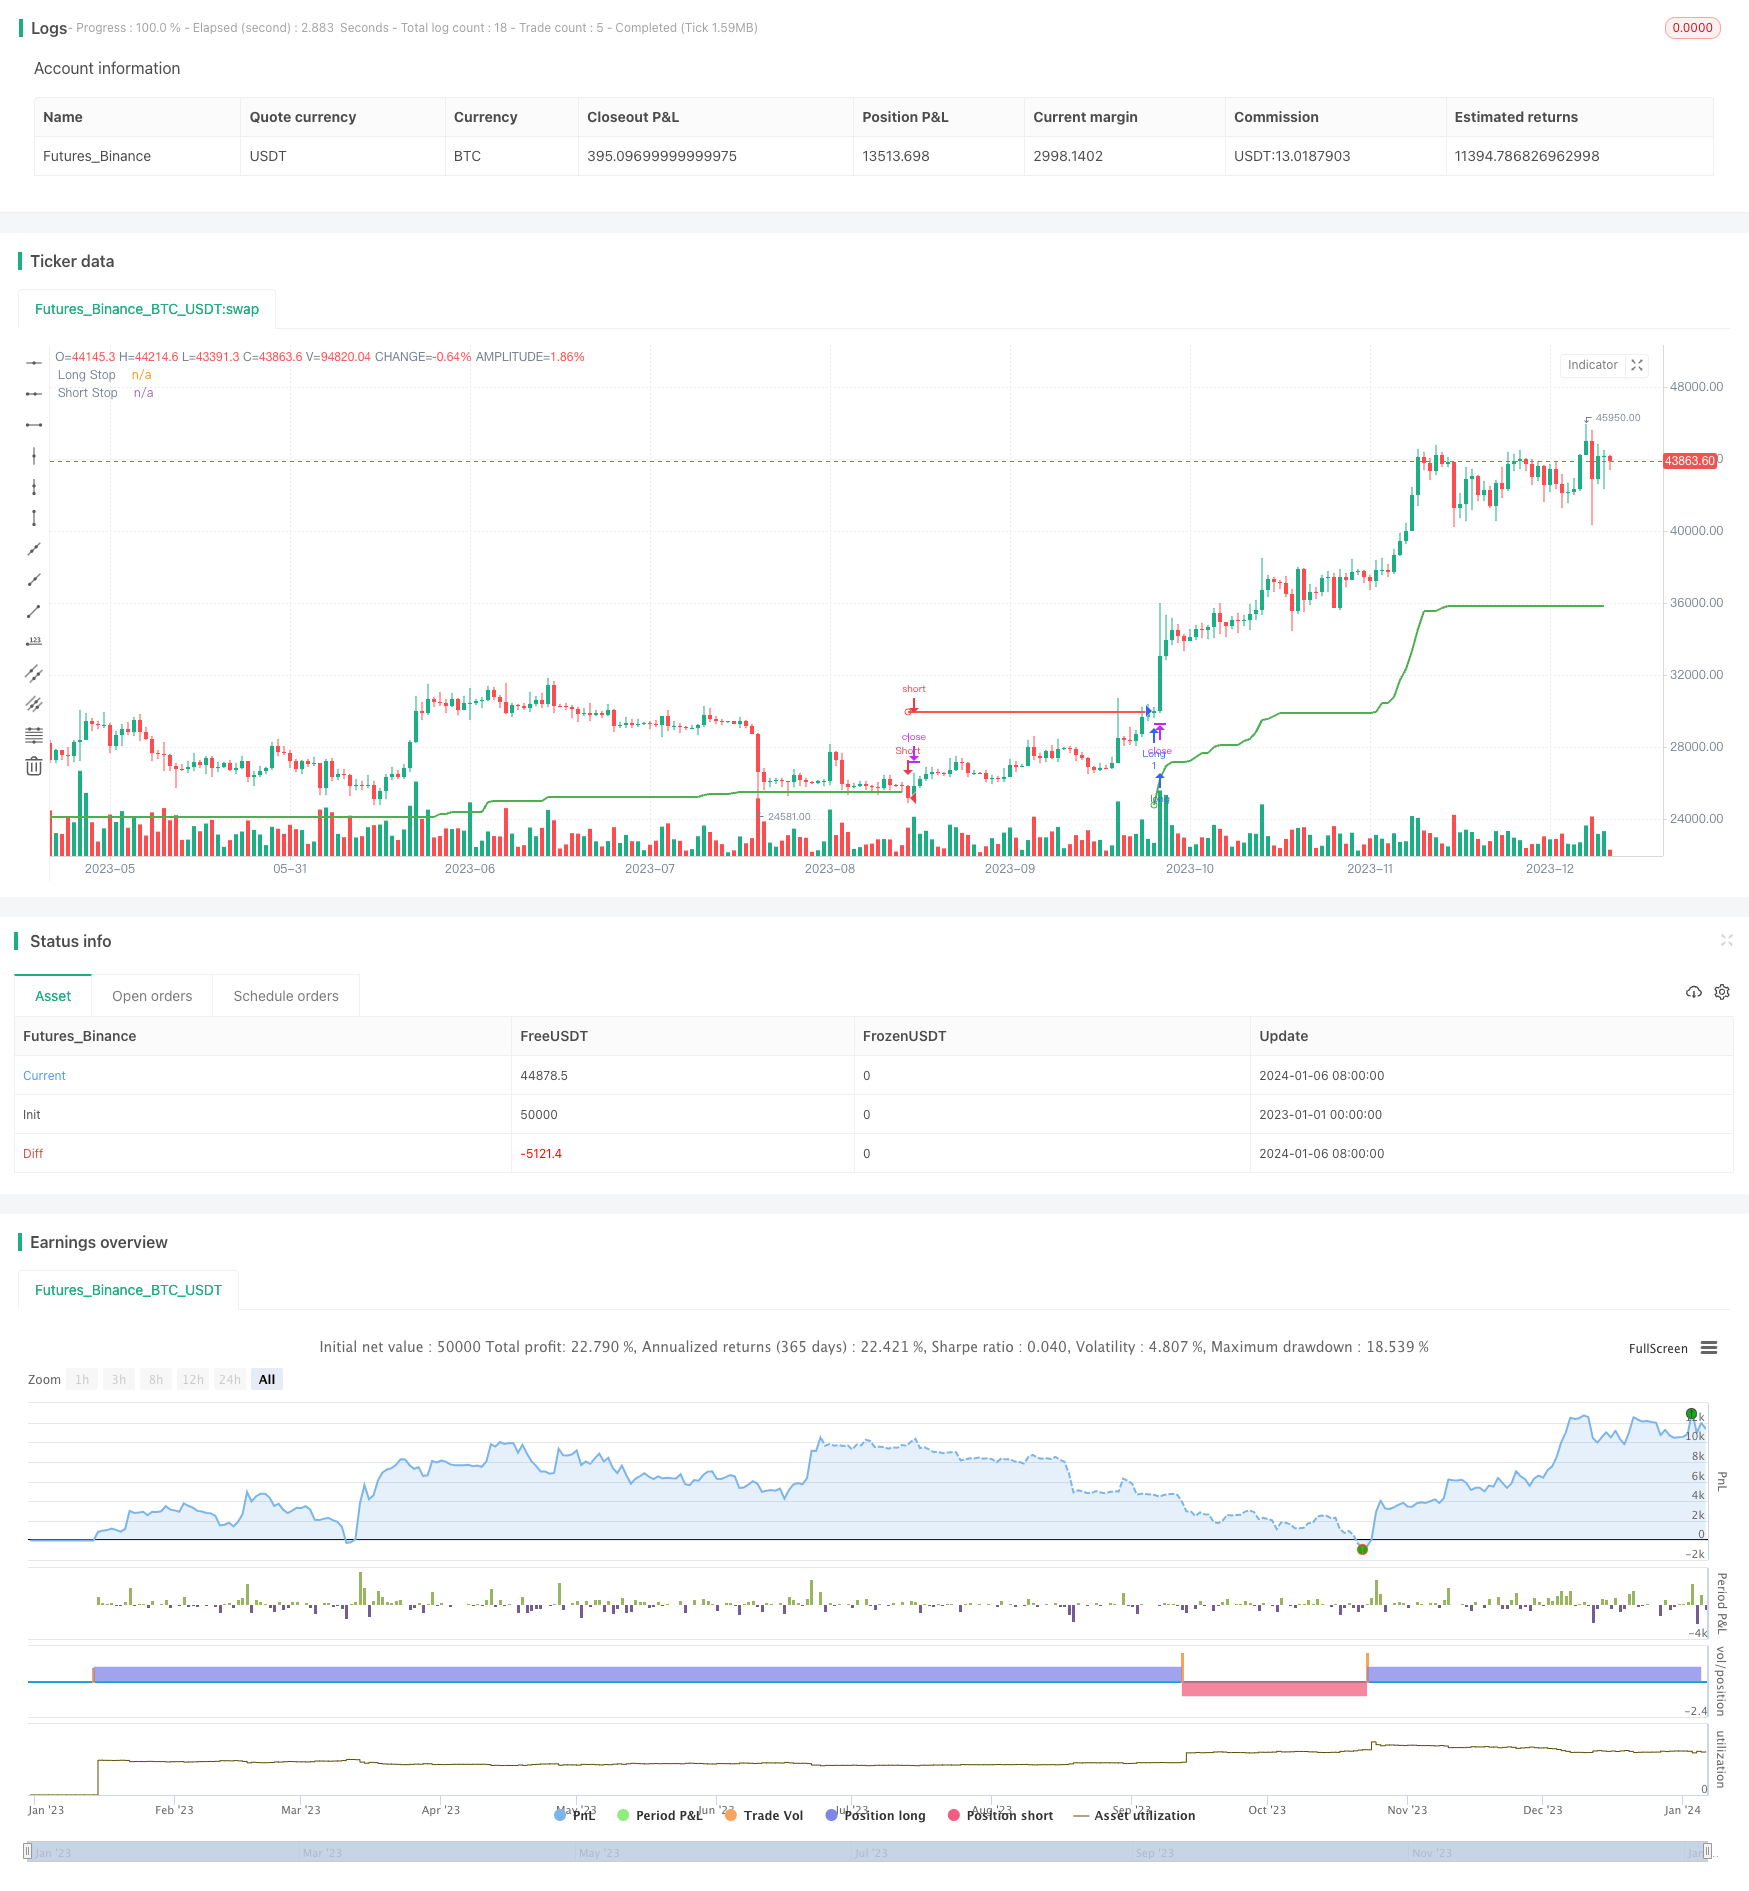
Chiến lược này dựa trên chỉ số siêu xu hướng, kết hợp với ATR để thiết lập một đường dừng lỗ động để kiếm lợi nhuận trong xu hướng mạnh mẽ của Ethereum. Nó có thể hoạt động trên cặp giao dịch ETH/USD trên sàn giao dịch Coinbase.
Nguyên tắc chiến lược
Chiến lược này sử dụng một chỉ số theo dõi xu hướng cổ điển và chỉ số siêu xu hướng để đánh giá xu hướng. Chỉ số siêu xu hướng bao gồm hai đường cong, tương ứng là:
- Dòng dừng lỗ xu hướng tăng, giữ nhiều đơn trong thời gian tăng;
- Đường dừng lỗ xu hướng giảm, giữ vé trong xu hướng giảm.
Khi giá chuyển từ xu hướng tăng sang xu hướng giảm, hãy thực hiện vị trí mở đầu; khi giá chuyển từ xu hướng giảm sang xu hướng tăng, hãy thực hiện vị trí mở đầu.
Ngoài ra, các chiến lược cũng sử dụng chỉ số ATR để điều chỉnh động vị trí của đường dừng. Cụ thể, vị trí của đường dừng tăng là giá cao nhất và giá thấp nhất trung bình trừ ATR nhân một hệ số; vị trí của đường dừng giảm là giá cao nhất và giá thấp nhất trung bình cộng với ATR nhân một hệ số.
Sau khi vào tín hiệu phát ra, nếu giá quay trở lại đường dừng lỗ, hãy dừng lỗ.
Lợi thế chiến lược
Đây là một chiến lược theo dõi xu hướng lâu đời hơn, có những lợi thế như sau:
- Sử dụng chỉ số siêu xu hướng để xác định xu hướng, có độ tin cậy cao hơn;
- Ứng dụng ATR tự điều chỉnh đường dừng để kiểm soát rủi ro hiệu quả;
- Lập luận của chiến lược đơn giản và rõ ràng, dễ hiểu và dễ sửa đổi;
- Có thể kiếm được lợi nhuận trong thị trường tiền kỹ thuật số có biến động cao.
Rủi ro chiến lược
Chiến lược này cũng có một số rủi ro:
- Các chỉ số siêu xu hướng có khả năng đánh giá sai và có thể gây ra tổn thất không cần thiết;
- ATR Stop có thể quá quyết liệt và bị giá đảo ngược;
- Thị trường tiền kỹ thuật số có nhiều biến động, có nhiều khả năng phá vỡ lệnh dừng.
- Các sàn giao dịch có phí giao dịch cao sẽ ảnh hưởng đến lợi nhuận cuối cùng.
Để giảm rủi ro trên, có thể điều chỉnh ATR thích hợp, hoặc kết hợp với các chỉ số khác để lọc tín hiệu giao dịch. Các vị trí dừng lỗ cũng có thể được xem xét để có một số bảo hiểm.
Hướng tối ưu hóa chiến lược
Chiến lược này có thể được tối ưu hóa hơn nữa:
- Có thể giới thiệu thêm các bộ chỉ số để tăng độ chính xác của tín hiệu;
- Các giá trị tối ưu cho hệ số ATR và tham số chiều dài;
- Bạn có thể thiết lập tỷ lệ dừng rủi ro để động điều chỉnh quy mô vị trí;
- Có thể thử nghiệm hiệu quả của chiến lược trên nhiều cặp giao dịch tiền kỹ thuật số khác nhau.
Tóm tắt
Chiến lược này nói chung là một chiến lược theo dõi xu hướng đã được chứng minh và đáng tin cậy. Nó sử dụng chỉ số siêu xu hướng để xác định xu hướng và sử dụng ATR để điều chỉnh vị trí dừng lỗ để kiểm soát rủi ro và lợi nhuận. Chiến lược này phù hợp với giao dịch tiền kỹ thuật số có biến động cao và có hiệu quả tốt hơn đối với các loại tiền tệ chính như Ethereum. Bằng cách tối ưu hóa hơn nữa, chiến lược có thể được áp dụng trên thị trường rộng lớn hơn để có được lợi nhuận vượt trội ổn định hơn.
/*backtest
start: 2023-01-01 00:00:00
end: 2024-01-07 00:00:00
period: 1d
basePeriod: 1h
exchanges: [{"eid":"Futures_Binance","currency":"BTC_USDT"}]
*/

//@version=4
strategy("SuperTrend Strategy",
     overlay=true,
     initial_capital=2e3,
     process_orders_on_close=true,
     commission_type=strategy.commission.percent,
     commission_value=0.1
     )

length = input(title="ATR Period", type=input.integer, defval=21)
mult = input(title="ATR Multiplier", type=input.float, step=.25, defval=6.2)
wicks = input(title="Take Wicks into Account ?", type=input.bool, defval=false)

useDate = input(title="Start from Specific Date ?", defval=false)
yearStart = input(title="Start Year", defval=2019)
monthStart = input(title="Start Month", minval=1, maxval=12, defval=1)
dayStart = input(title="Start Day", minval=1, maxval=31, defval=1)

startTime = timestamp(yearStart, monthStart, dayStart, 0, 0)
startFrom = useDate ? time(timeframe.period) >= startTime : true

atr = mult * ta.atr(length)

longStop = hl2 - atr
longStopPrev = nz(longStop[1], longStop)
longStop := (wicks ? low[1] : close[1]) > longStopPrev ? math.max(longStop, longStopPrev) : longStop

shortStop = hl2 + atr
shortStopPrev = nz(shortStop[1], shortStop)
shortStop := (wicks ? high[1] : close[1]) < shortStopPrev ? math.min(shortStop, shortStopPrev) : shortStop

dir = 1
dir := nz(dir[1], dir)
dir := dir == -1 and (wicks ? high : close) > shortStopPrev ? 1 : dir == 1 and (wicks ? low : close) < longStopPrev ? -1 : dir

longColor = color.green
shortColor = color.red

plot(dir == 1 ? longStop : na, title="Long Stop", style=plot.style_linebr, linewidth=2, color=longColor)
plotshape(dir == 1 and dir[1] == -1 ? longStop : na, title="Long Start", location=location.absolute, style=shape.circle, size=size.tiny, color=longColor, transp=0)

plot(dir == 1 ? na : shortStop, title="Short Stop", style=plot.style_linebr, linewidth=2, color=shortColor)
plotshape(dir == -1 and dir[1] == 1 ? shortStop : na, title="Short Start", location=location.absolute, style=shape.circle, size=size.tiny, color=shortColor, transp=0)

longCondition = dir[1] == -1 and dir == 1
if longCondition and startFrom
    strategy.entry("Long", strategy.long, stop=longStop)
else
    strategy.cancel("Long")

shortCondition = dir[1] == 1 and dir == -1
if shortCondition and startFrom
    strategy.entry("Short", strategy.short, stop=shortStop)
else
    strategy.cancel("Short")