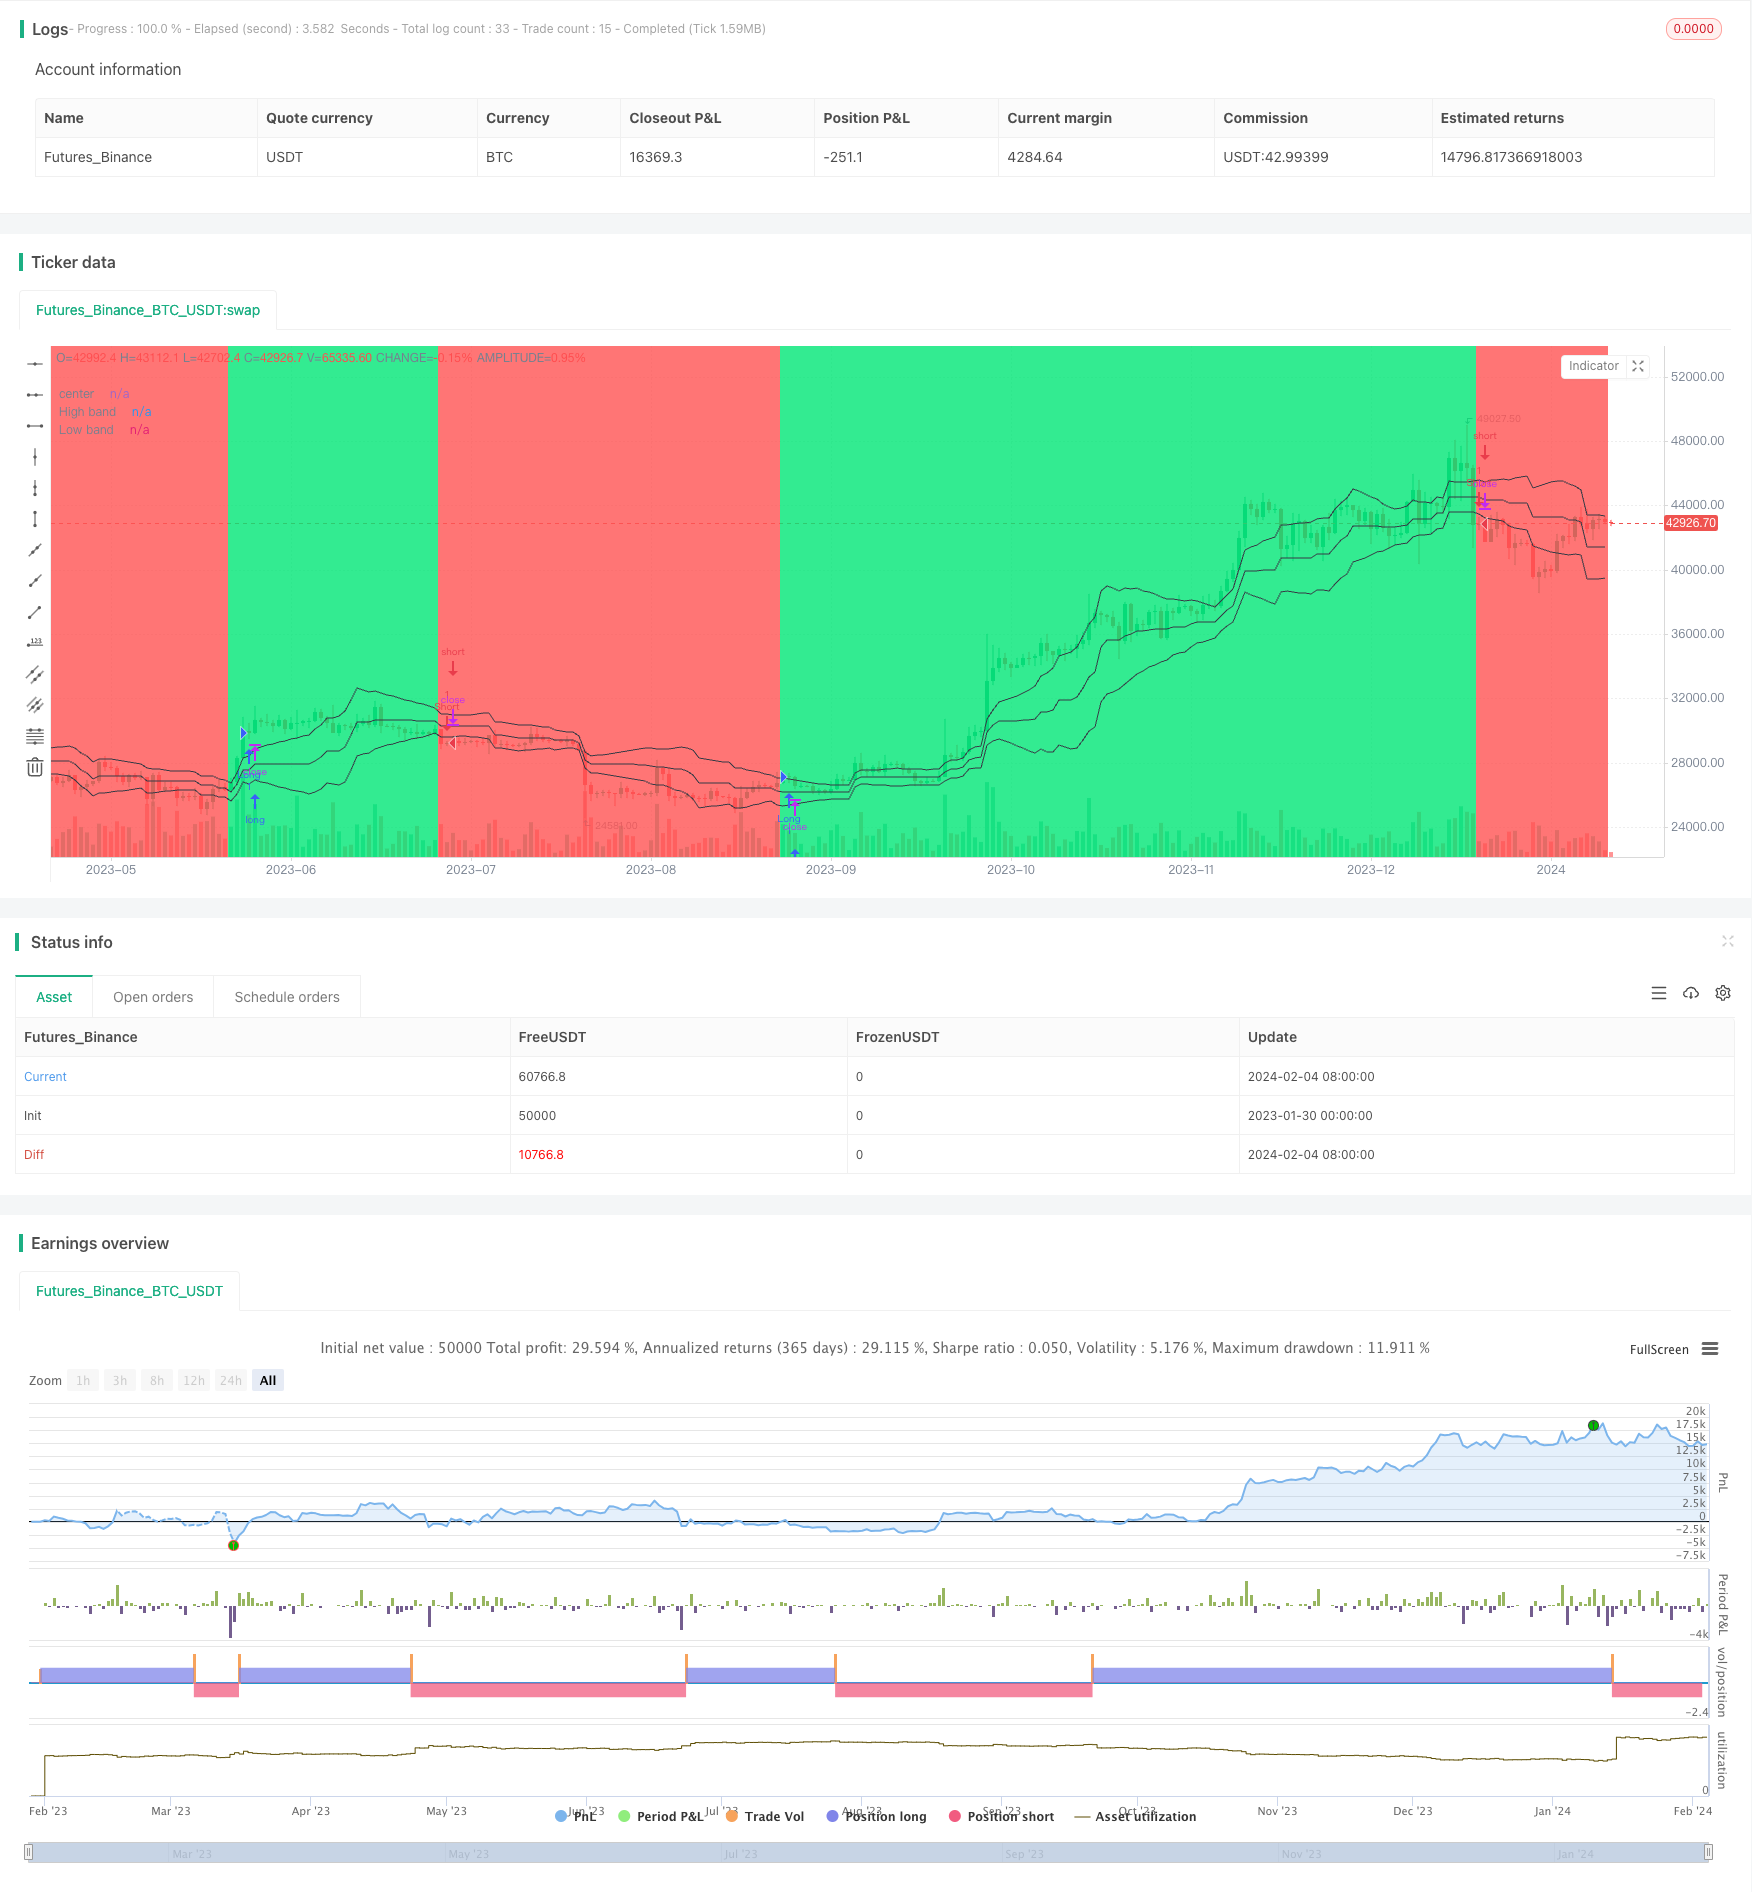
Đường dây giá và xu hướng dựa trên trung bình động theo chiến lược
Tác giả:ChaoZhang, Ngày: 2024-02-06 09:46:23Tags:

Tổng quan
Chiến lược này xác định và theo dõi xu hướng bằng cách xây dựng một kênh giá để tính lệch giá từ đường giữa và sử dụng đường trung bình động để lọc tín hiệu.
Chiến lược logic
- Xây dựng kênh giá
- Tính toán mức cao nhất và thấp nhất trong các khoảng thời gian len gần đây
- Đường giữa là trung bình của cao nhất cao nhất và thấp nhất thấp
- Khoảng cách là độ lệch tuyệt đối của giá từ đường trung bình
- Khoảng cách trơn tru để có được dải trên và dưới
- Xác định hướng xu hướng
- Khi giá dưới dải dưới, xác định như xu hướng giảm
- Khi giá trên dải trên, xác định như xu hướng tăng
- Tạo tín hiệu giao dịch
- Trong xu hướng tăng, dài khi giá thấp hơn mở hoặc phá vỡ dưới dải trên
- Trong xu hướng giảm, bán khi giá trên mức mở hoặc phá vỡ trên dải dưới
Phân tích lợi thế
- Nhận thấy xu hướng trung và dài hạn
- Kết hợp với tín hiệu đột phá để tránh giao dịch không hiệu quả trên các thị trường giới hạn phạm vi
- Các thông số tùy chỉnh phù hợp với các sản phẩm khác nhau
Phân tích rủi ro
- Có thể mất mát nhỏ hơn trong xu hướng dao động
- Cài đặt tham số không phù hợp có thể bỏ lỡ sự đảo ngược xu hướng
- Theo dõi tần suất giao dịch để ngăn chặn giao dịch quá mức
Hướng dẫn tối ưu hóa
- Thêm các chỉ số khác vào các tín hiệu lọc
- Điều chỉnh động các thông số kênh giá
- Bao gồm dừng lỗ để tối ưu hóa quản lý rủi ro
Kết luận
Chiến lược này nói chung khá mạnh mẽ trong việc theo dõi các xu hướng trung hạn đến dài hạn một cách hiệu quả trong khi tạo ra các tín hiệu giao dịch thông qua các sự đột phá xu hướng.
/*backtest
start: 2023-01-30 00:00:00
end: 2024-02-05 00:00:00
period: 1d
basePeriod: 1h
exchanges: [{"eid":"Futures_Binance","currency":"BTC_USDT"}]
*/


//@version=2
strategy("Noro's Bands Strategy v1.1", shorttitle = "NoroBands str 1.1", overlay=true)

//Settings
needlong = input(true, defval = true, title = "Long")
needshort = input(true, defval = true, title = "Short")
len = input(20, defval = 20, minval = 2, maxval = 200, title = "Period")
color = input(true, "Color")
needbb = input(true, defval = false, title = "Show Bands")
needbg = input(true, defval = false, title = "Show Background")
src = close

//PriceChannel 1
lasthigh = highest(src, len)
lastlow = lowest(src, len)
center = (lasthigh + lastlow) / 2

//dist
dist = abs(src - center)
distsma = sma(dist, len)
hd = center + distsma
ld = center - distsma

//Trend
trend = close < ld and high < hd ? -1 : close > hd and low > ld ? 1 : trend[1]

//Lines
colo = needbb == false ? na : black
plot(hd, color = colo, linewidth = 1, transp = 0, title = "High band")
plot(center, color = colo, linewidth = 1, transp = 0, title = "center")
plot(ld, color = colo, linewidth = 1, transp = 0, title = "Low band")

//Background
col = needbg == false ? na : trend == 1 ? lime : red
bgcolor(col, transp = 90)

//Signals
up = trend == 1 and ((close < open or color == false) or close < hd) ? 1 : 0
dn = trend == -1 and ((close > open or color == false) or close > ld) ? 1 : 0

longCondition = up == 1
if (longCondition)
    strategy.entry("Long", strategy.long, needlong == false ? 0 : na)

shortCondition = dn == 1
if (shortCondition)
    strategy.entry("Short", strategy.short, needshort == false ? 0 : na)
Thêm nữa
- Chiến lược giao dịch đường xu hướng độ dốc động
- Chiến lược giao dịch chỉ số RSI nâng cao
- Chỉ số RSI Cross Cycle Profit and Stop Loss Strategy
- Chiến lược theo dõi xu hướng dựa trên đường chéo trung bình động
- RSI và Bollinger Bands Fusion Trading Strategy cho LTC
- Chiến lược chéo trung bình động cơ tối ưu
- Chiến lược SMA-ATR Dynamic Trailing Stop
- Chiến lược theo dõi đảo ngược
- Chiến lược trọng tài đảo ngược kép
- Kama và xu hướng dựa trên trung bình động theo chiến lược
- Chiến lược Trung bình vị trí động RSI
- Bollinger Bands và chiến lược kết hợp RSI
- Chiến lược giao dịch trung bình di chuyển tăng gấp đôi động
- Chiến lược giao dịch chỉ số động lực đảo ngược kép
- Chiến lược Bottom Hunter
- Chiến lược Bollinger Band với lựa chọn phạm vi ngày
- Định hướng sau chiến lược dừng lỗ dựa trên chỉ số báo động xu hướng
- Chiến lược Bressert Stochastic Smoothed hai lần
- Xu hướng chéo giữa trung bình động và trung bình ngẫu nhiên theo chiến lược định lượng
- Chiến lược phá vỡ kênh trung bình chuyển động 5 ngày kết hợp với khái niệm dặm