Chiến lược hội tụ giới hạn trong ngày theo tỷ lệ MACD và R:R
MACD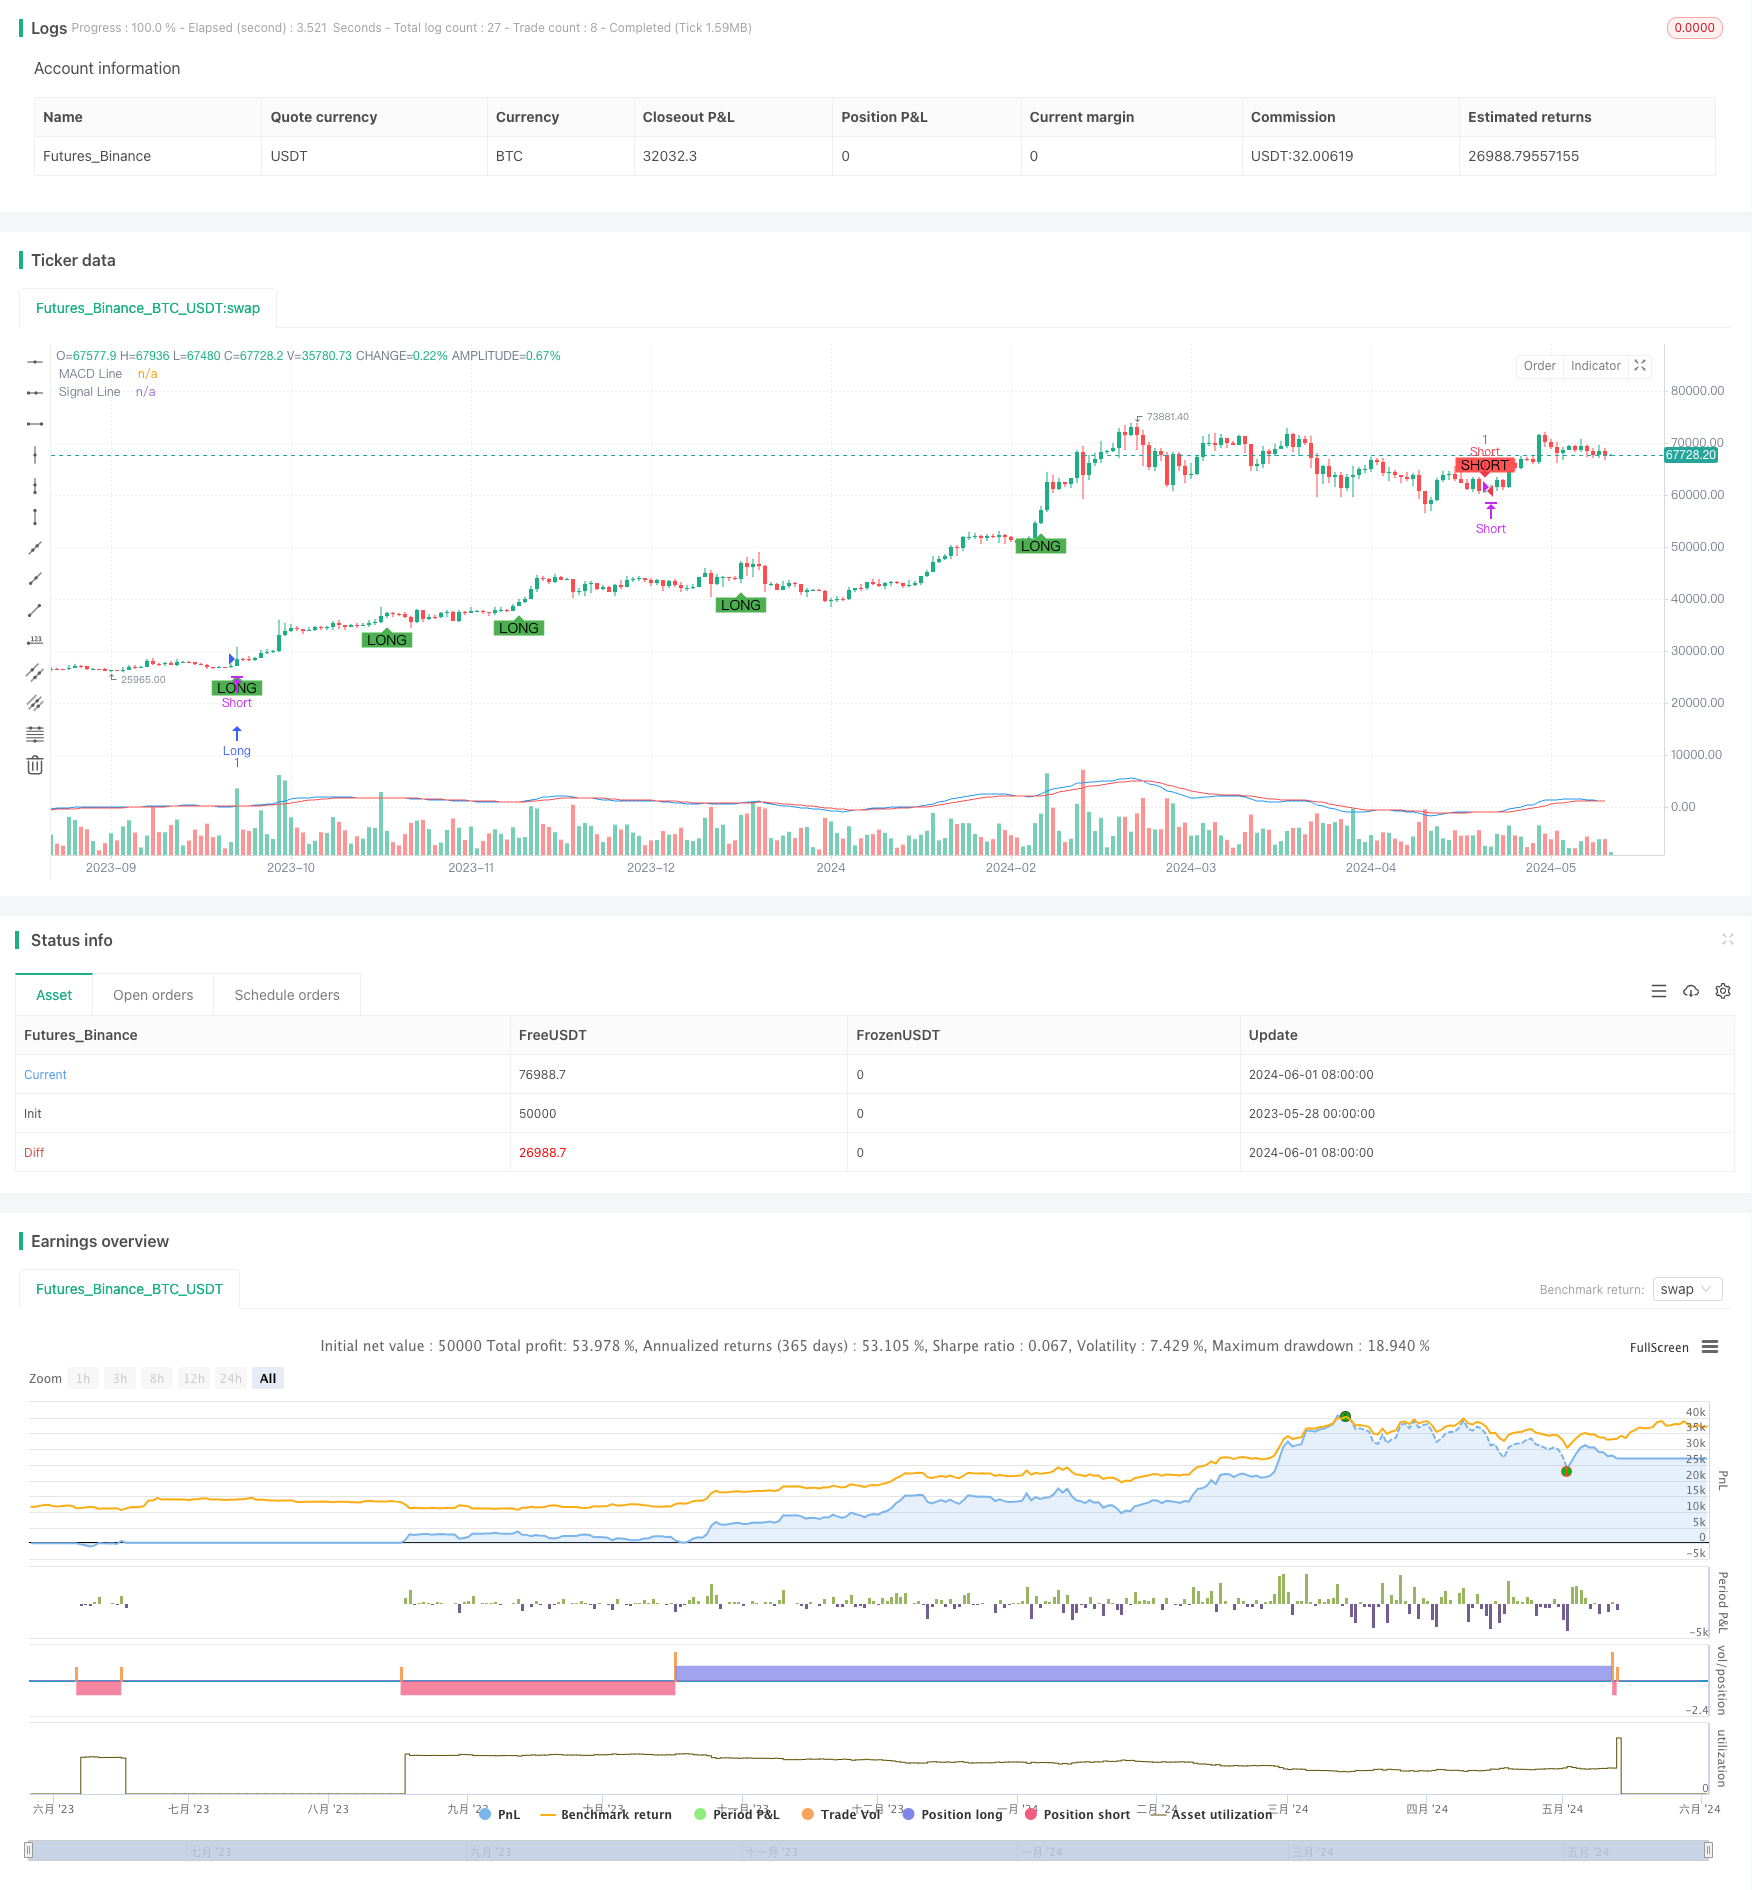
Tổng quan
Chiến lược này đánh giá tín hiệu giao dịch dựa trên sự kết hợp và phân tán của chỉ số MACD. Khi đường MACD và đường tín hiệu giao nhau, và giá trị của đường MACD lớn hơn 1,5 hoặc nhỏ hơn -1,5 thì các tín hiệu mua và bán được tạo ra. Đồng thời, chiến lược đặt điểm dừng lỗ cố định và giới thiệu khái niệm về tỷ lệ lợi nhuận rủi ro (R: R). Ngoài ra, chiến lược này cũng sử dụng giới hạn lỗ tối đa và lợi nhuận tối đa trong ngày và các biện pháp dừng chân di động nghiêm ngặt hơn để kiểm soát rủi ro tốt hơn.
Nguyên tắc chiến lược
- Tính toán đường MACD và đường tín hiệu của MACD.
- Xác định sự giao nhau của đường MACD và đường tín hiệu, đồng thời xem xét liệu giá trị của đường MACD có vượt quá một ngưỡng nhất định không ((1,5 và -1,5)).
- Khi có nhiều tín hiệu, hãy mở nhiều vị trí, đặt giá dừng là giá cao nhất hiện tại + 600 đơn vị biến động nhỏ nhất, giá dừng là giá thấp nhất hiện tại - 100 đơn vị biến động nhỏ nhất.
- Khi có tín hiệu giảm giá, hãy mở lệnh giảm giá, đặt giá dừng là giá tối thiểu hiện tại - 600 đơn vị biến động tối thiểu, giá dừng là giá tối đa hiện tại + 100 đơn vị biến động tối thiểu.
- Lập ra logic dừng chân di chuyển, khi giá tăng ((trong nhiều đầu) hoặc giảm ((trong khoảng trống) so với giá mở cửa hơn 300 đơn vị biến động nhỏ nhất, giá dừng sẽ được di chuyển sang giá mở cửa + ((trong nhiều đầu) hoặc giá mở cửa - ((trong nhiều đầu) hoặc giá mở cửa - (trong khoảng trống)
- Thiết lập giới hạn lỗ tối đa và lợi nhuận tối đa trong ngày, thanh toán tất cả các vị trí khi lỗ đạt 600 đơn vị biến động tối thiểu hoặc lợi nhuận đạt 1800 đơn vị biến động tối thiểu trong ngày.
Phân tích lợi thế
- Kết hợp chỉ số MACD với điều kiện giá giảm, có hiệu quả lọc một số tín hiệu tiếng ồn.
- Tỷ lệ lợi nhuận rủi ro cố định ((R: R), lợi nhuận rủi ro trên mỗi giao dịch có thể kiểm soát được.
- Logic Stop Loss di động có thể bảo vệ lợi nhuận sau khi xu hướng hình thành và giảm sự rút lui.
- Giới hạn lỗ tối đa trong ngày và lợi nhuận sẽ giúp kiểm soát lỗ hổng rủi ro trong ngày và tránh thua lỗ quá mức hoặc rút lui sau khi kiếm được lợi nhuận.
Phân tích rủi ro
- Chỉ số MACD có sự chậm trễ, có thể có tín hiệu chậm hoặc tín hiệu sai.
- Các điểm dừng cố định có thể không thích ứng với các điều kiện thị trường khác nhau và có thể thường xuyên kích hoạt dừng trong tình huống biến động.
- Logic dừng di động có thể không dừng lại kịp thời khi xu hướng đảo ngược, dẫn đến lợi nhuận quay trở lại.
- Giới hạn lỗ tối đa trong ngày và lợi nhuận có thể dẫn đến việc chiến lược này tháo lỗ quá sớm và bỏ lỡ lợi nhuận tiềm năng khi xu hướng thị trường trong một ngày được xác định rõ ràng.
Hướng tối ưu hóa
- Xem xét sử dụng các chỉ số MACD của nhiều khung thời gian để xác nhận tín hiệu và cải thiện độ chính xác tín hiệu.
- Điều chỉnh điểm dừng lỗ theo biến động của thị trường để phù hợp với các tình huống thị trường khác nhau.
- Tối ưu hóa logic dừng di động, chẳng hạn như thiết lập khoảng cách dừng di động theo chỉ số ATR, để thích ứng tốt hơn với biến động giá.
- Tối đa lỗ hổng và lợi nhuận trong ngày được tối ưu hóa thông số, tìm ra các giới hạn phù hợp, và cố gắng nắm bắt xu hướng trong khi kiểm soát rủi ro.
Tóm tắt
Chiến lược này đánh giá tín hiệu giao dịch thông qua sự kết hợp và phân tán của chỉ số MACD, đồng thời giới thiệu các biện pháp kiểm soát rủi ro như tỷ lệ lợi nhuận rủi ro, dừng chân di động và giới hạn trong ngày. Mặc dù chiến lược này có thể nắm bắt được xu hướng và kiểm soát rủi ro, nhưng vẫn có một số không gian để tối ưu hóa và cải thiện.
/*backtest
start: 2023-05-28 00:00:00
end: 2024-06-02 00:00:00
period: 1d
basePeriod: 1h
exchanges: [{"eid":"Futures_Binance","currency":"BTC_USDT"}]
*/

// This Pine Script™ code is subject to the terms of the Mozilla Public License 2.0 at https://mozilla.org/MPL/2.0/
// © DD173838

//@version=5
strategy("MACD Convergence Strategy with R:R, Daily Limits, and Tighter Stop Loss", overlay=true, default_qty_type=strategy.fixed, default_qty_value=1)

// MACD settings
fastLength = input.int(12, title="Fast Length", minval=1)
slowLength = input.int(26, title="Slow Length", minval=1)
signalSmoothing = input.int(9, title="Signal Smoothing", minval=1)
source = input(close, title="Source")

// Calculate MACD
[macdLine, signalLine, _] = ta.macd(source, fastLength, slowLength, signalSmoothing)

// Plot MACD and signal line
plot(macdLine, title="MACD Line", color=color.blue)
plot(signalLine, title="Signal Line", color=color.red)

// Define convergence conditions
macdConvergenceUp = ta.crossover(macdLine, signalLine) and macdLine > 1.5
macdConvergenceDown = ta.crossunder(macdLine, signalLine) and macdLine < -1.5

// Define take profit and stop loss


takeProfit = 600
stopLoss = 100

// Plot buy and sell signals on the chart
plotshape(series=macdConvergenceDown, title="Short Signal", location=location.abovebar, color=color.red, style=shape.labeldown, text="SHORT")
plotshape(series=macdConvergenceUp, title="Long Signal", location=location.belowbar, color=color.green, style=shape.labelup, text="LONG")

// Execute short and long orders with defined take profit and stop loss
if (macdConvergenceDown)
    strategy.entry("Short", strategy.short, qty=1, stop=high + (stopLoss / syminfo.mintick), limit=low - (takeProfit / syminfo.mintick))

if (macdConvergenceUp)
    strategy.entry("Long", strategy.long, qty=1, stop=low - (stopLoss / syminfo.mintick), limit=high + (takeProfit / syminfo.mintick))

// Trailing stop logic
var float entryPrice = na
var float trailingStopPrice = na

if (strategy.position_size != 0)
    entryPrice := strategy.opentrades.entry_price(0)

if (strategy.position_size > 0)  // For long positions
    if (close - entryPrice > 300)
        trailingStopPrice := entryPrice + (close - entryPrice - 300)

if (strategy.position_size < 0)  // For short positions
    if (entryPrice - close > 300)
        trailingStopPrice := entryPrice - (entryPrice - close - 300)

if (strategy.position_size > 0 and not na(trailingStopPrice) and close < trailingStopPrice)
    strategy.close("Long", comment="Trailing Stop")

if (strategy.position_size < 0 and not na(trailingStopPrice) and close > trailingStopPrice)
    strategy.close("Short", comment="Trailing Stop")

// Daily drawdown and profit limits
var float startOfDayEquity = na
if (na(startOfDayEquity) or ta.change(time('D')) != 0)
    startOfDayEquity := strategy.equity

maxDailyLoss = 600
maxDailyProfit = 1800
currentDailyPL = strategy.equity - startOfDayEquity

if (currentDailyPL <= -maxDailyLoss)
    strategy.close_all(comment="Max Daily Loss Reached")

if (currentDailyPL >= maxDailyProfit)
    strategy.close_all(comment="Max Daily Profit Reached")