概述
本策略的核心思想是同时利用相对强弱指数(RSI)和不同时间周期的移动平均线来识别趋势反转点,以捕捉中长线趋势的同时进行短线交易。该策略综合多种交易信号,旨在提高交易成功率。
策略原理
- 计算RSI指标,以及快线EMA和慢线WMA移动平均线。
- 当RSI指标线突破WMA移动平均线时,产生买入/卖出信号。
- 当EMA快线突破WMA慢线时,产生买入/卖出信号。
- 当RSI和EMA同时突破WMA时,产生强烈的买入/卖出信号。
- 同时,当价格突破辅助的移动平均线时,可以增强主信号。
- 设置止损、止盈条件。
该策略综合了多种技术指标的突破信号,不同参数设置的移动平均线来识别不同周期的趋势,从而提高策略的可靠性。RSI指标判断超买超卖状态,EMA快线判断短期趋势,WMA慢线判断中期趋势,价格与辅助平均线的突破验证趋势。多种信号的综合提升了策略效果。
优势分析
- 利用RSI指标的反转特征,可以在超买超卖区抓取反转机会。
- 辅助移动平均线作为趋势过滤器,避免假突破。
- 多时间周期结合,既可跟踪长线趋势,也可捕捉短线机会。
- 综合多种指标信号,可提高交易成功率。
- 设置止损止盈策略,可以主动控制风险。
风险分析
- RSI指标容易产生假信号,需要辅助移动平均线过滤。
- 大周期趋势下的反弹可能会触发反向交易信号,需要谨慎对待。
- 需优化参数设置,如RSI周期长度、移动平均线周期等。
- 停损点设置需要谨慎,避免被套。
风险可以通过参数优化、严格的止损策略、以及考虑大周期趋势等方法减轻。
优化方向
- 优化RSI参数,找到最佳周期长度。
- 测试不同类型的移动平均线组合。
- 加入波动率指标如ATR,动态调整止损止盈位。
- 增加交易量管理模块。
- 采用机器学习技术进行参数优化和信号质量评估。
总结
本策略整合了趋势跟踪和极点反转交易思路,加入多时间框架分析和多种指标综合利用,目的是提高交易胜率。关键是要控制好风险,优化参数设置,并适时考虑大周期趋势对交易的影响。总体来说,该策略具有较强的实用性和拟合性。后续可采用更多高级技术进一步提升策略质量。
策略源码
/*backtest
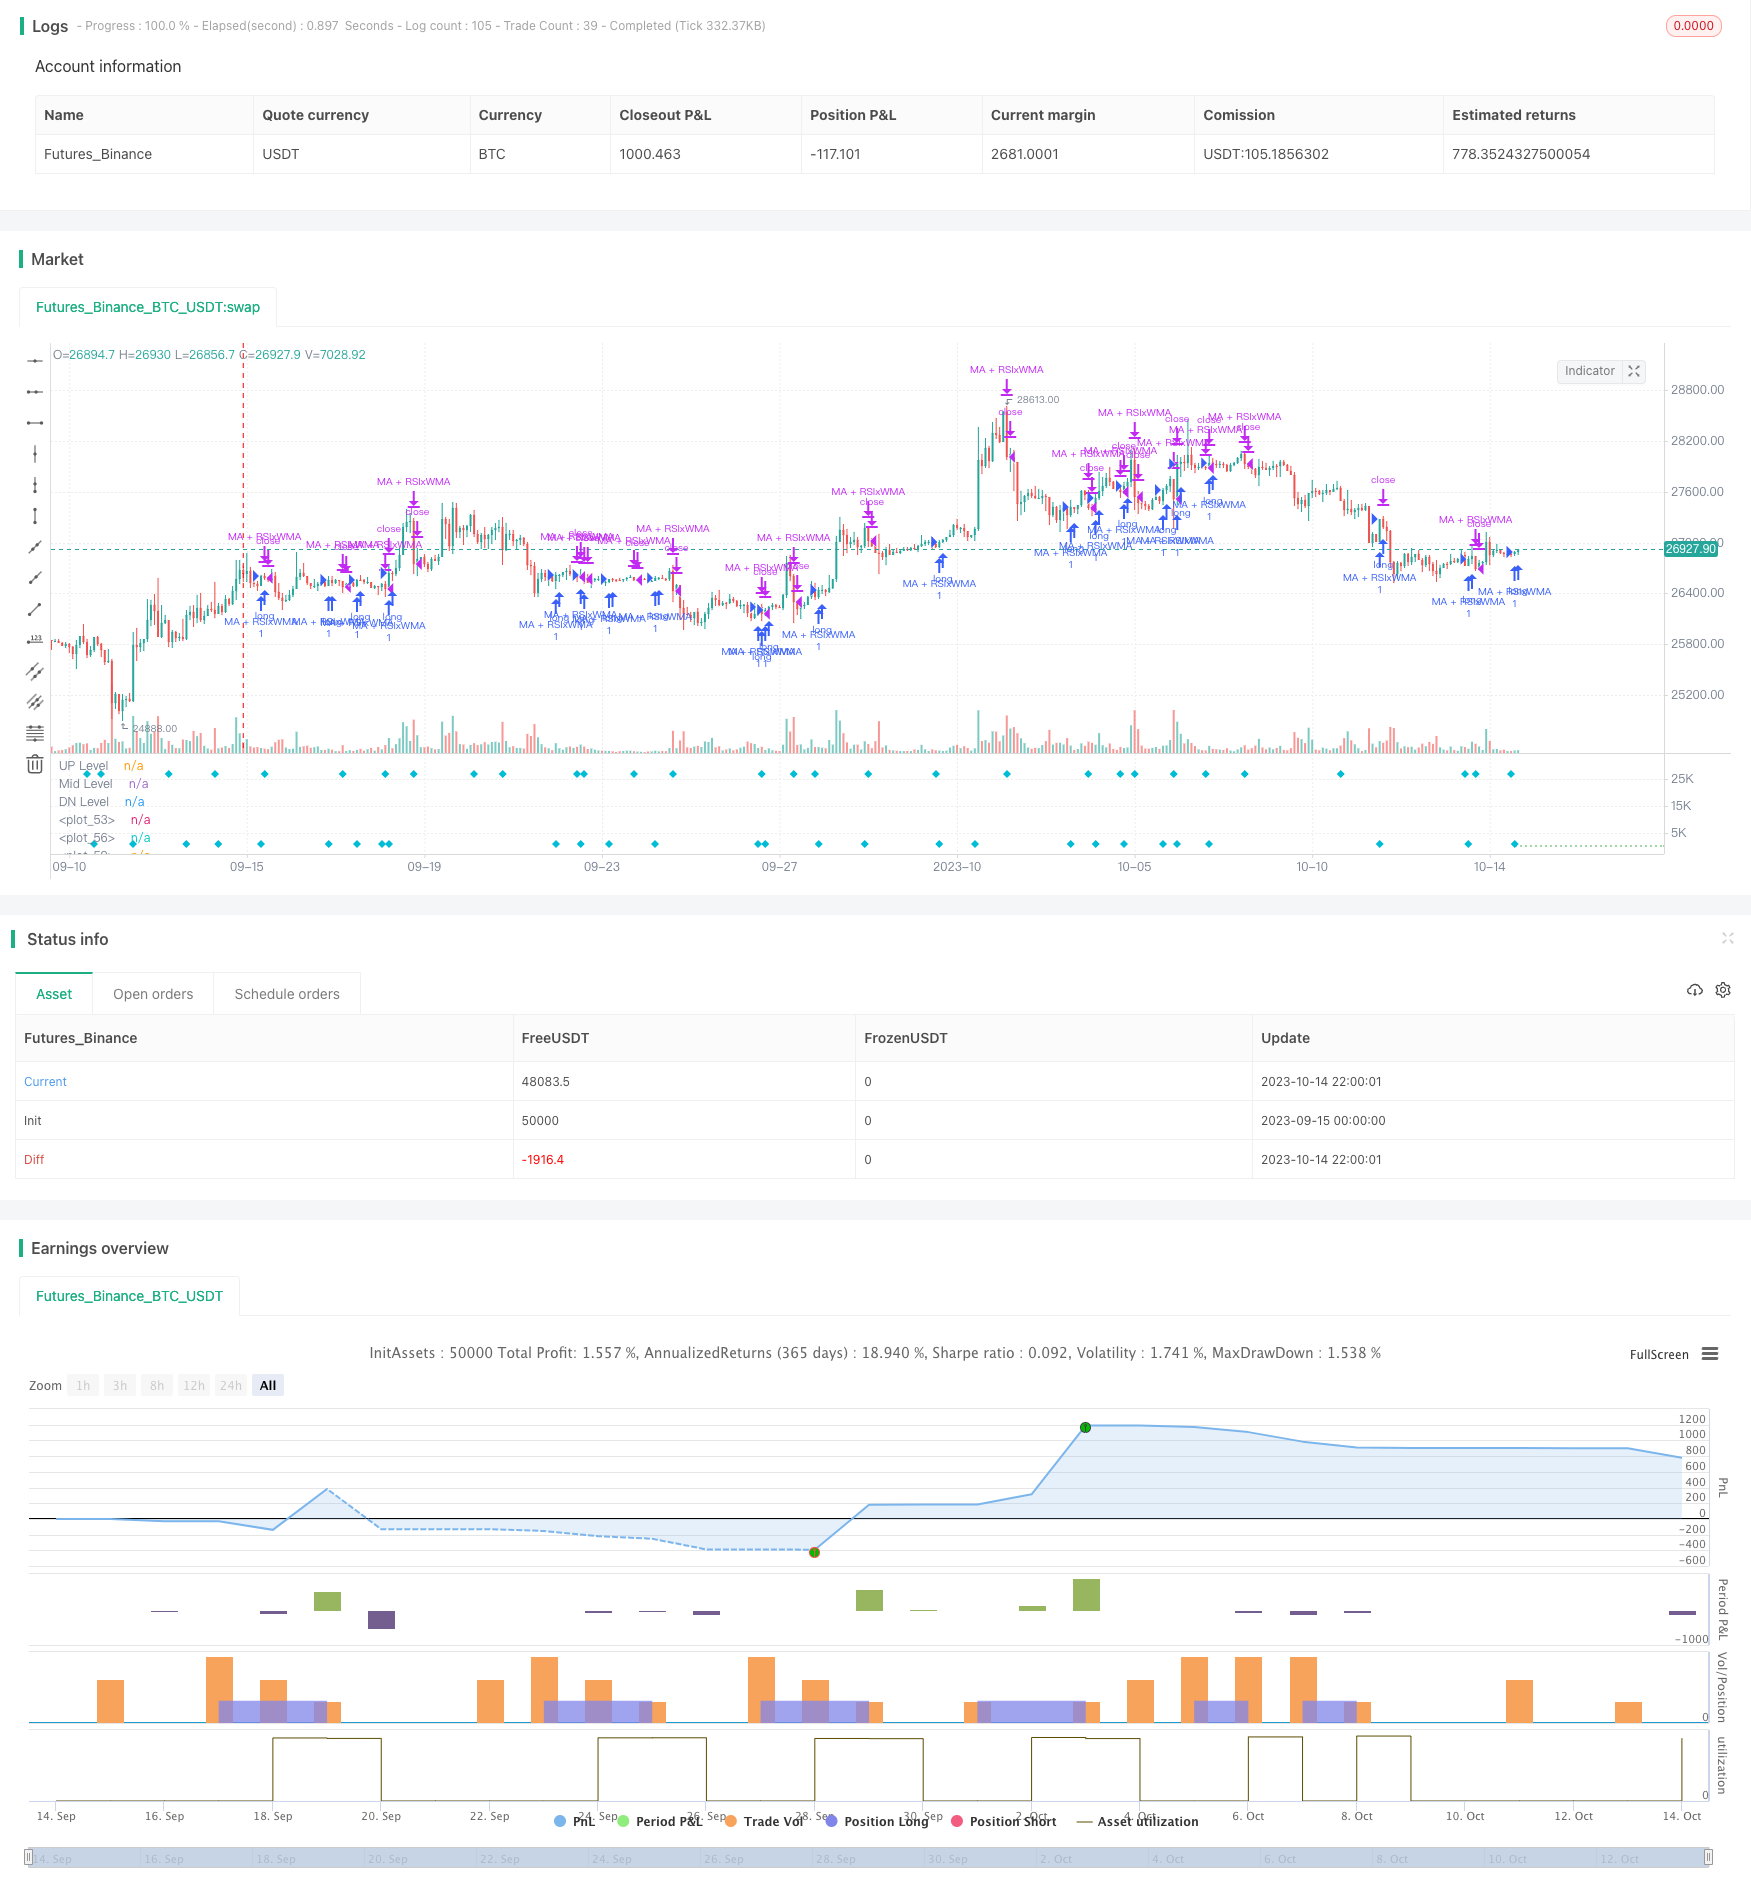
start: 2023-09-15 00:00:00
end: 2023-10-15 00:00:00
period: 2h
basePeriod: 15m
exchanges: [{"eid":"Futures_Binance","currency":"BTC_USDT"}]
*/
// This source code is subject to the terms of the Mozilla Public License 2.0 at https://mozilla.org/MPL/2.0/
// © HamidBox
//@version=4
// strategy("H-M By HamidBox-YT", default_qty_type=strategy.cash, default_qty_value= 100, initial_capital=100, currency='USD', commission_type=strategy.commission.percent, commission_value=0.1)
ma(source, length, type) =>
type == "SMA" ? sma(source , length) :
type == "EMA" ? ema(source , length) :
type == "WMA" ? wma(source , length) :
type == "VWMA" ? vwma(source , length) :
na
WMA(source, length, type) =>
type == "SMA" ? sma(source , length) :
type == "EMA" ? ema(source , length) :
type == "WMA" ? wma(source , length) :
type == "VWMA" ? vwma(source , length) :
na
WithMA(source, length, type) =>
type == "SMA" ? sma(source , length) :
type == "EMA" ? ema(source , length) :
type == "WMA" ? wma(source , length) :
type == "VWMA" ? vwma(source , length) :
na
rsi_inline = input(true , title="RSI Value)", inline="rsi")
rsiLength = input(title="Length:", type=input.integer, defval=9, minval=1, inline="rsi")
rsiLineM = input(title="Level:", type=input.integer, defval=50, minval=1, inline="rsi")
rsi_OSOBinline = input(true , title="RSI)", inline="rsiosob")
rsiLineU = input(title="O-BOUGHT", type=input.integer, defval=70, minval=1, inline="rsiosob")
rsiLineD = input(title="O-SOLD", type=input.integer, defval=30, minval=1, inline="rsiosob")
ma_inline = input(true , title="Price-MA)", inline="ma")
ma_type = input(title="Type", defval="EMA", options=["EMA","SMA","WMA","VWMA"], inline="ma")
emaLength = input(title="Length", type=input.integer, defval=3, inline="ma")
wma_inline = input(true , title="Trending-MA)", inline="wma")
ma_type2 = input(title="", defval="WMA", options=["EMA","SMA","WMA","VWMA"], inline="wma")
wmaLength = input(title="Length", type=input.integer, defval=21, inline="wma")
////////////////////////////////////////////////////////////////////////////////
startTime = input(title="Start Time", type = input.time, defval = timestamp("01 Jan 2021 00:00 +0000"), group="Backtest Time Period")
endTime = input(title="End Time", type = input.time, defval = timestamp("01 Jan 2200 00:00 +0000"), group="Backtest Time Period")
inDateRange = true
////////////////////////////////////////////////////////////////////////////////
rsi = rsi(close , rsiLength)
r = plot(rsi_inline ? rsi : na, color=color.yellow, linewidth=2)
EMA = ma(rsi, emaLength, ma_type)
e = plot(ma_inline ? EMA : na, color=color.lime)
myWMA = ma(rsi, wmaLength, ma_type2)
w = plot(wma_inline ? myWMA : na, color=color.white, linewidth=2)
up = hline(rsiLineU, title='UP Level', linewidth=1, color=color.red, linestyle=hline.style_dotted)
mid = hline(rsiLineM, title='Mid Level', linewidth=2, color=color.white, linestyle=hline.style_dotted)
dn = hline(rsiLineD, title='DN Level', linewidth=1, color=color.green, linestyle=hline.style_dotted)
col_e_w = EMA > myWMA ? color.new(color.green , 85) : color.new(color.red , 85)
col_r_w = rsi > myWMA ? color.new(color.green , 85) : color.new(color.red , 85)
fill(e , w, color=col_e_w)
fill(r , w, color=col_r_w)
////////////////////////////////////////////////////////////////////////////////
//Signals = input(true,group="👇 🚦 --- Backtesting Signals Type --- 🚦 ")
///////////////////////////////////////////////////////////////////////////////
RSI_Cross = input(false, "RSI x Trending-MA", inline="wma_cross",group="👇 🚦 --- Backtesting Signals Type --- 🚦 ") // INPUT
rsiBuySignal = crossover(rsi , myWMA)
plotshape(RSI_Cross ? rsiBuySignal : na, title="RSI Crossover", style=shape.labelup, location=location.bottom, color=color.green)
rsiSellSignal = crossunder(rsi , myWMA)
plotshape(RSI_Cross ? rsiSellSignal : na, title="RSI Crossunder", style=shape.labeldown, location=location.top, color=color.red)
if rsiBuySignal and RSI_Cross and inDateRange
strategy.entry("RSIxWMA", strategy.long)
if rsiSellSignal and RSI_Cross and inDateRange
strategy.close("RSIxWMA", comment="x")
if (not inDateRange)
strategy.close_all()
////////////////////////////////////////////////////////////////////////////////
MA_Cross = input(false, "MA x Trendin-MA",group="👇 🚦 --- Backtesting Signals Type --- 🚦 ") // INPUT
maBuySignal = crossover(EMA, myWMA)
plotshape(MA_Cross ? maBuySignal : na, title="MA Cross", style=shape.circle, location=location.bottom, color=color.lime)
maSellSignal = crossunder(EMA , myWMA)
plotshape(MA_Cross ? maSellSignal : na, title="RSI Crossunder", style=shape.circle, location=location.top, color=color.maroon)
if maBuySignal and MA_Cross and inDateRange
strategy.entry("MAxWMA", strategy.long)
if maSellSignal and MA_Cross and inDateRange
strategy.close("MAxWMA", comment="x")
if (not inDateRange)
strategy.close_all()
////////////////////////////////////////////////////////////////////////////////
Mix = input(false, "RSI + EMA x Trending-MA",group="👇 🚦 --- Backtesting Signals Type --- 🚦 ") // INPUT
rsi_ma_buy = crossover(rsi , myWMA) and crossover(EMA, myWMA)
rsi_ma_sell = crossunder(rsi , myWMA) and crossunder(EMA, myWMA)
plotshape(Mix ? rsi_ma_buy : na, title="RSI Crossunder", style=shape.circle, location=location.bottom, color=color.lime, size=size.tiny)
plotshape(Mix ? rsi_ma_sell : na, title="RSI Crossunder", style=shape.circle, location=location.top, color=color.yellow, size=size.tiny)
if rsi_ma_buy and Mix and inDateRange
strategy.entry("RSI+EMA x WMA", strategy.long)
if rsi_ma_sell and Mix and inDateRange
strategy.close("RSI+EMA x WMA", comment="x")
if (not inDateRange)
strategy.close_all()
////////////////////////////////////////////////////////////////////////////////
wma_cross = input(false, "Trending-MA x 50",group="👇 🚦 --- Backtesting Signals Type --- 🚦 ") // INPUT
wma_buy = crossover(myWMA , rsiLineM)
plotshape(wma_cross ? wma_buy : na, title="WMA Cross", style=shape.diamond, location=location.bottom, color=color.aqua)
wma_sell = crossunder(myWMA , rsiLineM)
plotshape(wma_cross ? wma_sell : na, title="WMA Cross", style=shape.diamond, location=location.top, color=color.aqua)
if wma_buy and wma_cross and inDateRange
strategy.entry("WMA x 50", strategy.long)
if wma_sell and wma_cross and inDateRange
strategy.close("WMA x 50", comment="x")
if (not inDateRange)
strategy.close_all()
////////////////////////////////////////////////////////////////////////////////
rsi_50 = input(false, "RSI x 50",group="👇 🚦 --- Backtesting Signals Type --- 🚦 ") // INPUT
rsi_50_buy = crossover(rsi , rsiLineM)
plotshape(rsi_50 ? rsi_50_buy : na, title="WMA Cross", style=shape.cross, location=location.bottom, color=color.purple)
rsi_50_sell = crossunder(rsi , rsiLineM)
plotshape(rsi_50 ? rsi_50_sell : na, title="WMA Cross", style=shape.cross, location=location.top, color=color.purple)
if rsi_50_buy and rsi_50 and inDateRange
strategy.entry("RSI Cross 50", strategy.long)
if rsi_50_sell and rsi_50 and inDateRange
strategy.close("RSI Cross 50", comment="x")
if (not inDateRange)
strategy.close_all()
////////////////////////////////////////////////////////////////////////////////
RSI_OS_OB = input(false, "RSI OS/OB x Trending-MA",group="👇 🚦 --- Backtesting Signals Type --- 🚦 ") // INPUT
rsi_OB_buy = (rsi < rsiLineD or rsi[1] < rsiLineD[1] or rsi[2] < rsiLineD[2] or rsi[3] < rsiLineD[3] or rsi[4] < rsiLineD[4] or rsi[5] < rsiLineD[5]) and rsiBuySignal
plotshape(RSI_OS_OB ? rsi_OB_buy : na, title="RSI OB + Cross", style=shape.circle, location=location.bottom, color=color.lime, size=size.tiny)
rsi_OS_sell = (rsi > rsiLineU or rsi[1] > rsiLineU[1] or rsi[2] > rsiLineU[2] or rsi[3] > rsiLineU[3] or rsi[4] > rsiLineU[4] or rsi[5] > rsiLineU[5]) and maSellSignal
plotshape(RSI_OS_OB ? rsi_OS_sell : na, title="RSI OS + Cross", style=shape.circle, location=location.top, color=color.red, size=size.tiny)
if rsi_OB_buy and RSI_OS_OB and inDateRange
strategy.entry("RSI-OBOS x WMA", strategy.long)
if rsi_OS_sell and RSI_OS_OB and inDateRange
strategy.close("RSI-OBOS x WMA", comment="x")
if (not inDateRange)
strategy.close_all()
////////////////////////////////////////////////////////////////////////////////
rsi_OB_OS = input(false, "RSI Over Sold/Bought",group="👇 🚦 --- Backtesting Signals Type --- 🚦 ") // INPUT
rsiBuy = crossover(rsi , rsiLineD)
rsiSell = crossunder(rsi, rsiLineU)
rsiExit = crossunder(rsi, rsiLineD)
plotshape(rsi_OB_OS ? rsiBuy : na, title="RSI OB", style=shape.cross, location=location.bottom, color=color.purple)
plotshape(rsi_OB_OS ? crossunder(rsi, rsiLineU) : na, title="RSI OS", style=shape.cross, location=location.top, color=color.purple)
plotshape(rsi_OB_OS ? rsiExit : na, title="RSI OS", style=shape.cross, location=location.bottom, color=color.red)
if rsiBuy and rsi_OB_OS and inDateRange
strategy.entry("RSI OB", strategy.long)
if (rsiSell or rsiExit) and rsi_OB_OS and inDateRange
strategy.close("RSI OB", comment="x")
if (not inDateRange)
strategy.close_all()
////////////////////////////////////////////////////////////////////////////////
////////////////////////////////////////////////////////////////////////////////
With_MA_Vis = input(true , title="With MA Signal)", inline="WITH MA", group="With MA")
withMA_type = input(title="", defval="SMA", options=["EMA","SMA","WMA","VWMA"], inline="WITH MA", group="With MA")
with_MALen = input(title="", defval=9, type=input.integer, inline="WITH MA", group="With MA")
// TAKE-PROFIT / STOP-LOSS
Stop_Take_Vis = input(true, "TP-SL")
LongSLValue = input(title="SL %", type=input.float, defval=3, minval=0.5) * 0.01
LongTPValue = input(title="TP %", type=input.float, defval=15, minval=0.5) * 0.01
LongSLDetermine = strategy.position_avg_price * (1 - LongSLValue)
LongTPDetermine = strategy.position_avg_price * (1 + LongTPValue)
//////////////////////////
with_ma = WithMA(close, with_MALen, withMA_type)
Close_buy_MA = crossover(close , with_ma)
Close_sell_MA = crossunder(close , with_ma)
// PLOT OPTION
WithMaSignal = input(true, "MA + RSI x Trending-MA",group="With MA") // INPUT
// CONDITION IN VARIABLE
withMA_RSI_BUY = (Close_buy_MA and rsiBuySignal) and WithMaSignal and inDateRange
withMA_RSI_SELL = (Close_sell_MA and rsiSellSignal) and WithMaSignal and inDateRange
// PLOT ING
plotshape(WithMaSignal ? withMA_RSI_BUY : na, title="With MA", style=shape.diamond, location=location.bottom, color=color.aqua)
plotshape(WithMaSignal ? withMA_RSI_SELL : na, title="With MA", style=shape.diamond, location=location.top, color=color.aqua)
if withMA_RSI_BUY
strategy.entry("MA + RSIxWMA", strategy.long)
if withMA_RSI_SELL
strategy.close("MA + RSIxWMA", comment="x")
if (not inDateRange)
strategy.close_all()
// FOR SL - TP
if (strategy.position_size > 0) and Stop_Take_Vis
strategy.exit("BUY", stop=LongSLDetermine, limit=LongTPDetermine)