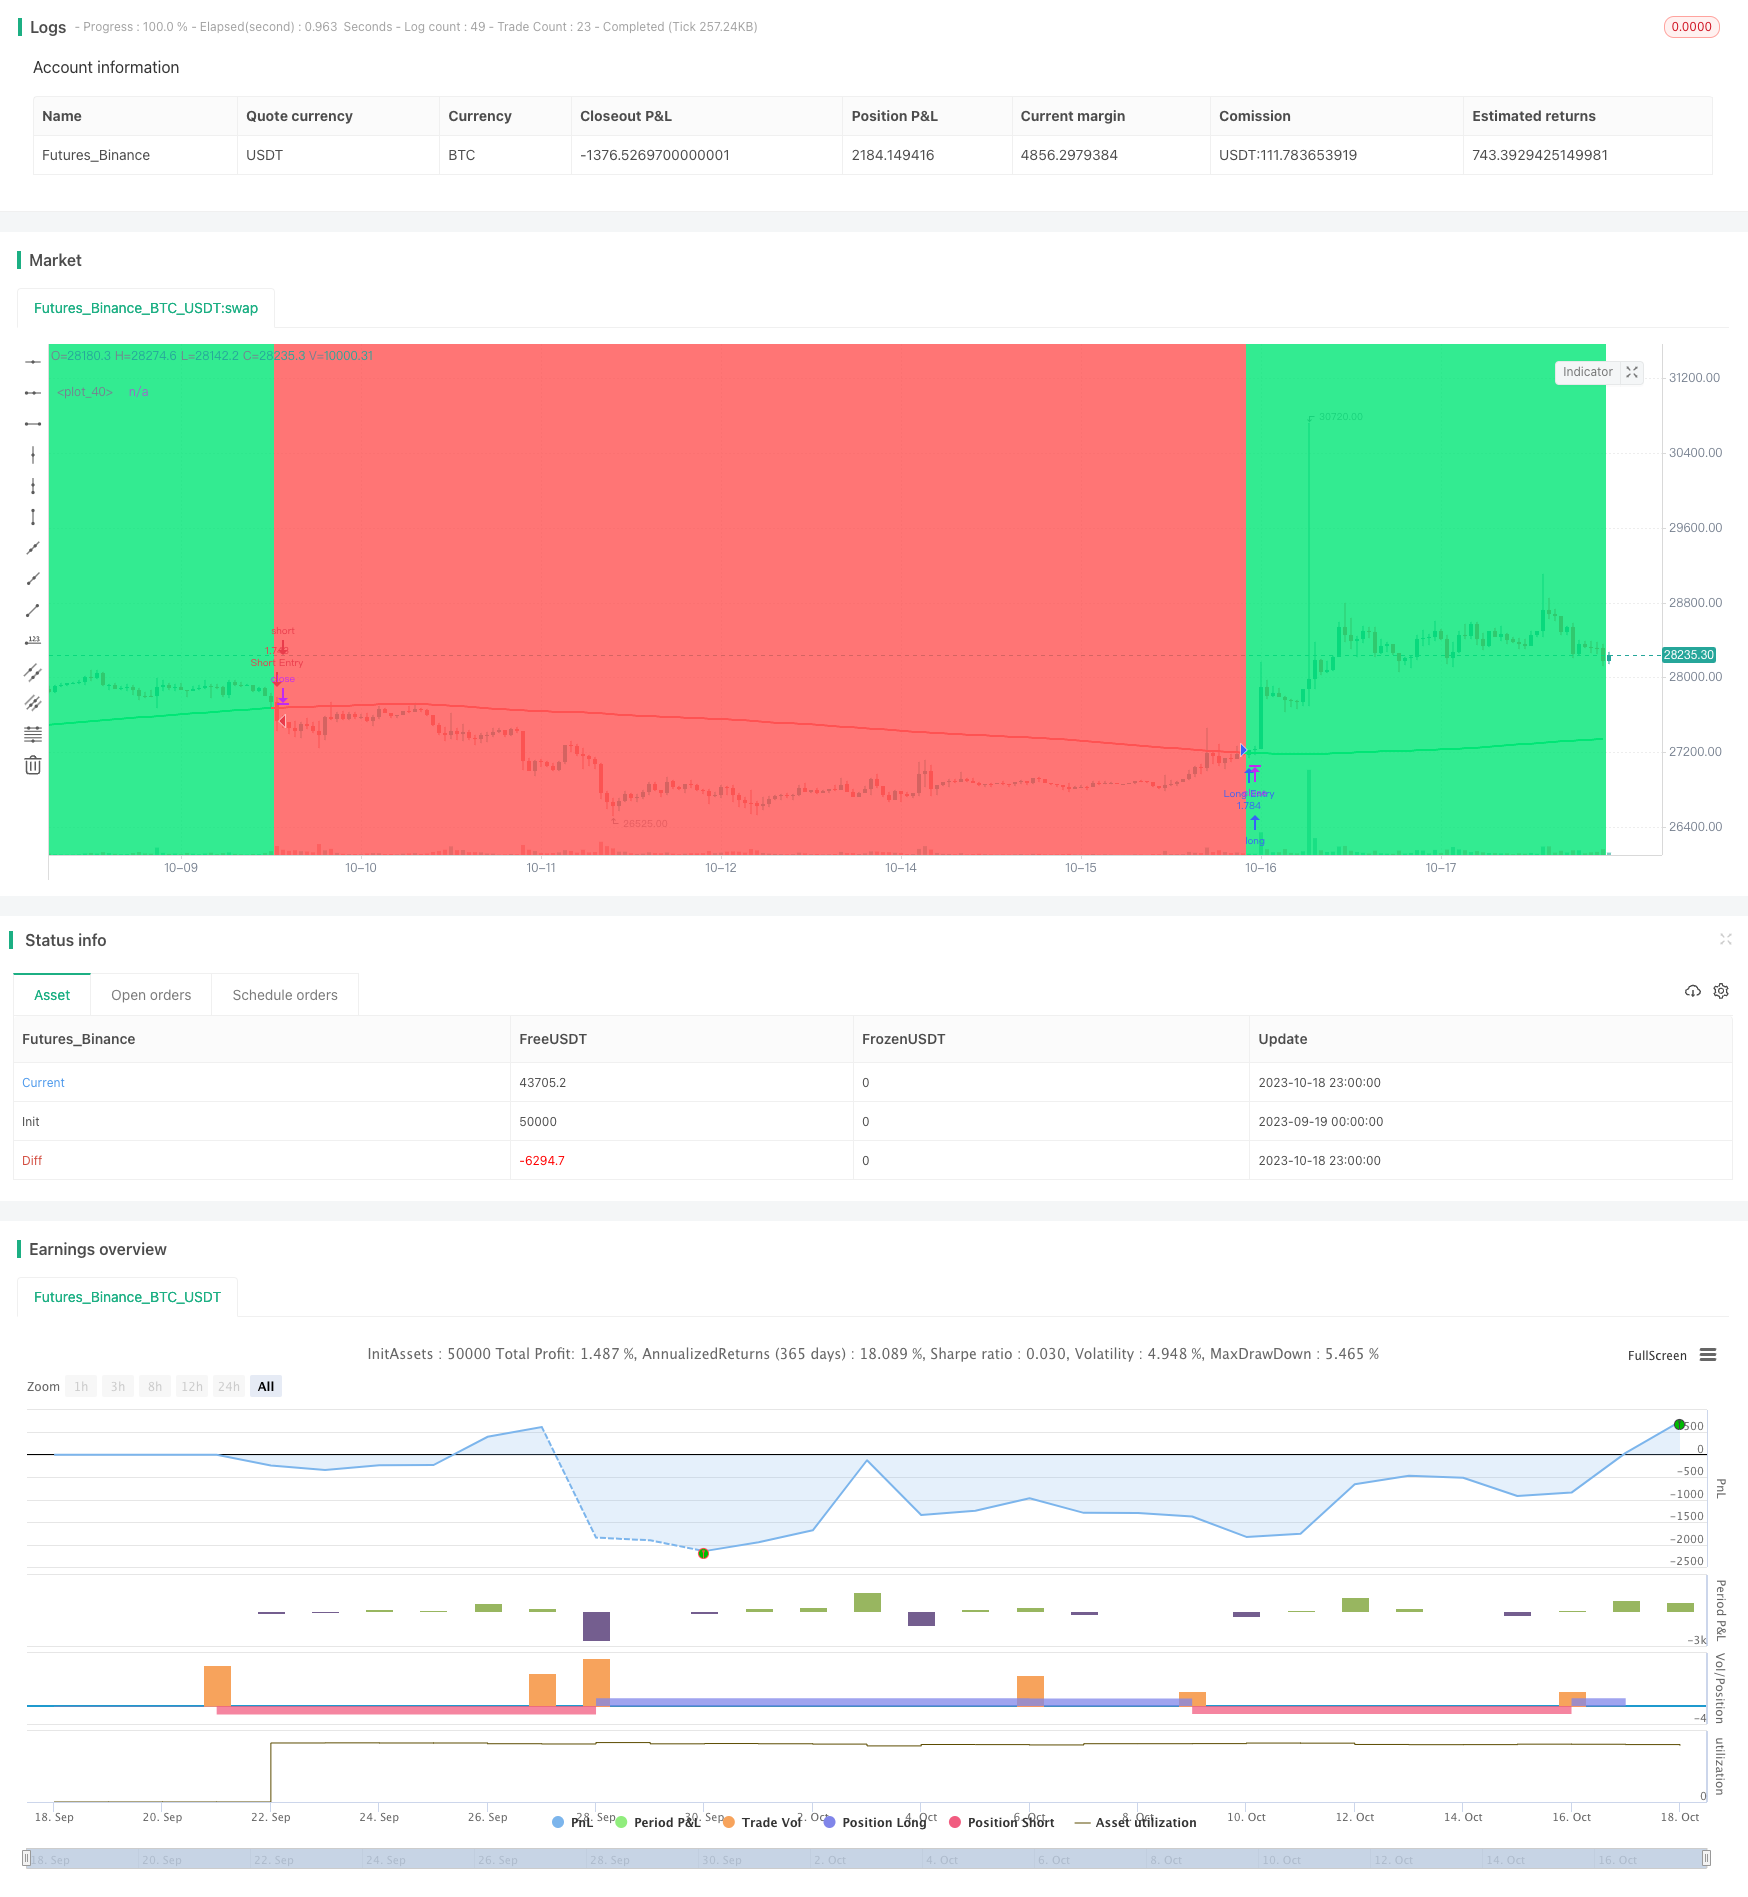
概述
移动平均线跟踪策略是一个基于简单移动平均线的趋势跟踪策略。该策略使用长度为200天的简单移动平均线判断价格趋势方向,当价格上穿移动平均线时做多,当价格下穿移动平均线时做空,实现对趋势的跟踪。
策略原理
该策略主要基于以下几点原理:
- 使用长度为200天的简单移动平均线slowMA判断价格趋势方向。
- 当收盘价close上穿slowMA时,认为行情开始上涨,因此做多。
- 当收盘价close下穿slowMA时,认为行情开始下跌,因此做空。
- 通过last_long和last_short变量记录最后一次做多和做空的时间。
- 通过crossover函数判断last_long和last_short的交叉以生成交易信号。
- 在回测时间段内,收到做多信号long_signal时做多,收到做空信号short_signal时做空。
该策略主要通过移动平均线判断趋势方向,并在均线发生转折时及时做反向操作,实现对趋势的跟踪获利。
优势分析
该策略具有以下优势:
- 策略思路简单清晰,容易理解和实现。
- 使用长周期移动平均线,可以有效过滤噪音,锁定主要趋势。
- 及时做反向操作,可以在趋势转折点捕捉较大幅度的价格波动。
- 只需要移动平均线一个指标,免除多个指标组合的复杂度。
- 入场和出场规则清晰,不需要过多的人为干预。
风险分析
该策略也存在一些风险:
- 长周期均线对短期调整不敏感,可能错过短线机会。
- 大周期趋势顶底识别能力较弱,容易发生反转损失。
- 无止损机制,可能带来较大回撤。
- 参数固定,不同品种和市场环境适应能力较弱。
- 仅基于历史数据进行策略测试,可能存在过拟合风险。
针对风险,可以从以下几个方面进行优化和改进:
- 结合短周期均线,同时兼顾长短周期趋势。
- 增加量价组合条件,避免虚假突破。
- 加入趋势性指标过滤,提高对趋势转折的识别能力。
- 增加动态止损机制,控制单笔损失。
- 采用参数优化方法,提高参数的适应性。
- 在不同市场环境中进行复制测试,检查策略稳健性。
优化方向
该策略可以从以下几个方面进行进一步优化:
优化移动平均线的周期参数,寻找最优参数组合。可以使用Walk Forward Analysis等参数优化方法。
增加短期移动平均线,形成多均线策略,同时跟踪长短周期趋势。
结合趋势性指标,如MACD等,提高识别趋势转折的能力。
加入止损机制,如跟踪止损、挂单止损等,控制单笔损失。
进行复制测试,在不同品种和不同时段中测试策略,提高稳健性。
利用机器学习等方法,实现策略的参数自适应和策略优化。
总结
移动平均线跟踪策略是一个简单实用的趋势跟踪策略,思路清晰,易于实现,可以捕捉趋势机会。但该策略也存在一些问题,如对短期调整不敏感,风险控制能力较弱等。我们可以从多方面进行优化,使策略更稳健、参数更优化、风险控制更完善。总体来说,移动平均线跟踪策略具有很好的应用价值,是量化交易的一个重要策略思路。
策略源码
/*backtest
start: 2023-09-19 00:00:00
end: 2023-10-19 00:00:00
period: 1h
basePeriod: 15m
exchanges: [{"eid":"Futures_Binance","currency":"BTC_USDT"}]
*/

//@version=4
strategy("MA X 200 BF", overlay=true, initial_capital=10000, default_qty_type=strategy.percent_of_equity, default_qty_value=100, commission_type=strategy.commission.percent, commission_value=0.0)

/////////////// Time Frame ///////////////
testStartYear = input(2012, "Backtest Start Year")
testStartMonth = input(1, "Backtest Start Month")
testStartDay = input(1, "Backtest Start Day")
testPeriodStart = timestamp(testStartYear,testStartMonth,testStartDay, 0, 0)

testStopYear = input(2019, "Backtest Stop Year")
testStopMonth = input(12, "Backtest Stop Month")
testStopDay = input(31, "Backtest Stop Day")
testPeriodStop = timestamp(testStopYear,testStopMonth,testStopDay, 0, 0)

testPeriod() => true

///////////// MA 200 /////////////
slowMA = sma(close, input(200))

/////////////// Strategy ///////////////
long = close > slowMA
short = close < slowMA

last_long = 0.0
last_short = 0.0
last_long := long ? time : nz(last_long[1])
last_short := short ? time : nz(last_short[1])

long_signal = crossover(last_long, last_short)
short_signal = crossover(last_short, last_long)

/////////////// Execution ///////////////
if testPeriod()
    strategy.entry("Long Entry",  strategy.long, when=long_signal)
    strategy.entry("Short Entry", strategy.short, when=short_signal)
    strategy.exit("Long Ex", "Long Entry")
    strategy.exit("Short Ex", "Short Entry")

/////////////// Plotting ///////////////
plot(slowMA, color = long ? color.lime : color.red, linewidth=2)
bgcolor(strategy.position_size > 0 ? color.lime : strategy.position_size < 0 ? color.red : color.white, transp=80)
bgcolor(long_signal ? color.lime : short_signal ? color.red : na, transp=30)