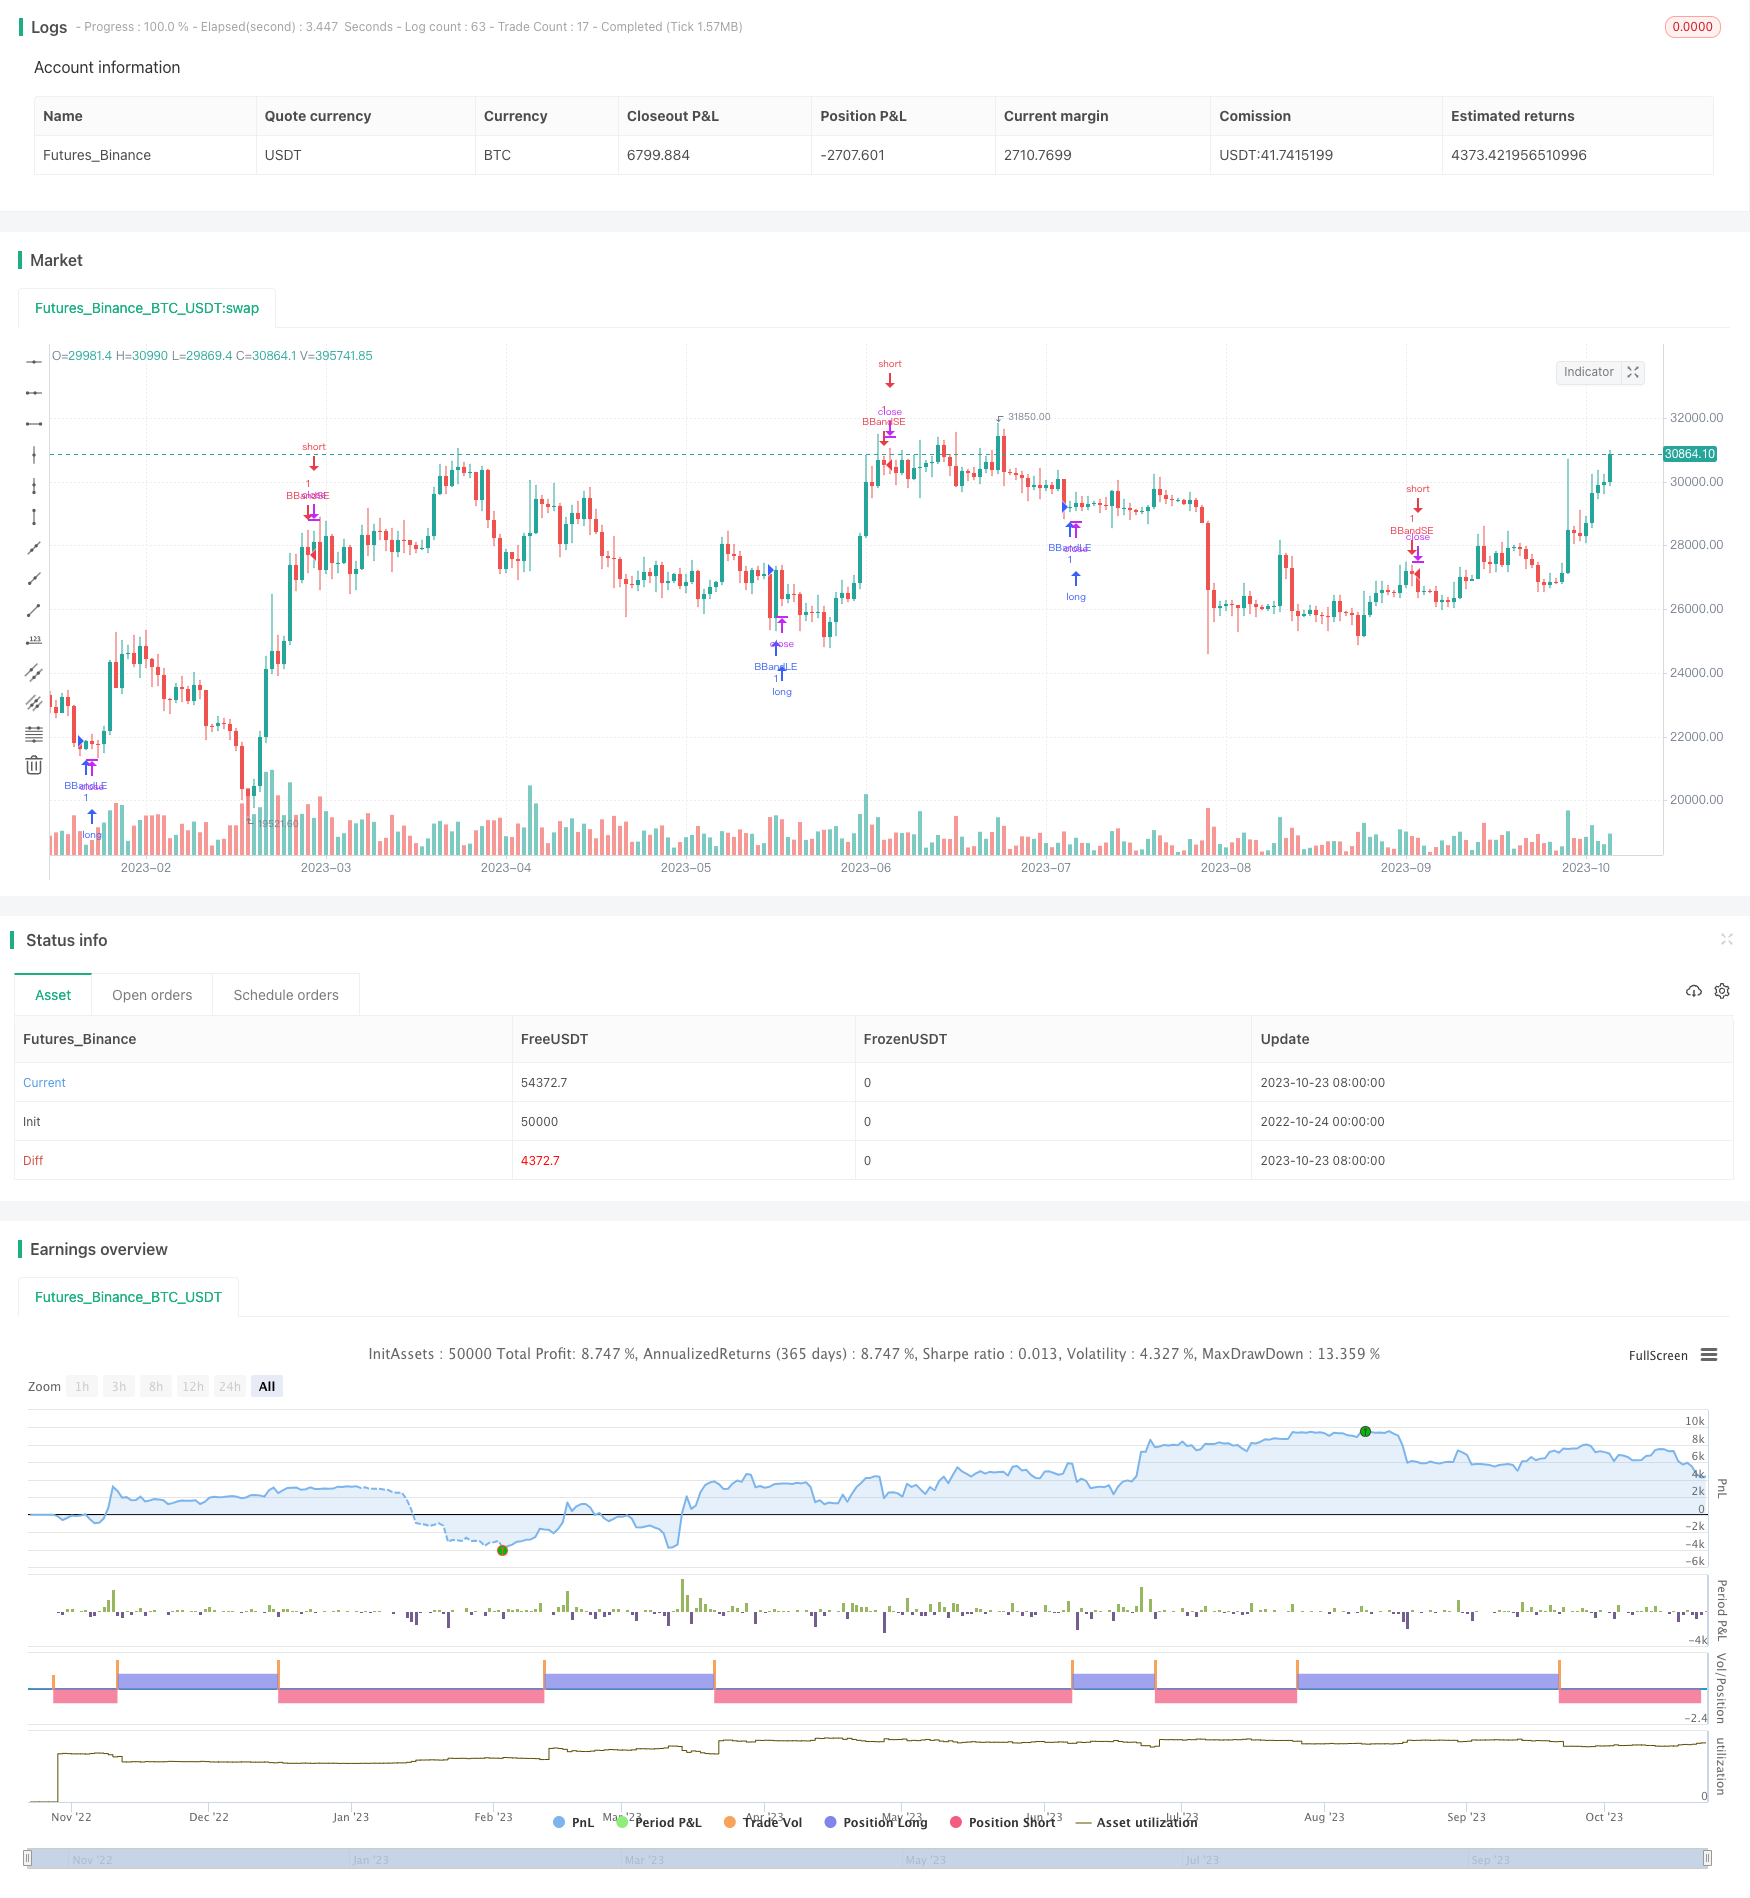
概述
均线穿越波动带策略利用布林带指标判断市场波动性,配合均线判断市场趋势,在波动率低的情况下判断趋势方向,达到在低波动时获取趋势利润的目的。
策略原理
该策略通过计算均线及其上下波动带来判断市场的波动率。具体来说,先计算n日简单移动均线,然后在均线上下各扩张k倍的标准差范围,形成上轨和下轨,即布林带。当价格接近上下轨时,表示市场波动加大;当价格位于上下轨之间时,表示市场波动减小。
该策略在波动减小时,利用均线的方向来判断趋势方向,在均线上行时做多,在均线下行时做空。具体来说,当价格从下轨向上突破时,做多;当价格从上轨向下突破时,做空。每个仓位的止损点设为对应轨道,以控制风险。
该策略的优点是在波动率较低时参与趋势,避开了部分市场的随机波动,从而提高获利概率。
优势分析
- 利用波动率低时判断趋势,减少随机性,提高稳定性
该策略只在布林带收缩,市场波动减弱的时候参与趋势,避开了高波动时期的不确定性,从而减少了随机性,提高了稳定性。
- 均线辅助判断,提高判断准确性
该策略除了布林带识别波动率外,还引入均线判断趋势方向,两者互为验证,可以提高判断的准确性。
- 有止损点,控制风险
该策略的每笔交易都设定了止损点,即布林带的上轨或下轨,可以快速止损,控制风险。
风险分析
- 趋势判断失误风险
在布林带收缩的过程中,均线方向可能发生改变,导致趋势判断发生错误,从而造成损失。
可以通过调整均线参数,或增加其他指标进行验证,来减少这种风险。
- 布林带波动过大风险
如果布林带参数设定过大,波动过大,可能会导致无效交易次数过多。
可以通过调整布林带标准差倍数参数来优化,也可以设定布林带宽度的阈值作为过滤条件。
- 突破失败风险
价格突破上轨或下轨后可能失败,无法形成趋势,造成损失。
可以通过仅在收盘价或K线实体突破时才入场,或增加量能等辅助条件来验证突破信号,来减少突破失败概率。
优化方向
- 结合更多指标验证
可以引入像MACD,KDJ等其他指标,对均线判断进行验证,提高判断准确率。
- 优化参数
可以通过回测优化均线参数,布林带标准差倍数参数,来获得最佳参数组合。
- 优化入场时机选择
可以调整为只在收盘价或K线实体突破布林带时入场,或增加量能条件来验证突破。
- 优化止损策略
可以通过trailing stop或移动止损等方式来锁定利润,避免给利润回吐。
总结
均线穿越波动带策略是一种典型的趋势跟踪策略。它巧妙地利用布林带判断低波动时间段,配合均线判断趋势方向,在波动率较低时参与趋势。这可以有效滤除一部分市场随机性,提高稳定性。该策略有一定的优势,但也存在一定的风险,需要注意防范。通过引入更多指标,优化参数和入场时机等,可以不断提升该策略的稳定性和profit因子。
/*backtest
start: 2022-10-24 00:00:00
end: 2023-10-24 00:00:00
period: 1d
basePeriod: 1h
exchanges: [{"eid":"Futures_Binance","currency":"BTC_USDT"}]
*/

//@version=4
strategy("Trading Public School", overlay=true)
source = close
length = input(20, minval=1)
mult = input(2.0, minval=0.001, maxval=50)

basis = sma(source, length)
dev = mult * stdev(source, length)

upper = basis + dev
lower = basis - dev

buyEntry = crossover(source, lower)
sellEntry = crossunder(source, upper)

if (crossover(source, lower))
    strategy.entry("BBandLE", strategy.long, stop=lower, oca_name="BollingerBands",  comment="BBandLE")
else
    strategy.cancel(id="BBandLE")

if (crossunder(source, upper))
    strategy.entry("BBandSE", strategy.short, stop=upper, oca_name="BollingerBands",  comment="BBandSE")
else
    strategy.cancel(id="BBandSE")

//plot(strategy.equity, title="equity", color=color.red, linewidth=2, style=plot.style_areabr)