概述
渐积突破交易策略通过识别市场的渐积和分配阶段,采用维克多分析原理,辅以弹弓形态和反转形态的判断,寻找潜在的买入和卖出机会。
策略原理
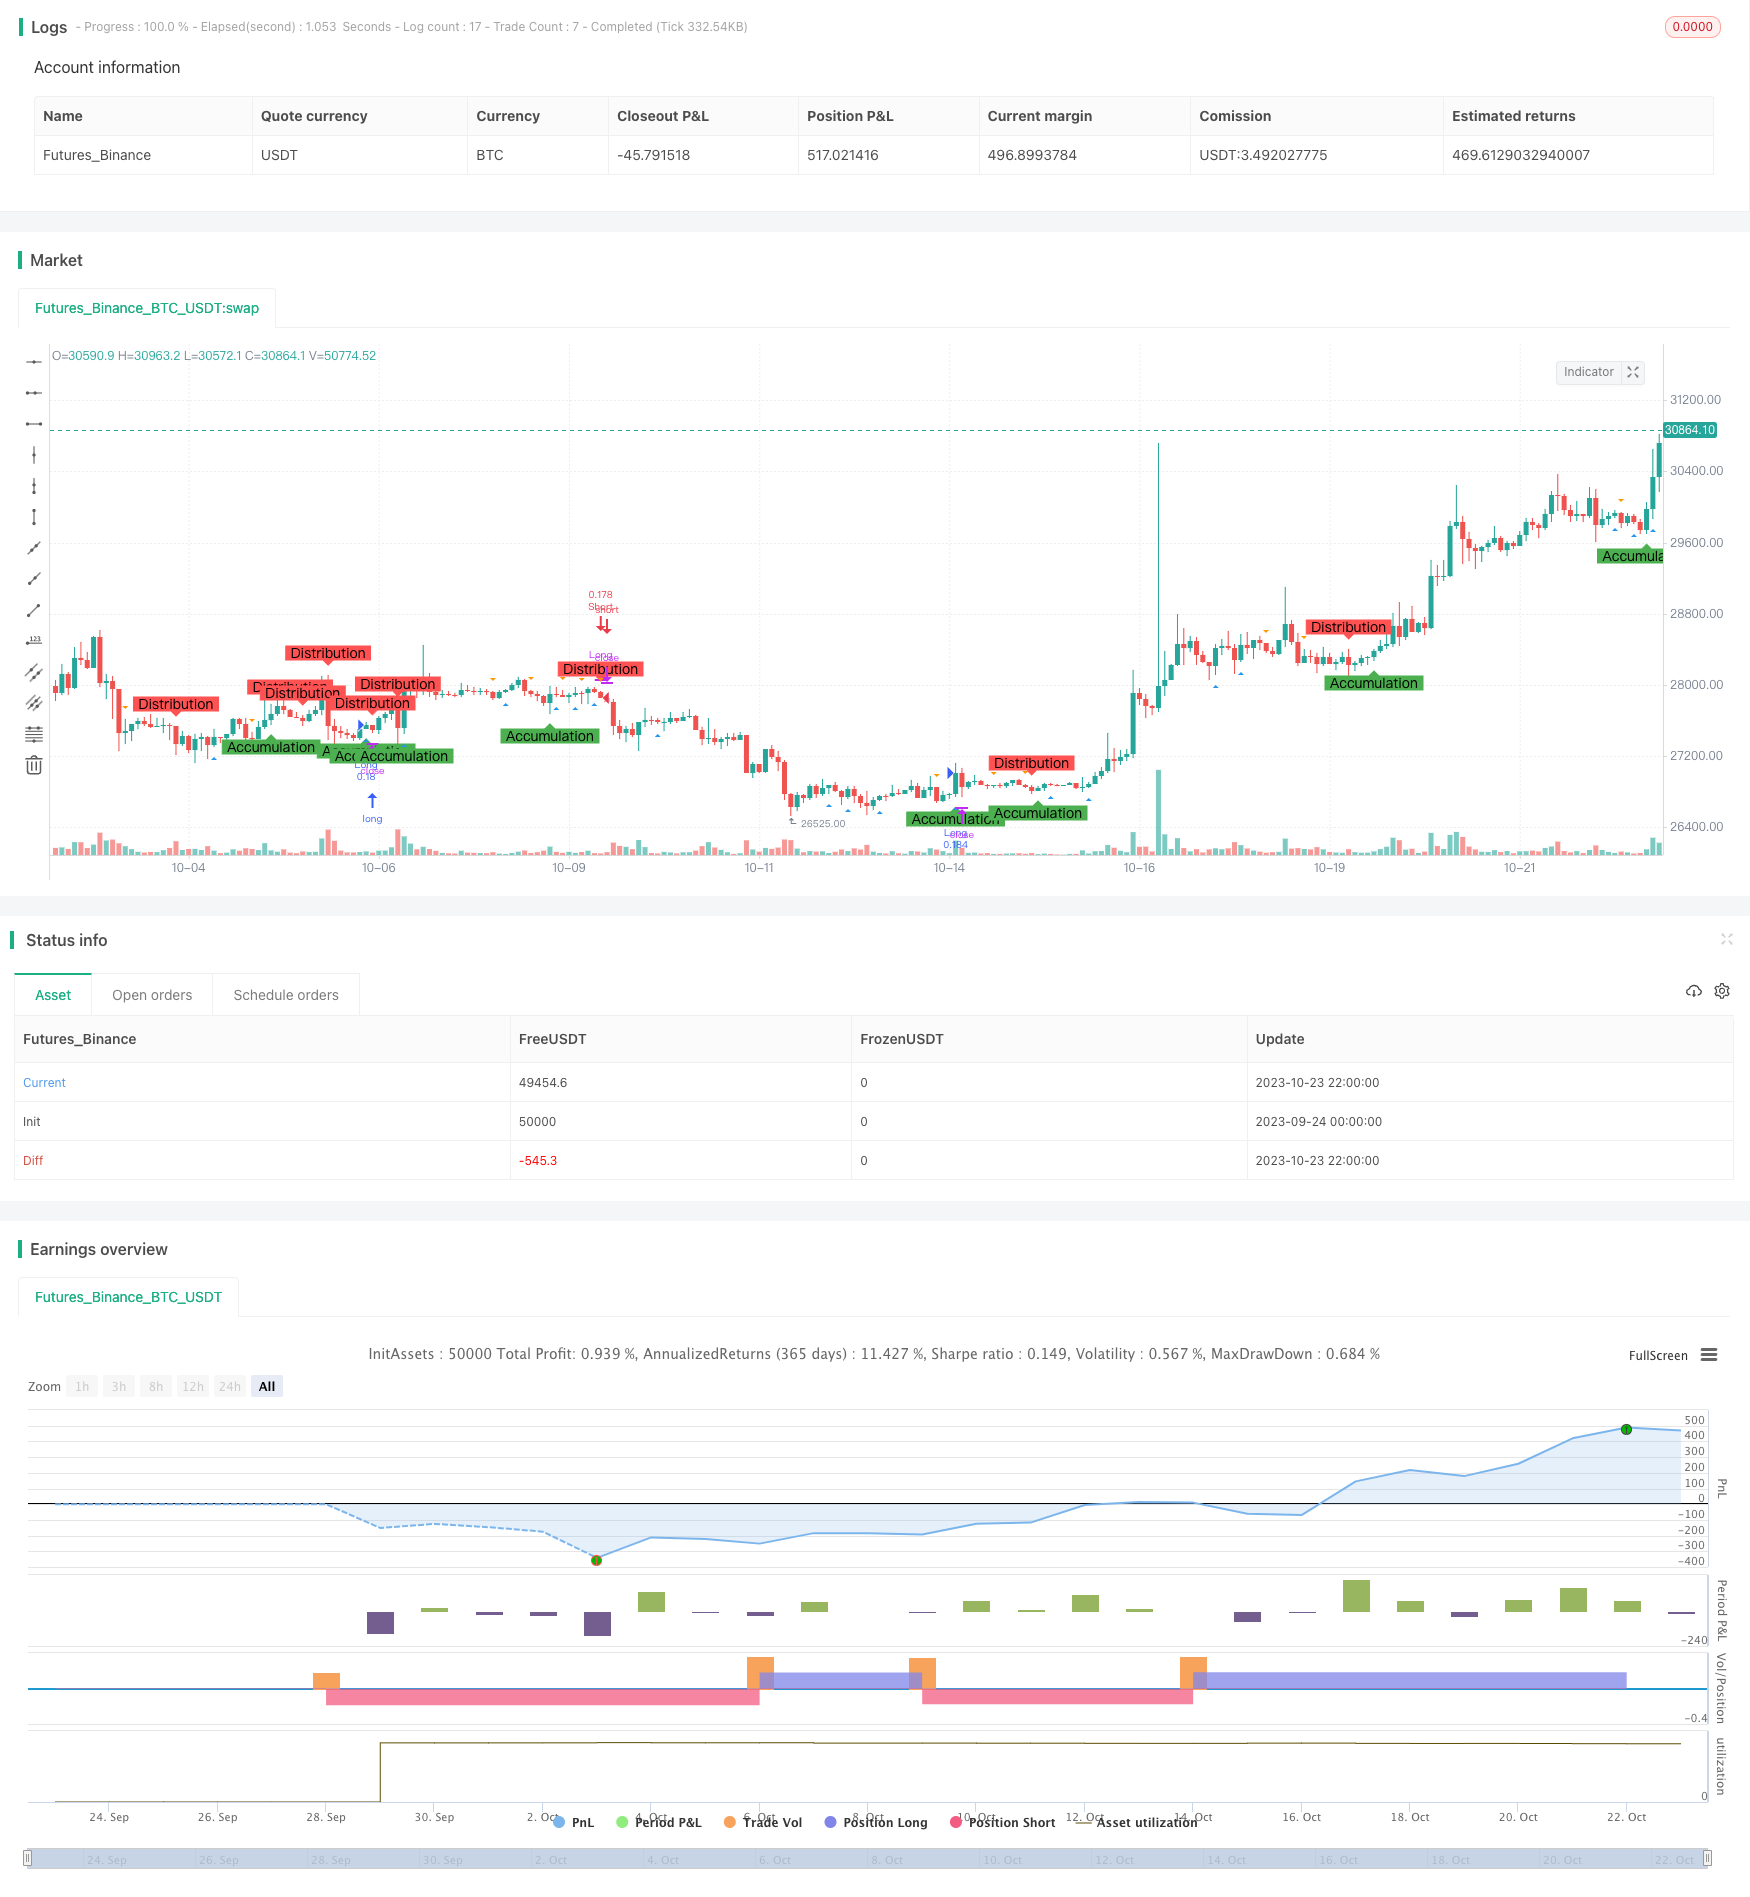
使用不同长度的均线交叉来识别渐积和分配阶段。当收盘价上穿长度为AccumulationLength的均线时,判断为渐积阶段;当收盘价下穿长度为DistributionLength的均线时,判断为分配阶段。
使用不同长度的均线交叉来识别弹弓形态和反转形态。当低点上穿长度为SpringLength的均线时,判断为弹弓形态;当高点下穿长度为UpthrustLength的均线时,判断为反转形态。
在渐积阶段观察到弹弓形态时,做多;在分配阶段观察到反转形态时,做空。
设置止损水平。长仓止损价为收盘价的(1 - 止损百分比%),短仓止损价为收盘价的(1 + 止损百分比%)。
在图表上标注渐积阶段、分配阶段、弹弓形态和反转形态,便于形态识别。
优势分析
使用维克多分析方法识别市场蓄势的渐积和分配阶段,可以提高交易信号的可靠性。
结合弹弓形态和反转形态进行交易,可以进一步验证交易信号。
设置止损可以有效控制单笔损失。
在图表上做标注,可以清晰地观察到蓄势形成的全过程。
该策略参数可调,可以针对不同市场和交易周期进行优化。
风险分析
聚合行情可能导致均线信号发出错误信号。
弹弓形态和反转形态可能会发生失效。
止损被突破可能增加亏损。
针对不同市场需要调整参数,如果不合适可能导致交易信号错误。
机械交易系统回街时间可能不够灵活,需要人工监控。
优化方向
可以测试不同市场不同周期下参数的最优组合。
可以考虑加入成交量的因素来确认交易信号。
可以设置动态止损,根据市场波动调整止损水平。
可以考虑加入基本面因素,避免在重要时间点出现错误交易。
可以加入机器学习算法来动态优化参数。
总结
渐积突破交易策略整合了维克多分析、均线指标、形态识别等多种技术分析方法,可以有效识别市场蓄势并产生交易信号。该策略具有可靠的交易信号、可控的风险、清晰的视觉展现等优点。但作为机械交易系统,其回街时间和参数适应性还有待提高。未来的优化方向在于参数组合优化、成交量确认、止损优化、重要基本面因素纳入等。总体来说,该策略为日内短线交易提供了有效的决策支持。
/*backtest
start: 2023-09-24 00:00:00
end: 2023-10-24 00:00:00
period: 2h
basePeriod: 15m
exchanges: [{"eid":"Futures_Binance","currency":"BTC_USDT"}]
*/

// This source code is subject to the terms of the Mozilla Public License 2.0 at https://mozilla.org/MPL/2.0/
// © deperp

//@version=5
strategy("Wyckoff Range Strategy",  overlay=true, initial_capital=1000, default_qty_type=strategy.percent_of_equity, default_qty_value=10, commission_type=strategy.commission.percent)

// Input Variables
AccumulationLength = input(32, "Accumulation")
DistributionLength = input(35, "Distribution")
SpringLength = input(10, "Spring")
UpthrustLength = input(20, "Upthrust")
stopPercentage = input(10, "Stop Percentage")

// Accumulation Phase
isAccumulation = ta.crossover(close, ta.sma(close, AccumulationLength))

// Distribution Phase
isDistribution = ta.crossunder(close, ta.sma(close, DistributionLength))

// Spring and Upthrust
isSpring = ta.crossover(low, ta.sma(low, SpringLength))
isUpthrust = ta.crossunder(high, ta.sma(high, UpthrustLength))

// Strategy Conditions
enterLong = isAccumulation and isSpring
exitLong = isDistribution and isUpthrust

enterShort = isDistribution and isUpthrust
exitShort = isAccumulation and isSpring

// Entry and Exit Conditions
if (enterLong)
    strategy.entry("Long", strategy.long)

if (exitLong)
    strategy.close("Long")

if (enterShort)
    strategy.entry("Short", strategy.short)

if (exitShort)
    strategy.close("Short")

// Stop Loss
stopLossLevelLong = close * (1 - stopPercentage / 100)
stopLossLevelShort = close * (1 + stopPercentage / 100)
strategy.exit("Stop Loss Long", "Long", stop=stopLossLevelLong)
strategy.exit("Stop Loss Short", "Short", stop=stopLossLevelShort)

// Plotting Wyckoff Schematics
plotshape(isAccumulation, title="Accumulation Phase", location=location.belowbar, color=color.green, style=shape.labelup, text="Accumulation")
plotshape(isDistribution, title="Distribution Phase", location=location.abovebar, color=color.red, style=shape.labeldown, text="Distribution")
plotshape(isSpring, title="Spring", location=location.belowbar, color=color.blue, style=shape.triangleup)
plotshape(isUpthrust, title="Upthrust", location=location.abovebar, color=color.orange, style=shape.triangledown)