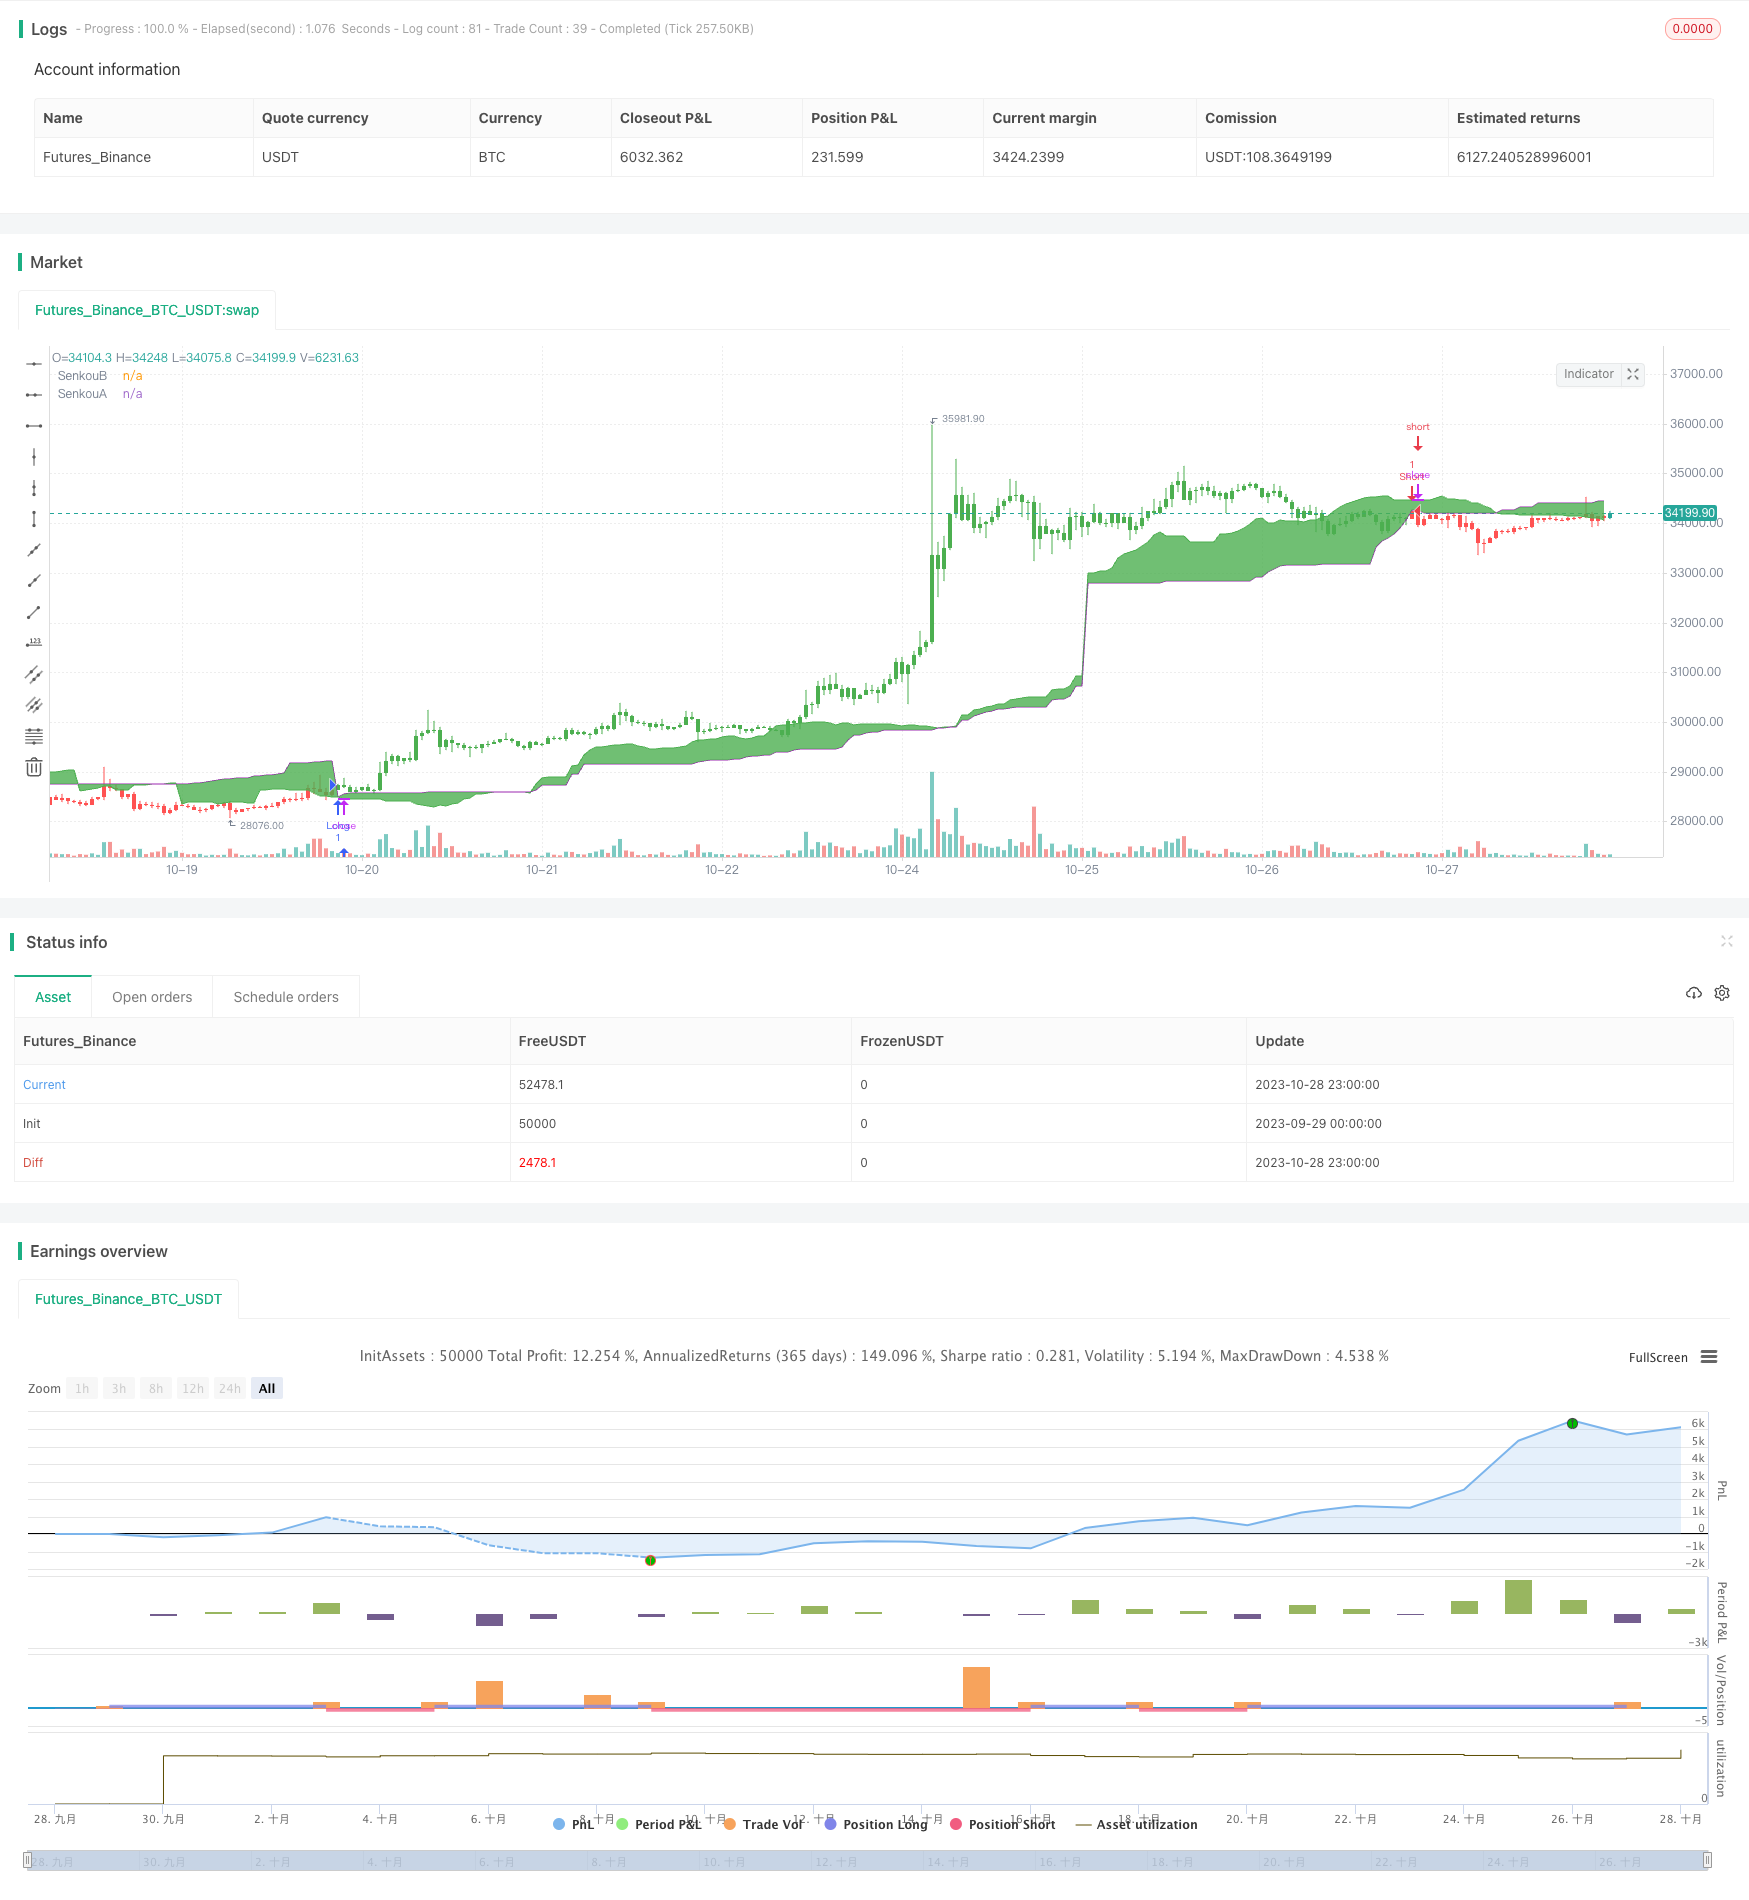
概述
一目均衡策略基于Ichimoku技术指标,结合均线系统进行交易信号生成。该策略运用Tenkan、Kijun和Senkou线,判断价格动向和趋势,产生买入和卖出信号。
策略原理
该策略使用middleDonchian函数计算Tenkan和Kijun两条均线。Tenkan线计算过去9根K线的最高价和最低价的平均值,代表短期均衡价。Kijun线计算过去26根K线的最高价和最低价的平均值,代表中期均衡价。
Senkou A线计算过去52根K线的最高价和最低价的平均值,再向后平移26根K线,代表长期未来先导。Senkou B线计算Tenkan线和Kijun线的平均值,代表当前价值中枢。
策略以close价格与Senkou A和Senkou B的关系判断价格相对强弱。当close价格上穿Senkou A线时为买入信号,下穿Senkou B线时为卖出信号。
pos变量记录当前持仓方向。possig变量根据reverse输入参数调整信号方向。最后根据pos和possig的值判断入场和出场。
策略优势
使用两组不同参数长度的均线组合,捕捉不同时间周期上的趋势变化。
Senkou A线提前反映长期趋势变化,Senkou B线捕捉当下均衡点位移,形成先导系统。
根据price突破云图上下边界判断趋势明显转折点。
可适应趋势和震荡市场。reverse参数可快速适应多空切换。
云图/-/两线叉离散现象,可过滤假突破信号。
策略风险
长短周期均线交叉时,可能产生错误信号。
震荡盘整理时,上下穿越云图边界可能频繁打开头寸。
云图叉离散导致的突破失效风险。
趋势 marketplace,追高买入/追低卖出风险。
反向操作需谨慎,应考虑大周期趋势方向。
可以通过调整均线参数组合、添加过滤条件等方式来优化,减少不必要的交易频率,避免被套。
策略优化方向
优化均线参数组合,寻找最佳平衡点。
添加 VOL 指标过滤,避免低量的假突破。
结合别的指标作为辅助判断。如MACD, KDJ等。
优化入场时机。如突破云图时,再观察收盘价是否突破加强突破有效性。
优化止损方式。如追踪止损、间隔止损等。
优化反向交易策略。可根据大周期趋势决定反向空间。
总结
一目均衡策略整合均线交易和云图分析的优势,在判断趋势转折点上具有独特优势。策略简单实用,适用于趋势及震荡市场,可通过参数优化适应不同品种和交易风格。但操作时需警惕假突破风险,应结合大周期分析确定操作方向。通过持续优化,可打造出稳定收益的指数化策略。
/*backtest
start: 2023-09-29 00:00:00
end: 2023-10-29 00:00:00
period: 1h
basePeriod: 15m
exchanges: [{"eid":"Futures_Binance","currency":"BTC_USDT"}]
*/

//@version=2
////////////////////////////////////////////////////////////
//  Copyright by HPotter v1.0 26/09/2018
//  Ichimoku Strategy
//
// You can change long to short in the Input Settings
// WARNING:
// - For purpose educate only
// - This script to change bars colors.
////////////////////////////////////////////////////////////
middleDonchian(Length) =>
    lower = lowest(Length)
    upper = highest(Length)
    avg(upper, lower)

strategy(title="Ichimoku2c Backtest", shorttitle="Ichimoku2c", overlay = true)
conversionPeriods = input(9, minval=1),
basePeriods = input(26, minval=1)
laggingSpan2Periods = input(52, minval=1),
displacement = input(26, minval=1)
reverse = input(false, title="Trade reverse")
Tenkan = middleDonchian(conversionPeriods)
Kijun =  middleDonchian(basePeriods)
xChikou = close
SenkouA = middleDonchian(laggingSpan2Periods)
SenkouB = (Tenkan[basePeriods] + Kijun[basePeriods]) / 2
A = plot(SenkouA[displacement], color=purple, title="SenkouA")
B = plot(SenkouB, color=green, title="SenkouB")
pos = iff(close < SenkouA[displacement], -1,
       iff(close > SenkouB, 1, nz(pos[1], 0)))
possig = iff(reverse and pos == 1, -1,
          iff(reverse and pos == -1, 1, pos))
if (possig == 1)
    strategy.entry("Long", strategy.long)
if (possig == -1)
    strategy.entry("Short", strategy.short)
barcolor(possig == -1 ? red: possig == 1 ? green : blue )
fill(A, B, color=green)