概述
该策略运用三条不同参数设置的平滑移动平均线,实现对价格趋势的判断和跟踪。当短期移动平均线上穿中期线,中期线上穿长期线时做多;当短期移动平均线下穿中期线,中期线下穿长期线时做空。
原理
计算三条平滑移动平均线:长期线长度13周期,位移8周期;中期线长度8周期,位移5周期;短期线长度5周期,位移3周期。均使用收盘价的中值计算。
比较三线的大小关系:当短期线上穿中期线,中期线上穿长期线时,做多;当短期线下穿中期线,中期线下穿长期线时,做空。
可选择反向交易。
绘图显示三条移动平均线。
优势
使用三条移动平均线,能对趋势进行多层判定,提高信号的可靠性。
不同周期线的组合,既考虑了短期动量,也兼顾了中长期趋势。
采用收盘价中值计算移动平均线,能减少假突破。
线的位移设置区分突破的力度,避免 Whipsaws。
可选择反向交易,适应不同市场环境。
风险
多条移动平均线组合使用需要参数优化,不当设置可能降低信号质量。
短线上穿中线不一定代表趋势转折,需要进一步确认。
三线交叉信号可能滞后,需要结合其他指标判断入场时机。
反向交易时,需要警惕止损位置,降低风险。
优化方向
优化移动平均线的长度和位移参数,使其更符合不同周期行情。
增加其他指标过滤,如交易量能量指标,提高信号的可靠性。
优化止损策略,设置合理的止损位置。
结合趋势线和支撑阻力位辅助判断。
总结
该策略通过三条不同长度和位移的移动平均线组合,实现对趋势转折的判断。使用多条移动平均线能提高信号质量,不同周期线的配合兼顾短中长期特征。参数优化、指标过滤、止损策略等都能进一步增强策略的稳定性和实战效果。
策略源码
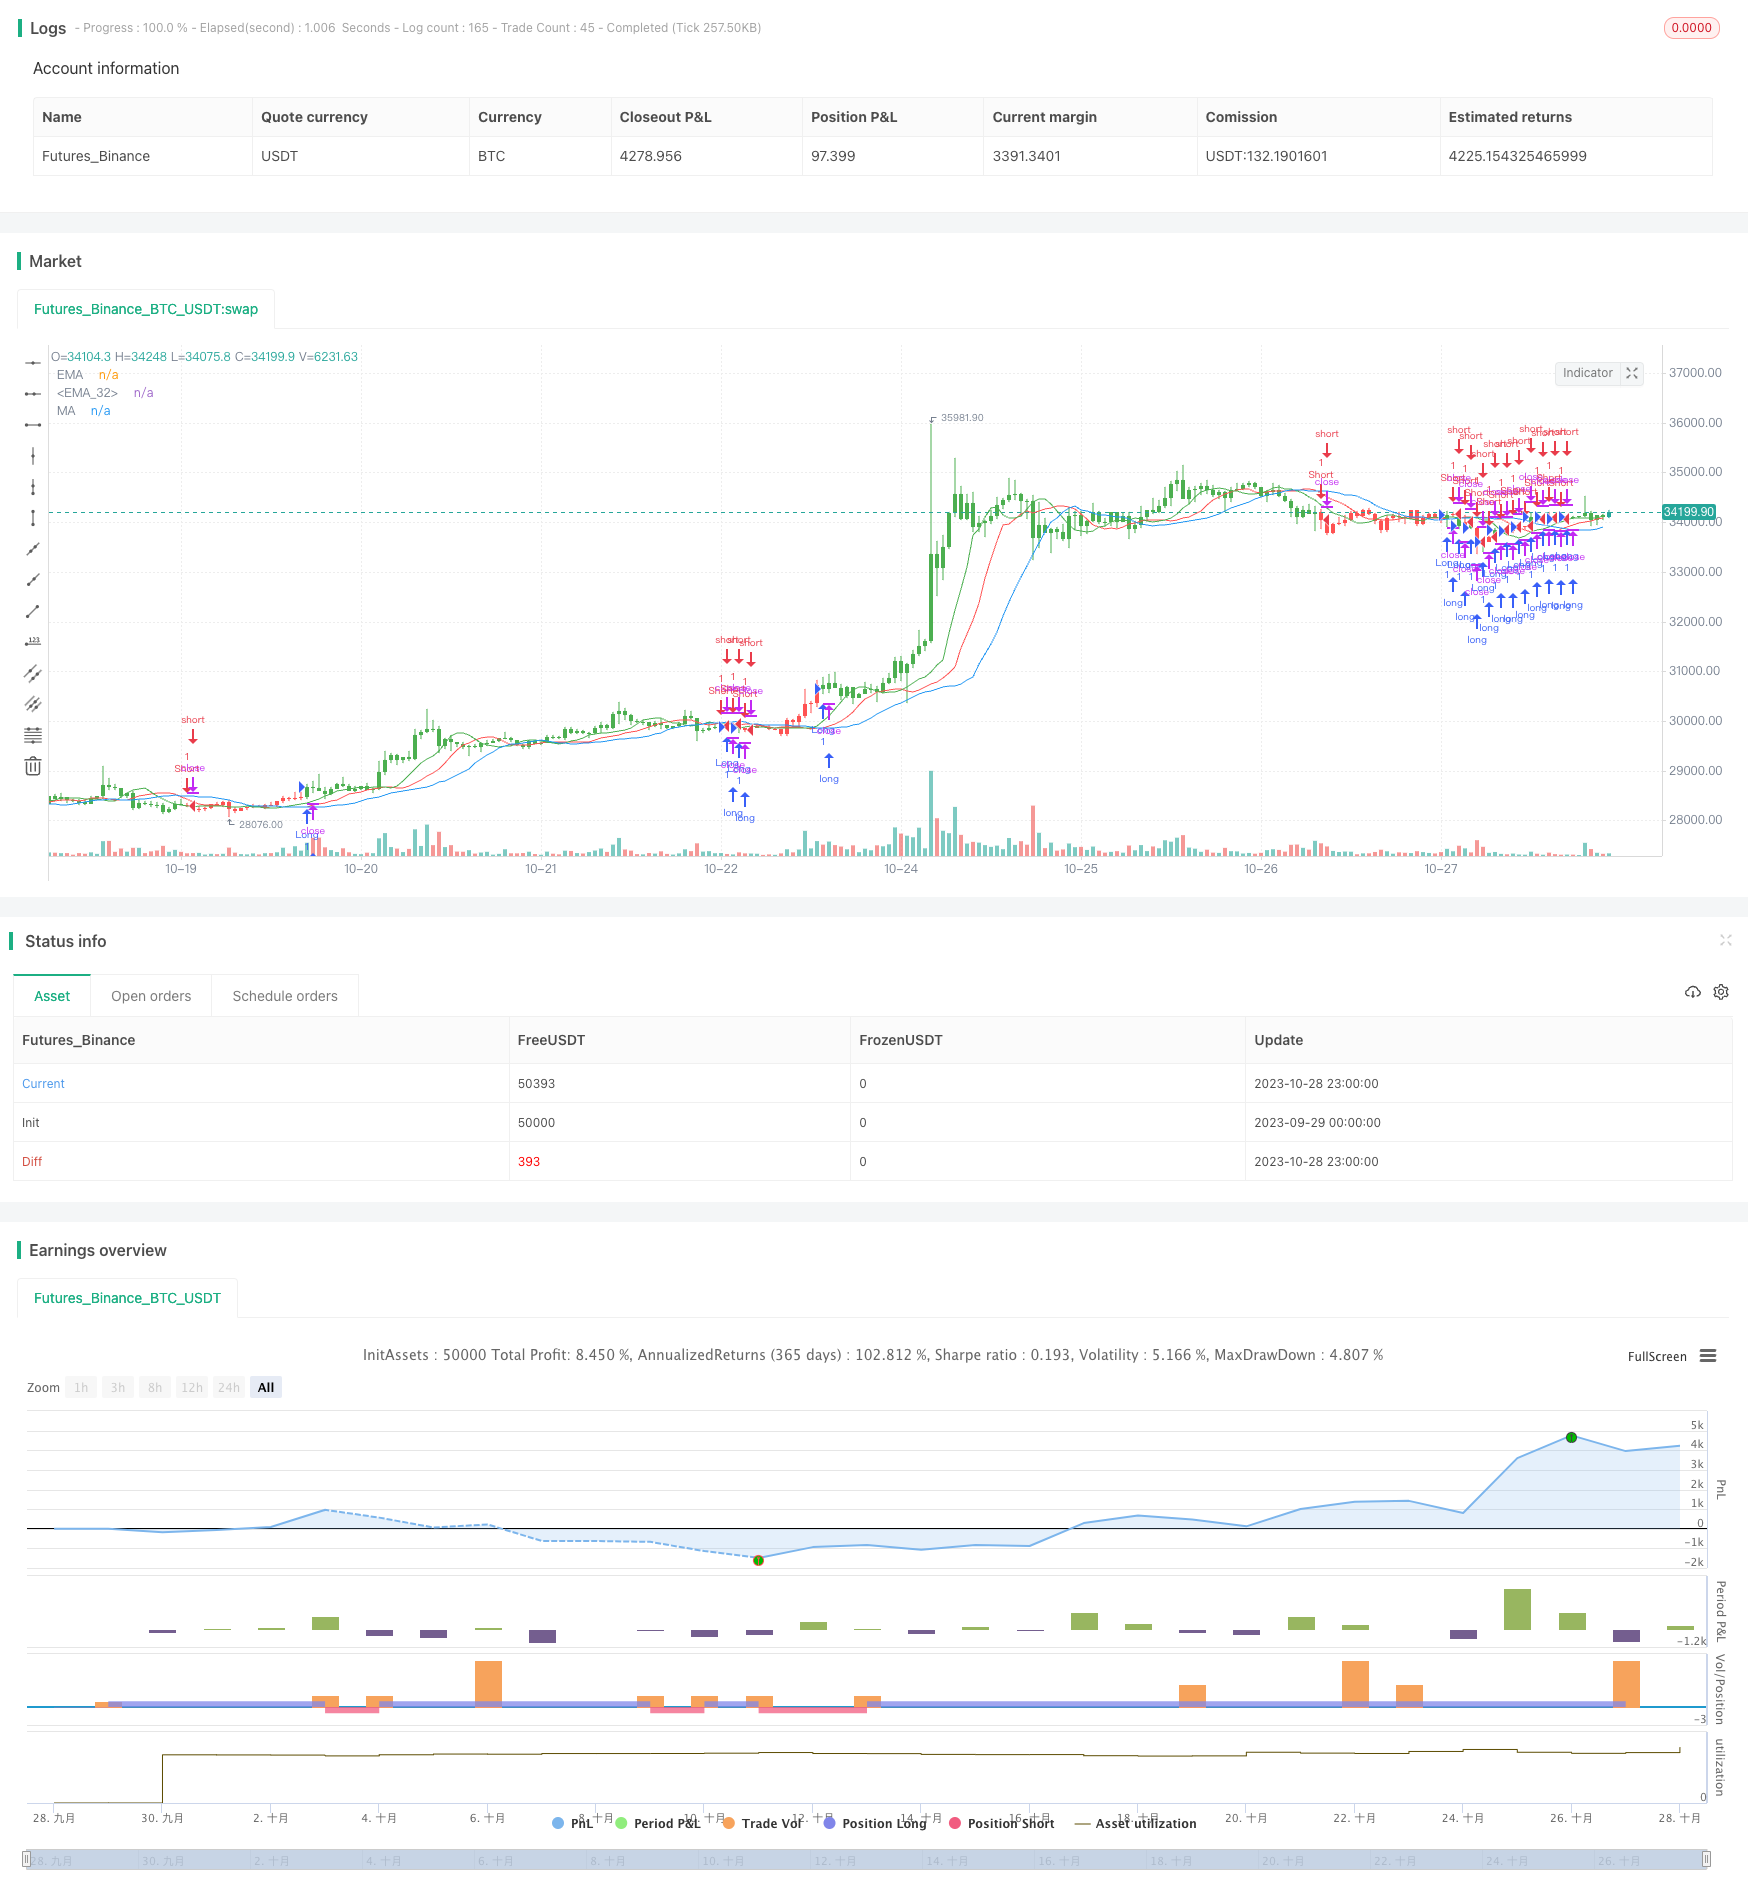
/*backtest
start: 2023-09-29 00:00:00
end: 2023-10-29 00:00:00
period: 1h
basePeriod: 15m
exchanges: [{"eid":"Futures_Binance","currency":"BTC_USDT"}]
*/

//@version=2
////////////////////////////////////////////////////////////
//  Copyright by HPotter v1.0 01/02/2017
// This indicator calculates 3 Moving Averages for default values of
// 13, 8 and 5 days, with displacement 8, 5 and 3 days: Median Price (High+Low/2).
// The most popular method of interpreting a moving average is to compare
// the relationship between a moving average of the security's price with
// the security's price itself (or between several moving averages).
////////////////////////////////////////////////////////////
strategy(title="Bill Williams Averages. 3Lines", shorttitle="3 Lines", overlay = true)
LLength = input(13, minval=1)
MLength = input(8,minval=1)
SLength = input(5,minval=1)
LOffset = input(8,minval=1)
MOffset = input(5,minval=1)
SOffset = input(3,minval=1)
reverse = input(false, title="Trade reverse")
xLSma = sma(hl2, LLength)[LOffset]
xMSma = sma(hl2, MLength)[MOffset]
xSSma = sma(hl2, SLength)[SOffset]
pos = iff(close < xSSma and xSSma < xMSma and xMSma < xLSma, -1,
	   iff(close > xSSma and xSSma > xMSma and xMSma > xLSma, 1, nz(pos[1], 0)))
possig = iff(reverse and pos == 1, -1,
          iff(reverse and pos == -1, 1, pos))
if (possig == 1)
    strategy.entry("Long", strategy.long)
if (possig == -1)
    strategy.entry("Short", strategy.short)
barcolor(possig == -1 ? red: possig == 1 ? green : blue )
plot(xLSma, color=blue, title="MA")
plot(xMSma, color=red, title="EMA")
plot(xSSma, color=green, title="EMA")