概述
布林线与StochRSI动量策略是一种通过结合两个广泛使用的技术指标——布林线和StochRSI来识别金融市场中的潜在买入和卖出机会的策略。该策略旨在捕捉动量转变并利用价格波动。
策略原理
该策略使用以下两个指标:
布林线:布林线由价格图表上的三条线组成:中间线是简单移动平均线(SMA),上线和下线代表远离SMA的标准差。这些线帮助交易者识别价格波动期和潜在反转点。
StochRSI:StochRSI是从相对强度指数(RSI)推导出的动量震荡指标。它衡量RSI在其范围内的相对位置,特别适合识别超买超卖状况。
该策略的参数包括:
布林线长度:决定计算布林线所用的周期数。较长的长度能捕捉到长期趋势,较短的长度则对短期价格变动更敏感。
布林线标准差:通过调整标准差来扩大或缩小布林线的宽度。较高的标准差带来更宽的布林线,反映价格波动加大。
StochRSI长度:计算StochRSI所用的周期数。较短的长度使该指标对最近价格变化更敏感。
K周期和D周期:这些参数控制StochRSI指标的平滑度和信号生成,影响其敏感度。
交易逻辑:
根据选择的长度和标准差计算布林线。上线和下线包裹SMA,提供关于价格波动的信息。
使用指定的长度计算StochRSI,生成在0到100间震荡的K线和D线。此指标有助于识别潜在的动量转变。
主要的买入条件是StochRSI的K线上穿D线,且收盘价低于布林线下轨。这表示潜在的看涨反转,位于低波动范围,表示买入机会。
主要的卖出条件是StochRSI的K线下穿D线,且收盘价高于布林线上轨。这表示高波动范围内的潜在看跌反转,为卖出信号。
当买入或卖出条件满足时,根据预期市场方向做多或做空。
可选的将买入和卖出信号可视化为绿色上三角和红色下三角。
该策略同时在图表上绘制布林线、StochRSI的K线和D线以备参考。
优势分析
该策略结合两个广为使用的技术指标,综合其优势,提高成功率。
布林线捕捉价格波动趋势,StochRSI抓住反转机会,两者配合提高胜率。
通过参数优化,能适应不同交易风格和市场环境。
可视化的买卖信号,形成清晰的入场Timing。
同时做多做空,充分利用双向行情。
系统化且易于回测,可评估策略表现。
风险分析
如其他技术策略,效果依赖参数优化,需要反复测试。
交易费用和滑点影响盈利能力,需考量于回测中。
布林线带宽度优化非常关键,过宽或过窄都影响准确率。
行情剧烈波动时,指标发出错误信号的可能性加大。
需关注并控制每次交易的止损比例,风险管理非常重要。
优化方向
优化布林线和StochRSI的参数,使之更符合目标品种和时间周期。
加入移动止损或仓位控制,有助于控制单笔交易风险。
结合其他指标过滤假信号,如MACD、KDJ等,提升准确率。
增加机器学习模型判断买入卖出信号的可靠性。
加入量能指标,避免逆势交易。
总结
该策略提供了一种系统化的方法,使用布林线和StochRSI指标来获利于动量转变。通过参数调整,严格回测,并控制风险,它具有很强的实用价值。我们将继续优化该策略,使其成为一个可靠的量化交易系统。
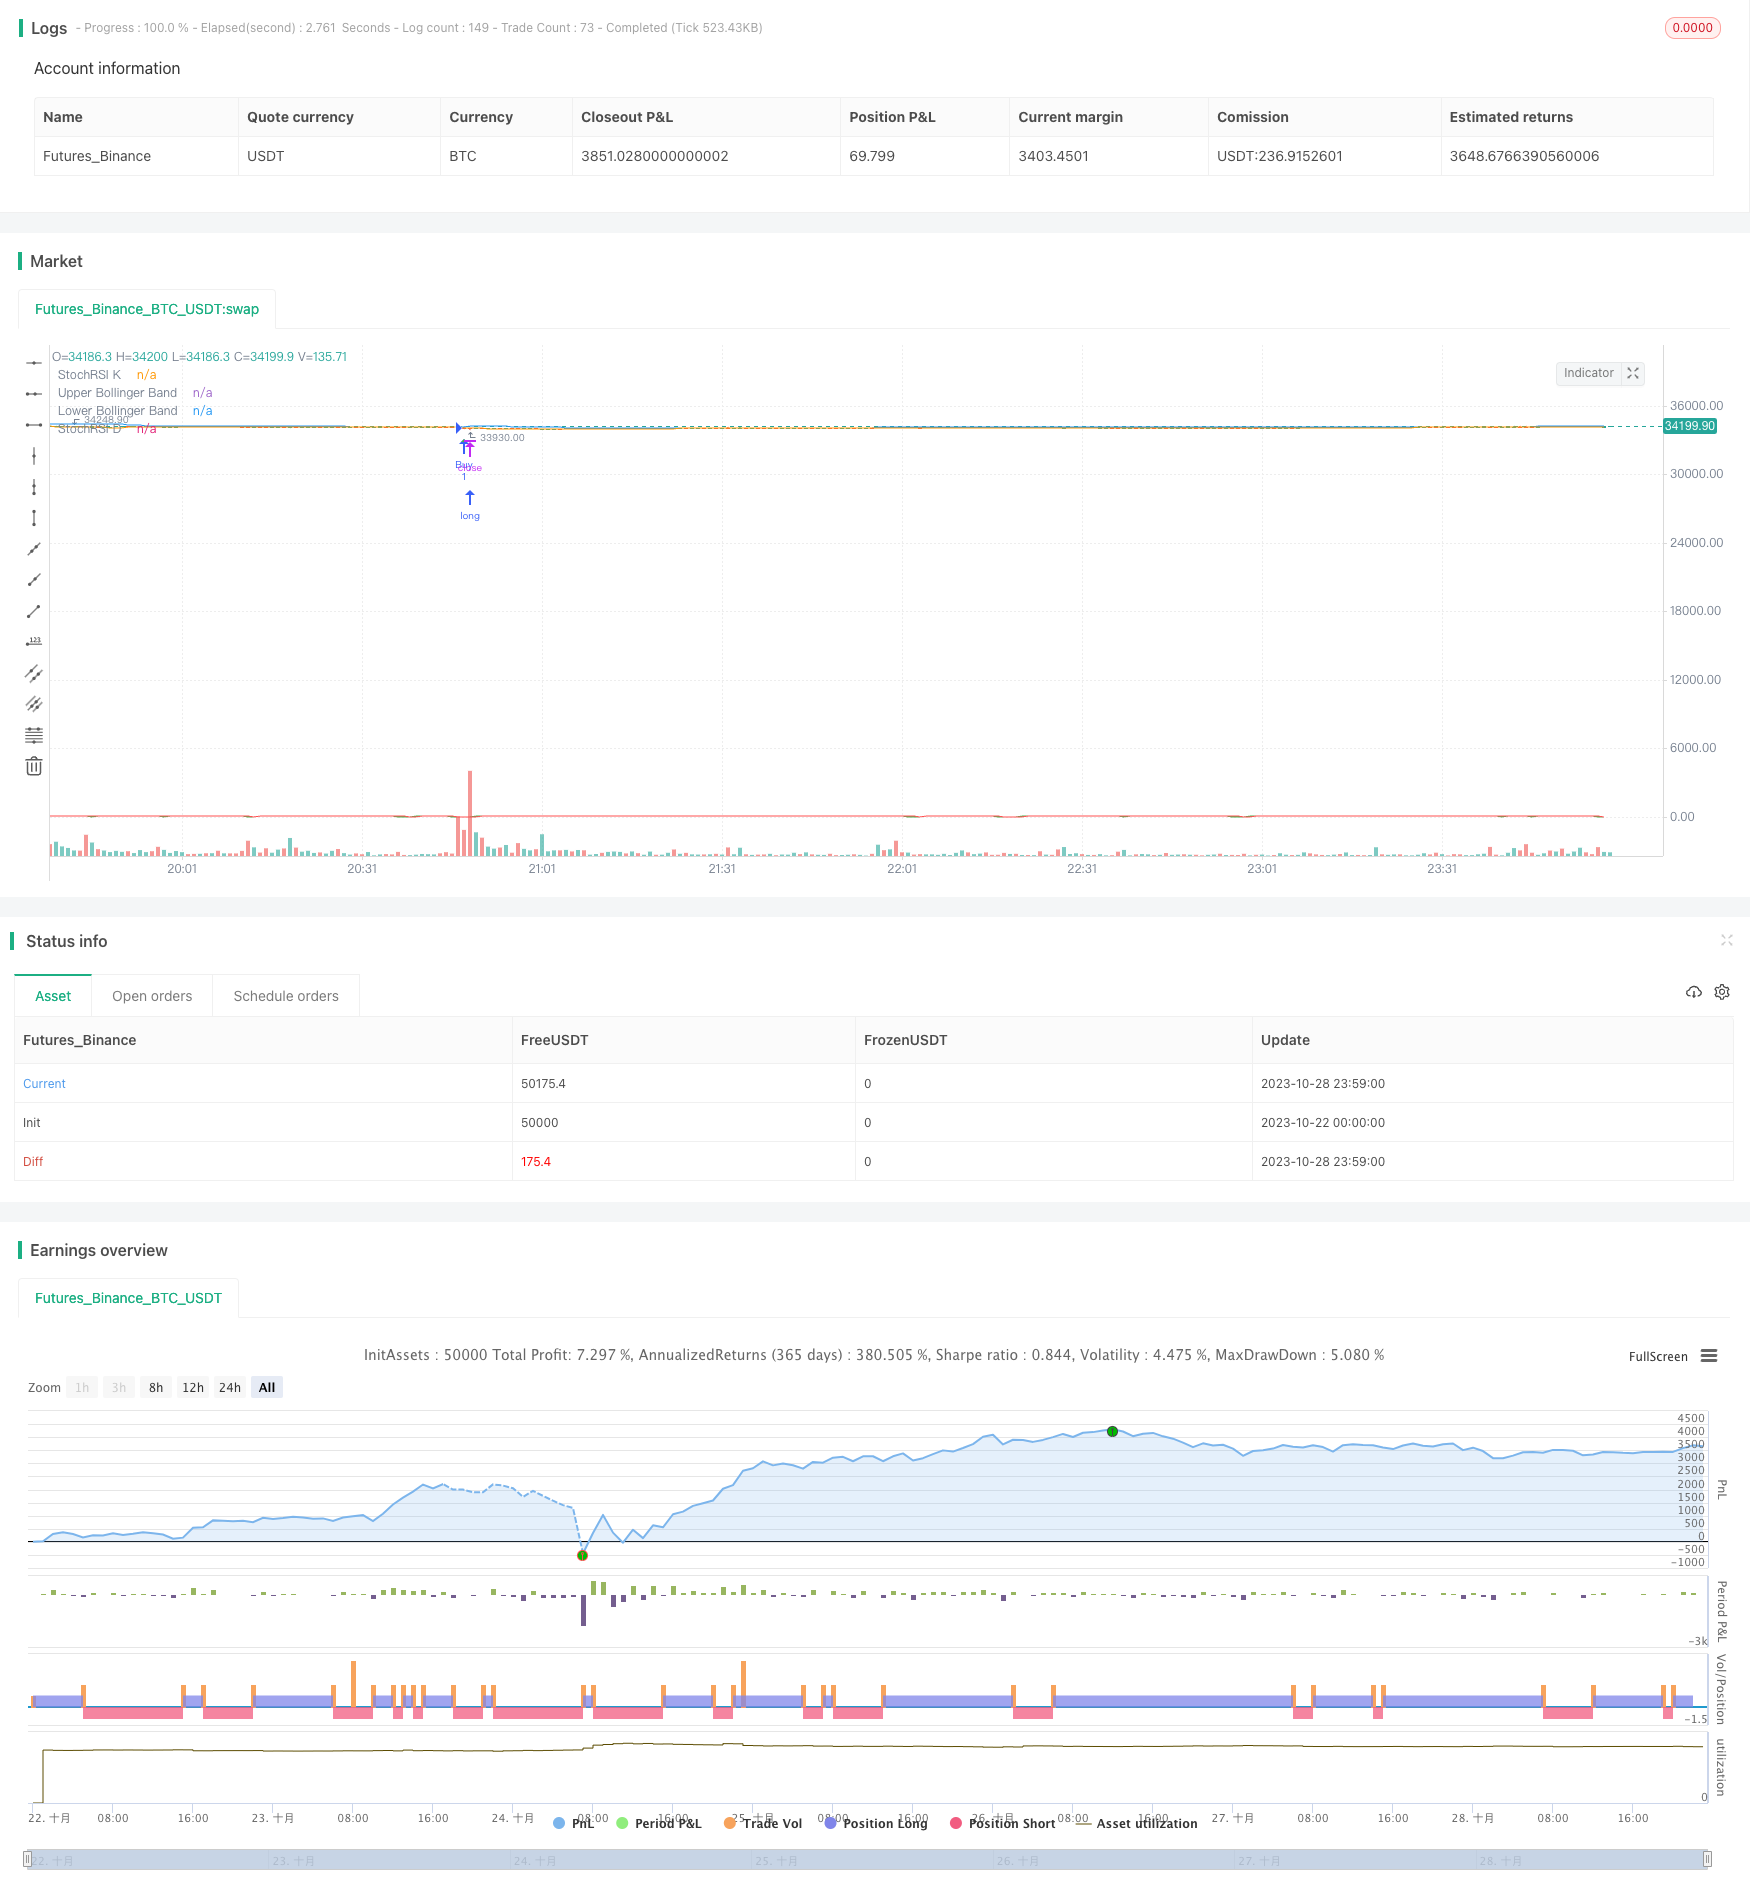
/*backtest
start: 2023-10-22 00:00:00
end: 2023-10-29 00:00:00
period: 1m
basePeriod: 1m
exchanges: [{"eid":"Futures_Binance","currency":"BTC_USDT"}]
*/

//@version=5
strategy("My Strategy with Bollinger Bands and StochRSI", overlay=true)

// Define your Bollinger Bands parameters
bollinger_length = input.int(20, title="Bollinger Bands Length")
bollinger_dev = input.float(2, title="Bollinger Bands Deviation")

// Calculate Bollinger Bands
sma = ta.sma(close, bollinger_length)
dev = bollinger_dev * ta.stdev(close, bollinger_length)

upper_band = sma + dev
lower_band = sma - dev

// Define your StochRSI parameters
stoch_length = input.int(14, title="StochRSI Length")
k_period = input.int(3, title="K Period")
d_period = input.int(3, title="D Period")

// Calculate StochRSI
rsi = ta.rsi(close, stoch_length)
k = ta.sma(ta.stoch(rsi, rsi, rsi, k_period), k_period)
d = ta.sma(k, d_period)

// Define your buy and sell conditions
buy_condition = ta.crossover(k, d) and close < lower_band
sell_condition = ta.crossunder(k, d) and close > upper_band

// Place orders based on the conditions
if (buy_condition)
    strategy.entry("Buy", strategy.long)

if (sell_condition)
    strategy.entry("Sell", strategy.short)

// Optional: Plot buy and sell signals on the chart
plotshape(buy_condition, color=color.green, style=shape.triangleup, location=location.belowbar, size=size.small)
plotshape(sell_condition, color=color.red, style=shape.triangledown, location=location.abovebar, size=size.small)

// Plot Bollinger Bands and StochRSI on the chart
plot(upper_band, title="Upper Bollinger Band", color=color.blue)
plot(lower_band, title="Lower Bollinger Band", color=color.orange)
plot(k, title="StochRSI K", color=color.green)
plot(d, title="StochRSI D", color=color.red)