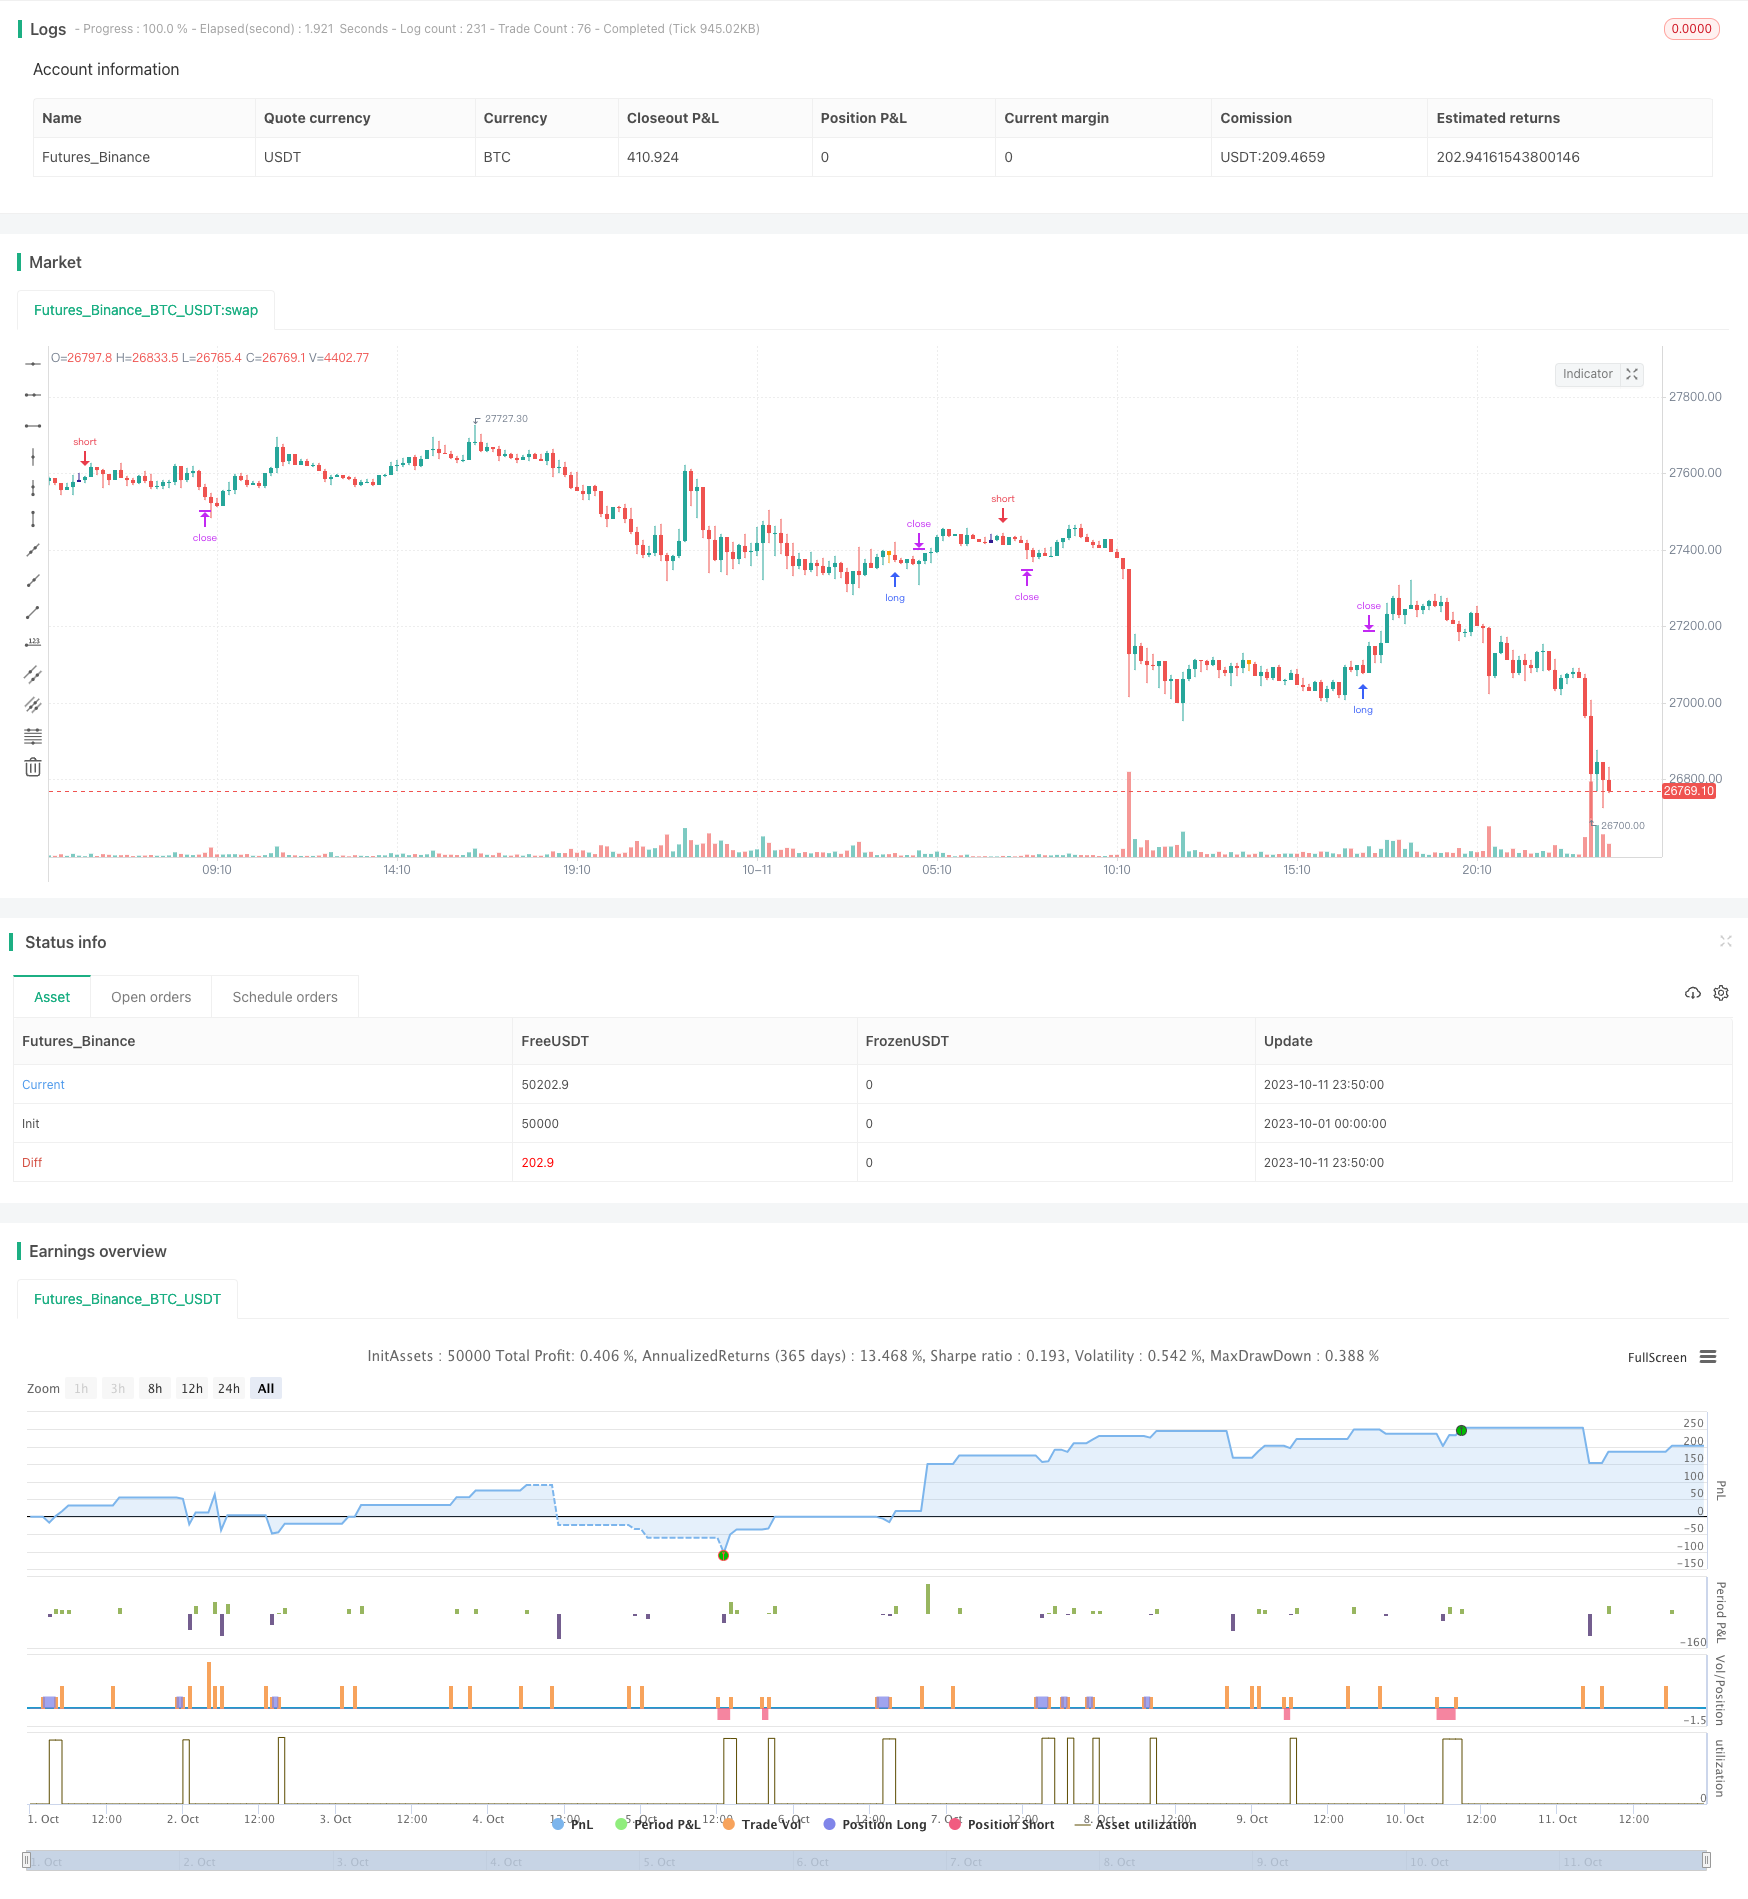
概述
影子交易策略通过识别K线上出现长下影线或者长上影线的K线,来判断市场可能反转的时机。当识别到长下影线时,做多;当识别到长上影线时,做空。本策略主要利用长影线反转的普遍规律来进行交易。
策略原理
影子交易策略的核心逻辑是识别K线中出现的长上影线和长下影线。策略通过计算K线实体大小corpo和影线大小pinnaL、pinnaS,当影线大小大于实体大小的一定倍数时,认为可能出现反转机会。具体来说,策略包含以下步骤:
- 计算K线实体大小
corpo,即开盘价和收盘价的差价的绝对值。 - 计算上影线
pinnaL,即最高价和收盘价的差价的绝对值。 - 计算下影线
pinnaS,即最低价和收盘价的差价的绝对值。 - 判断上影线是否大于实体的一定倍数,通过
pinnaL > (corpo*size),size是可调参数。 - 判断下影线是否大于实体的一定倍数,通过
pinnaS > (corpo*size)。 - 如果上述条件成立,则在影线出现的K线收盘时,做空(长上影线)或做多(长下影线)。
此外,策略还判断K线波动大小dim是否大于最小值min,以过滤除去波动太小的无趣的K线。进场后设置止损和止盈退出。
策略优势分析
- 利用影线反转的普遍规律,是一种较为可靠的交易信号
- 策略逻辑简单清晰,参数设置直观,易于掌握
- 可通过调整参数控制进场频率,灵活控制交易风险
- 结合趋势、支持阻力等因素可进一步优化
风险及解决方案
- 长影线反转失败,未能反转的概率存在,可通过调整参数降低风险
- 需要combination with 趋势判断,避免逆势操作
- 针对具体品种参数需要优化,不同品种参数可不一样
- 可结合其他指标过滤进场机会,降低获利率以换取胜率提升
策略优化方向
- 根据不同品种参数进行优化,提高策略稳定性
- 结合移动均线等指标判断趋势,避免逆势操作
- 增加对突破前期高点或低点的判断,提高策略的有效性
- 优化和调整止损止盈位置,在保持盈利的前提下最大限度降低亏损风险
- 优化仓位控制,不同品种可设置不同仓位
总结
影子交易策略是一种较为简单实用的短线交易策略。它利用长影线反转的普遍规律产生交易信号。该策略逻辑简单,易于实现,可根据品种差异进行调整优化。同时,影子交易策略也存在一定的风险,需要结合趋势和其他因素进行过滤,降低错误交易概率。如果使用得当,影子交易策略可以成为量化交易体系中的一个有效组成部分。
策略源码
/*backtest
start: 2023-10-01 00:00:00
end: 2023-10-11 23:59:59
period: 10m
basePeriod: 1m
exchanges: [{"eid":"Futures_Binance","currency":"BTC_USDT"}]
*/

//@version=2
strategy("Shadow Trading", overlay=true)

size = input(1,type=float)
pinnaL = abs(high - close)
pinnaS = abs(low-close)
scarto = input(title="Tail Tollerance", type=float, defval=0.0018)
corpo = abs(close - open)
dim = abs(high-low)
min = input(0.001)
shortE = (open + dim)

longE = (open - dim)
barcolor(dim > min and (close > open) and (pinnaL > (corpo*size)) and (open-low<scarto) ? navy : na)

longcond = (dim > min) and (close > open) and (pinnaL > (corpo*size)) and (open-low<scarto)
minimo=low+scarto
massimo=high+scarto
barcolor( dim > min and(close < open) and (pinnaS > (corpo*size)) and (high-open<scarto) ? orange: na)
shortcond = (dim > min) and(close < open) and (pinnaS > (corpo*size)) and (high-open<scarto)
//plot(shortE)
//plot(longE)
//plot(open)
ss= shortcond ? close : na
ll=longcond ? close : na
offset= input(0.00000)

DayClose = 2
closup = barssince(change(strategy.opentrades)>0)  >= DayClose

longCondition = (close > open) and (pinnaL > (corpo*size)) and (open-low<scarto)

crossFlag = longcond ? 1 : 0
monthBegin = input(1,maxval = 12)
yearBegin = input(2013, maxval= 2015, minval=2000)

if(month(time)>monthBegin and year(time) >yearBegin)
    if (longcond)
        strategy.entry("short", strategy.short, stop = low - offset)
//strategy.close("short", when = closup)
shortCondition = (close < open) and (pinnaS > (corpo*size)) and (high-open<scarto)
if(month(time)>monthBegin and year(time) >yearBegin)
    if (shortcond)
        strategy.entry("long", strategy.long, stop = high + offset)
//strategy.close("long", when = closup)

Target =  input(20)
Stop = input(70) //- 2
Trailing = input(0)
CQ = 100

TPP = (Target > 0) ? Target*10: na
SLP = (Stop > 0) ? Stop*10 : na
TSP = (Trailing > 0) ? Trailing : na

strategy.exit("Close Long", "long", qty_percent=CQ, profit=TPP, loss=SLP, trail_points=TSP)
strategy.exit("Close Short", "short", qty_percent=CQ, profit=TPP, loss=SLP, trail_points=TSP)