概述
该策略基于Karobein均值回归指标和价格动量。它利用价格动量辅助指标进行趋势判断,并结合Karobein均值回归指标进行具体入场。该策略适用于中长线交易。
策略原理
该策略首先通过计算不同周期价格的变化率,得到价格动量指标。当价格动量指标上穿动态阈值线时产生多头信号,下穿时产生空头信号。
然后结合Karobein均值回归指标确定具体入场时机。Karobein均值回归指标基于价格的均线回归性质计算得到,它能反映价格的波动加速度和路径。该指标具有内在的正弦波特征,有助于判断价格走势方向和时间节点。
当价格动量指标发出信号时,若Karobein均值回归指标处于对应的方向区域,则产生入场信号。
策略优势
该策略综合考虑了价格动量和均值回归两个因素,具有较强的趋势判断能力。
Karobein均值回归指标可准确定位价格转折点位,提高入场时机精确度。
可通过参数调整自由控制持仓周期,适用于不同时间周期。
可实时调整动态阈值参数,对市场变化进行自适应。
策略风险
该策略为趋势跟踪策略,在震荡趋势中容易被套。
Karobein均值回归指标存在一定程度的滞后,可能错过价格转折节点。
需关注持仓周期参数设置,过长持仓时间可能导致亏损扩大。
应适当调整动态阈值参数,不宜设置过大,否则将错过进场时机。
对应风险的解决方法:
可通过趋势判断指标提前判断震荡来临,及时平仓止损。
选择合适周期Karobein均值回归指标,不能过于滞后。
测试不同持仓时间参数,选择适合自己的持仓时间。
调整动态阈值范围,不能过宽以避免漏入场点。
策略优化方向
可测试不同价格动量计算周期,优化参数。
可加入波动率指标,判断震荡来临,可设置止损。
可优化Karobein均值回归指标参数,使其更加灵敏。
可加入附加过滤条件,如交易量指标等,提高信号质量。
可采用机器学习算法动态优化参数。
总结
本策略综合考虑价格动量因素和均值回归因素,具有较强的趋势判断和信号产生能力。可通过参数调整自适应不同市场环境。下一步可从入场时机、止损方面进行进一步优化,使策略更加稳定和强大。该策略值得进一步研究和应用。
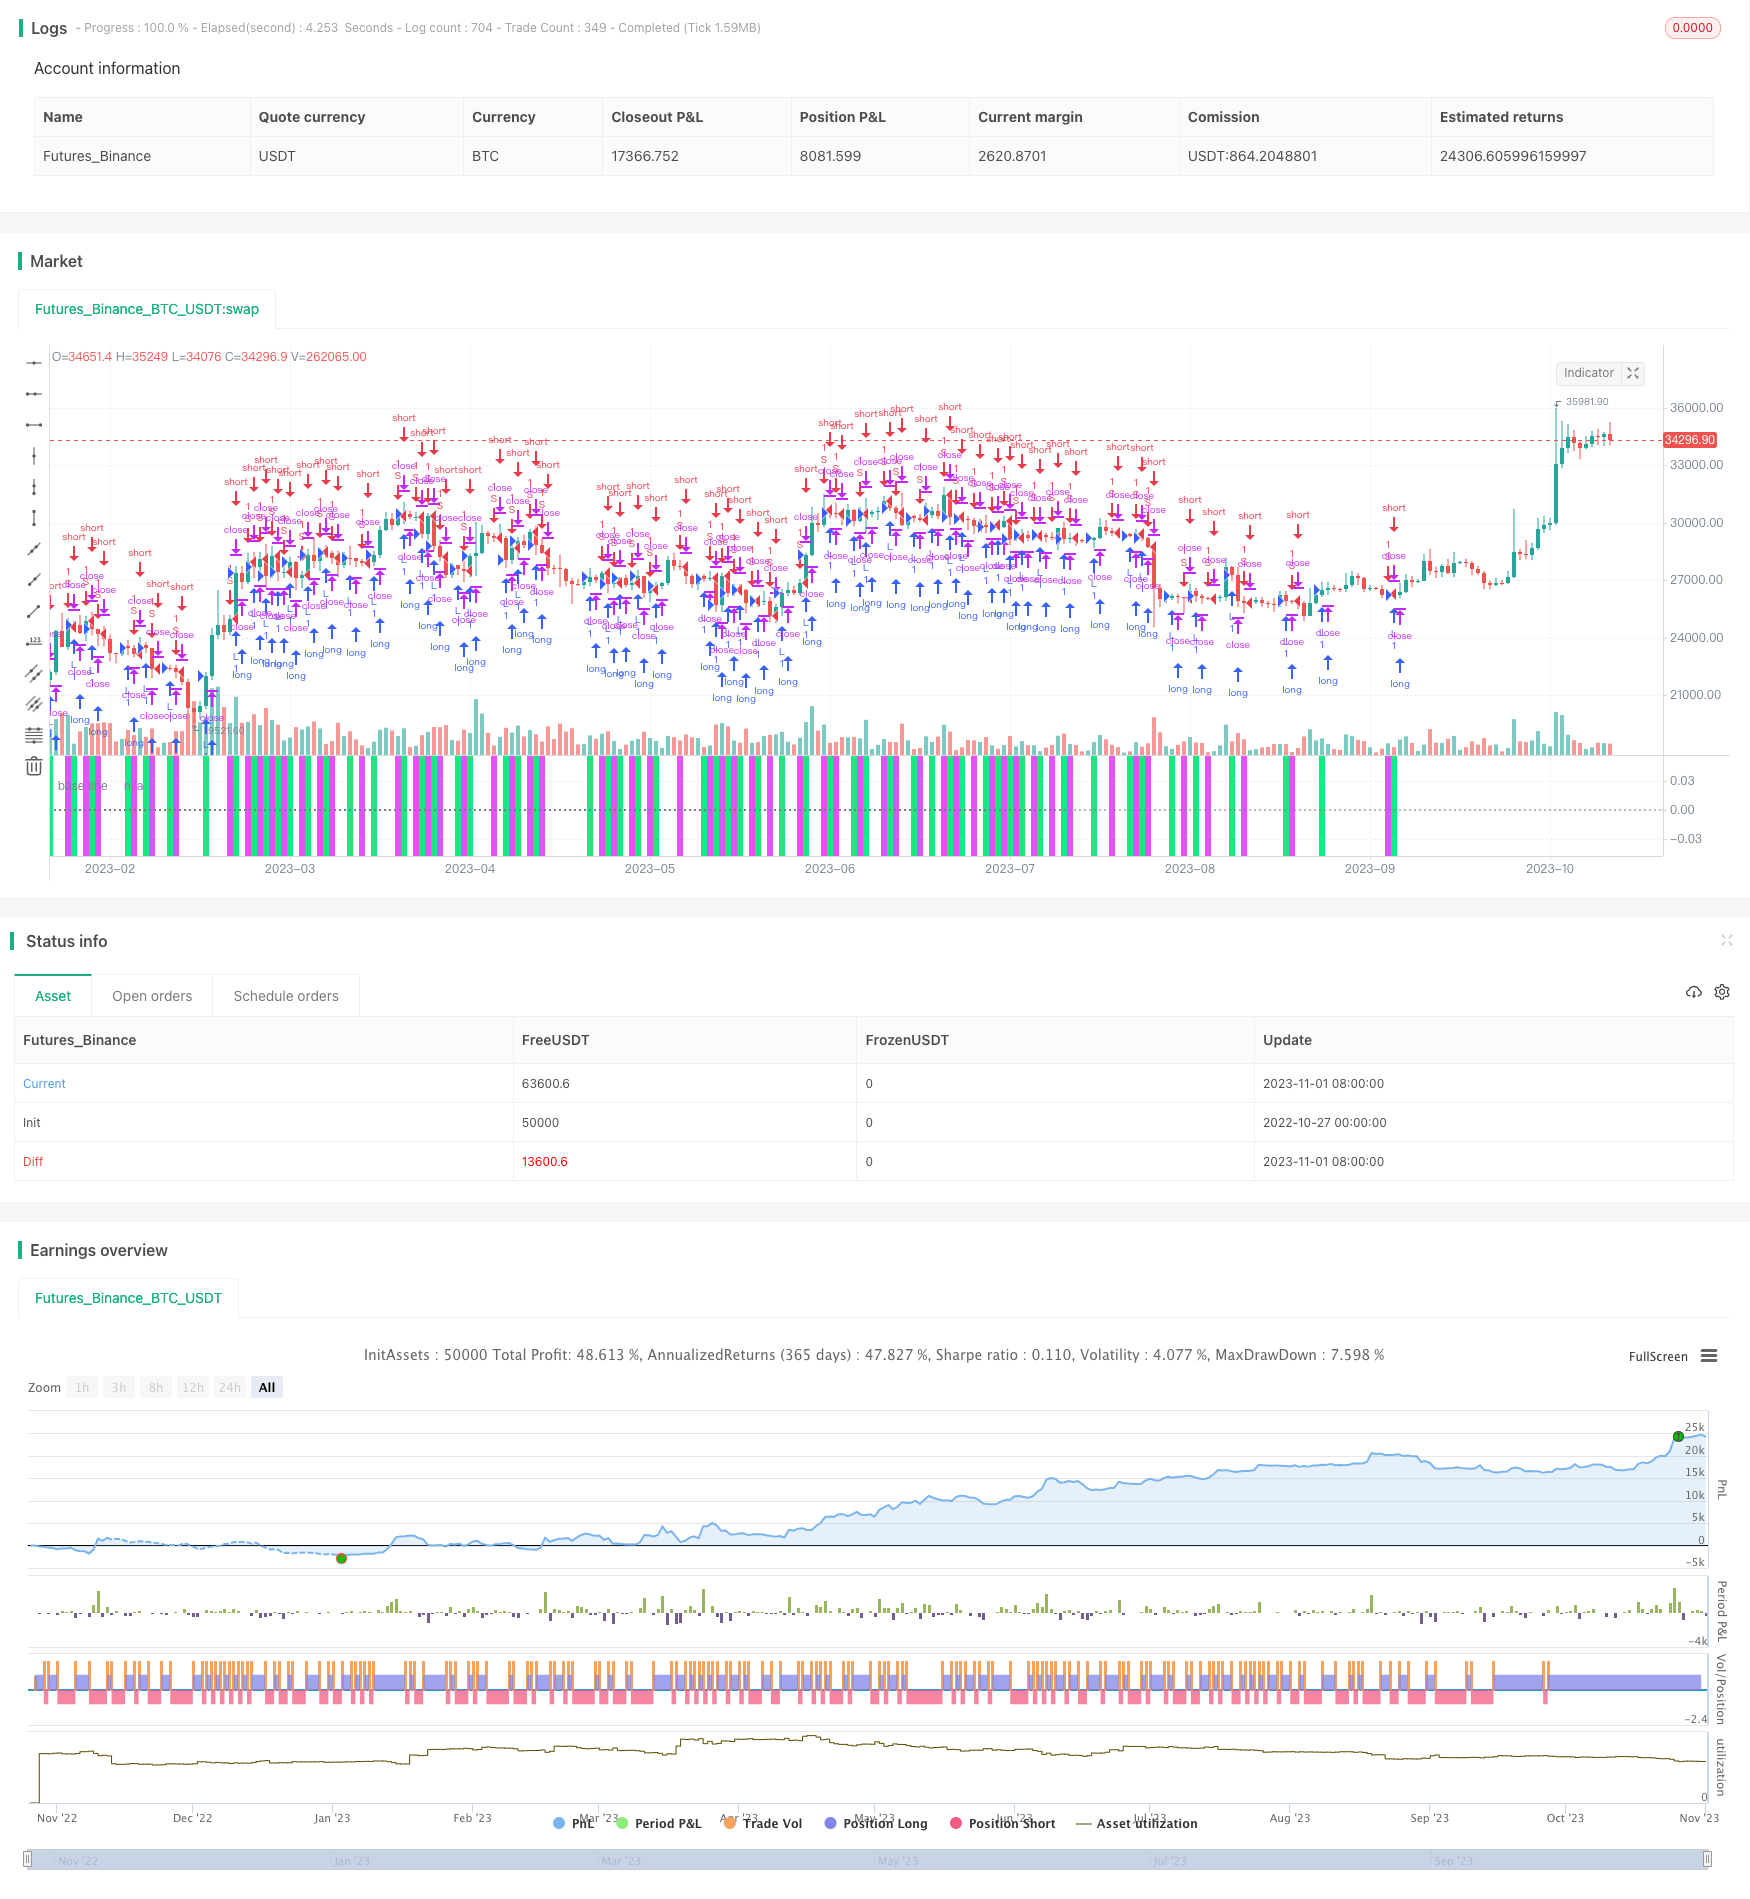
/*backtest
start: 2022-10-27 00:00:00
end: 2023-11-02 00:00:00
period: 1d
basePeriod: 1h
exchanges: [{"eid":"Futures_Binance","currency":"BTC_USDT"}]
*/

//@version=4
// author: capissimo
strategy("Normalized Vector Strategy, ver.3 (sc)", precision=2, overlay=false)
// This is a scaled Normalized Vector Strategy with a Karobein Oscillator
// original: Drkhodakarami (https://www.tradingview.com/script/Fxv2xFWe-Normalized-Vector-Strategy-By-Drkhodakarami-Opensource/)

// Repainting: in general there two types of repainting:
// * when the last candle is constantly being redrawn
// * when the indicator draws a different configuration after it has been deactivated/reactivated, i.e. refreshed

// The former is a natural behaviour, which presents a constant source of frustration,
// when a signal directly depends on the current market situation and can be overcome
// with various indirect techniques like divergence.

// The latter suggests a flaw in the indicator design.
// Unfortunately, the Normalized Vector Strategy is repainting in the latter sense, although being
// really promising. Would be nice if our community suggests a solution to this problem ))

// This strat consistently performs with high accuracy, showing up to 96% scores
// Here are some of the best parameters:
// TF     Lookback   Performance (ca.)
// 1m     13         92%
// 3m     34         92%
// 5m     85         92%
// 15m    210        90%
// 30m    360        89%
// 1H     1440,720   94%, 87%

// The Karobein Oscillator has an intrinsic sinusoidal behaviour that helps in determining direction and timing.
// It does not repaint.
// original: alexgrover (https://www.tradingview.com/script/JiNi0f62-Karobein-Oscillator/)

scaleMinimax(X, p, min, max) =>
    hi = highest(X, p), lo = lowest(X, p)
    (max - min) * (X - lo)/(hi - lo) + min

price    = input(close,  "Price Data")
tf       = input(34,     "Timeframe", minval=1, maxval=1440)
thresh   = input(14.,    "Threshold", minval=.1, step=.1)
div      = input(1000000,"Divisor", options=[1,10,100,1000,10000,100000,1000000,10000000,100000000])
showVol  = input(false,  "Volume")
useold   = input(true,   "Use Old System")

lime  = color.new(color.lime, 10), fuchsia = color.new(color.fuchsia, 10),
black = color.new(color.black, 100), gray = color.new(color.gray, 50)

vol  = useold ? security(syminfo.tickerid, tostring(tf), volume, barmerge.gaps_off, barmerge.lookahead_on)
              : security(syminfo.tickerid, tostring(tf), volume)
obv  = cum(change(price) > 0 ? vol : change(price) < 0 ? -vol : 0*vol)
prix = showVol ? obv : price

getdiff(prc, tf) =>
    prev  = useold ? security(syminfo.tickerid, tostring(tf), prc[1], barmerge.gaps_off, barmerge.lookahead_on) :
                     security(syminfo.tickerid, tostring(tf), prc[1])
    curr  = useold ? security(syminfo.tickerid, tostring(tf), prc, barmerge.gaps_off, barmerge.lookahead_on) :
                     security(syminfo.tickerid, tostring(tf), prc)
    (curr/prev) - 1

p  = getdiff(prix, tf)
up = thresh/div, dn = -thresh/div
longCondition  = crossover(p, up)
shortCondition = crossunder(p, dn)

bg = longCondition ? lime : shortCondition ? fuchsia : black
cl = p > up ? color.green : p < dn ? color.red : color.silver

bgcolor(bg, editable=false)
plot(scaleMinimax(up, 2500, -1, 1), color=lime, editable=false, transp=0)
hline(0, linestyle=hline.style_dotted, title="base line", color=gray, editable=false)
plot(scaleMinimax(dn, 2500, -1, 1), color=fuchsia, editable=false, transp=0)
plot(scaleMinimax(p, 2500, -1, 1), color=cl, style=plot.style_histogram, transp=70, editable=false)
plot(scaleMinimax(p, 2500, -1, 1), color=cl, style=plot.style_linebr, title="prediction", transp=0, editable=false)

strategy.entry("L", true, 1, when=longCondition)
strategy.entry("S", false, 1, when=shortCondition)

alertcondition(longCondition, title='Long', message='Long Signal!')
alertcondition(shortCondition, title='Short', message='Short Signal!')

//*** Karobein Oscillator
per  = input(8, "Karobein Osc Lookback")

prix2  = ema(price, per)
a = ema(prix2 < prix2[1] ? prix2/prix2[1] : 0, per)
b = ema(prix2 > prix2[1] ? prix2/prix2[1] : 0, per)
c = (prix2/prix2[1])/(prix2/prix2[1] + b)
d = 2*((prix2/prix2[1])/(prix2/prix2[1] + c*a)) - 1

plot(scaleMinimax(d, 2500, -1, 1), color=color.orange, transp=0)