概述
该策略综合运用多种技术指标识别趋势方向,在趋势发生动量突破时进行追踪,追求获得超额收益。
策略原理
使用Donchian通道判断整体趋势方向。当价格突破该通道时,确认趋势发生转变。
Hull移动平均线辅助判断趋势方向。该指标对价格变化敏感,可提前发现趋势转折。
半轨道系统发出买入和卖出信号。该系统基于价格通道和平均真实波动范围,可避免假突破。
当Donchian通道、Hull指标和半轨道系统同时发出信号时,判断趋势发生有力的动量突破,此时进入场内。
平仓条件:当上述指标发出反向信号时,判定趋势反转,立即止损退出。
优势分析
多指标组合,判断力更强。Donchian通道判定基本面,Hull指标和半轨道判定细节,把握趋势精确转折点。
动量突破参与,追求超额收益。只在趋势发生强力突破时入场,避免在震荡中被套。
严格止损,保障资金安全。一旦指标发出反向信号,立即止损,避免亏损扩大。
参数调节灵活,适应各类市场。可调整通道长度、波动区间等参数,针对不同周期进行优化。
易于理解和实现,新手也能掌握。指标和条件组合简单明了,容易编程实现。
风险分析
错过趋势初期机会。进入时机较晚,初期涨幅无法捕捉。
突破失败回调损失。入场后可能出现突破失败和反转,造成损失。
指标发出错误信号。由于参数设置不当,指标判断可能发生错误。
交易次数有限。仅在明确趋势突破时才入场,年化交易次数有限。
优化方向
优化参数组合。testing不同参数找出最佳组合。
增加止损线性回撤条件。避免止损过早,错过趋势机会。
增加其它指标过滤。如MACD,KDJ等辅助判断,减少错误信号。
优化交易时间段。不同时间段参数可进行优化。
扩大资金利用效率。通过杠杆、定投等方式提升资金使用效率。
总结
本策略综合多种指标判断趋势发生动量突破的时机,通过追踪已形成的趋势实现超额收益。严格的止损机制控制风险,灵活的参数调节适应不同市场环境。虽然交易频率较低,但每个交易都力求获得高回报。通过参数优化、辅助指标引入等方式,本策略可获得持续改进。
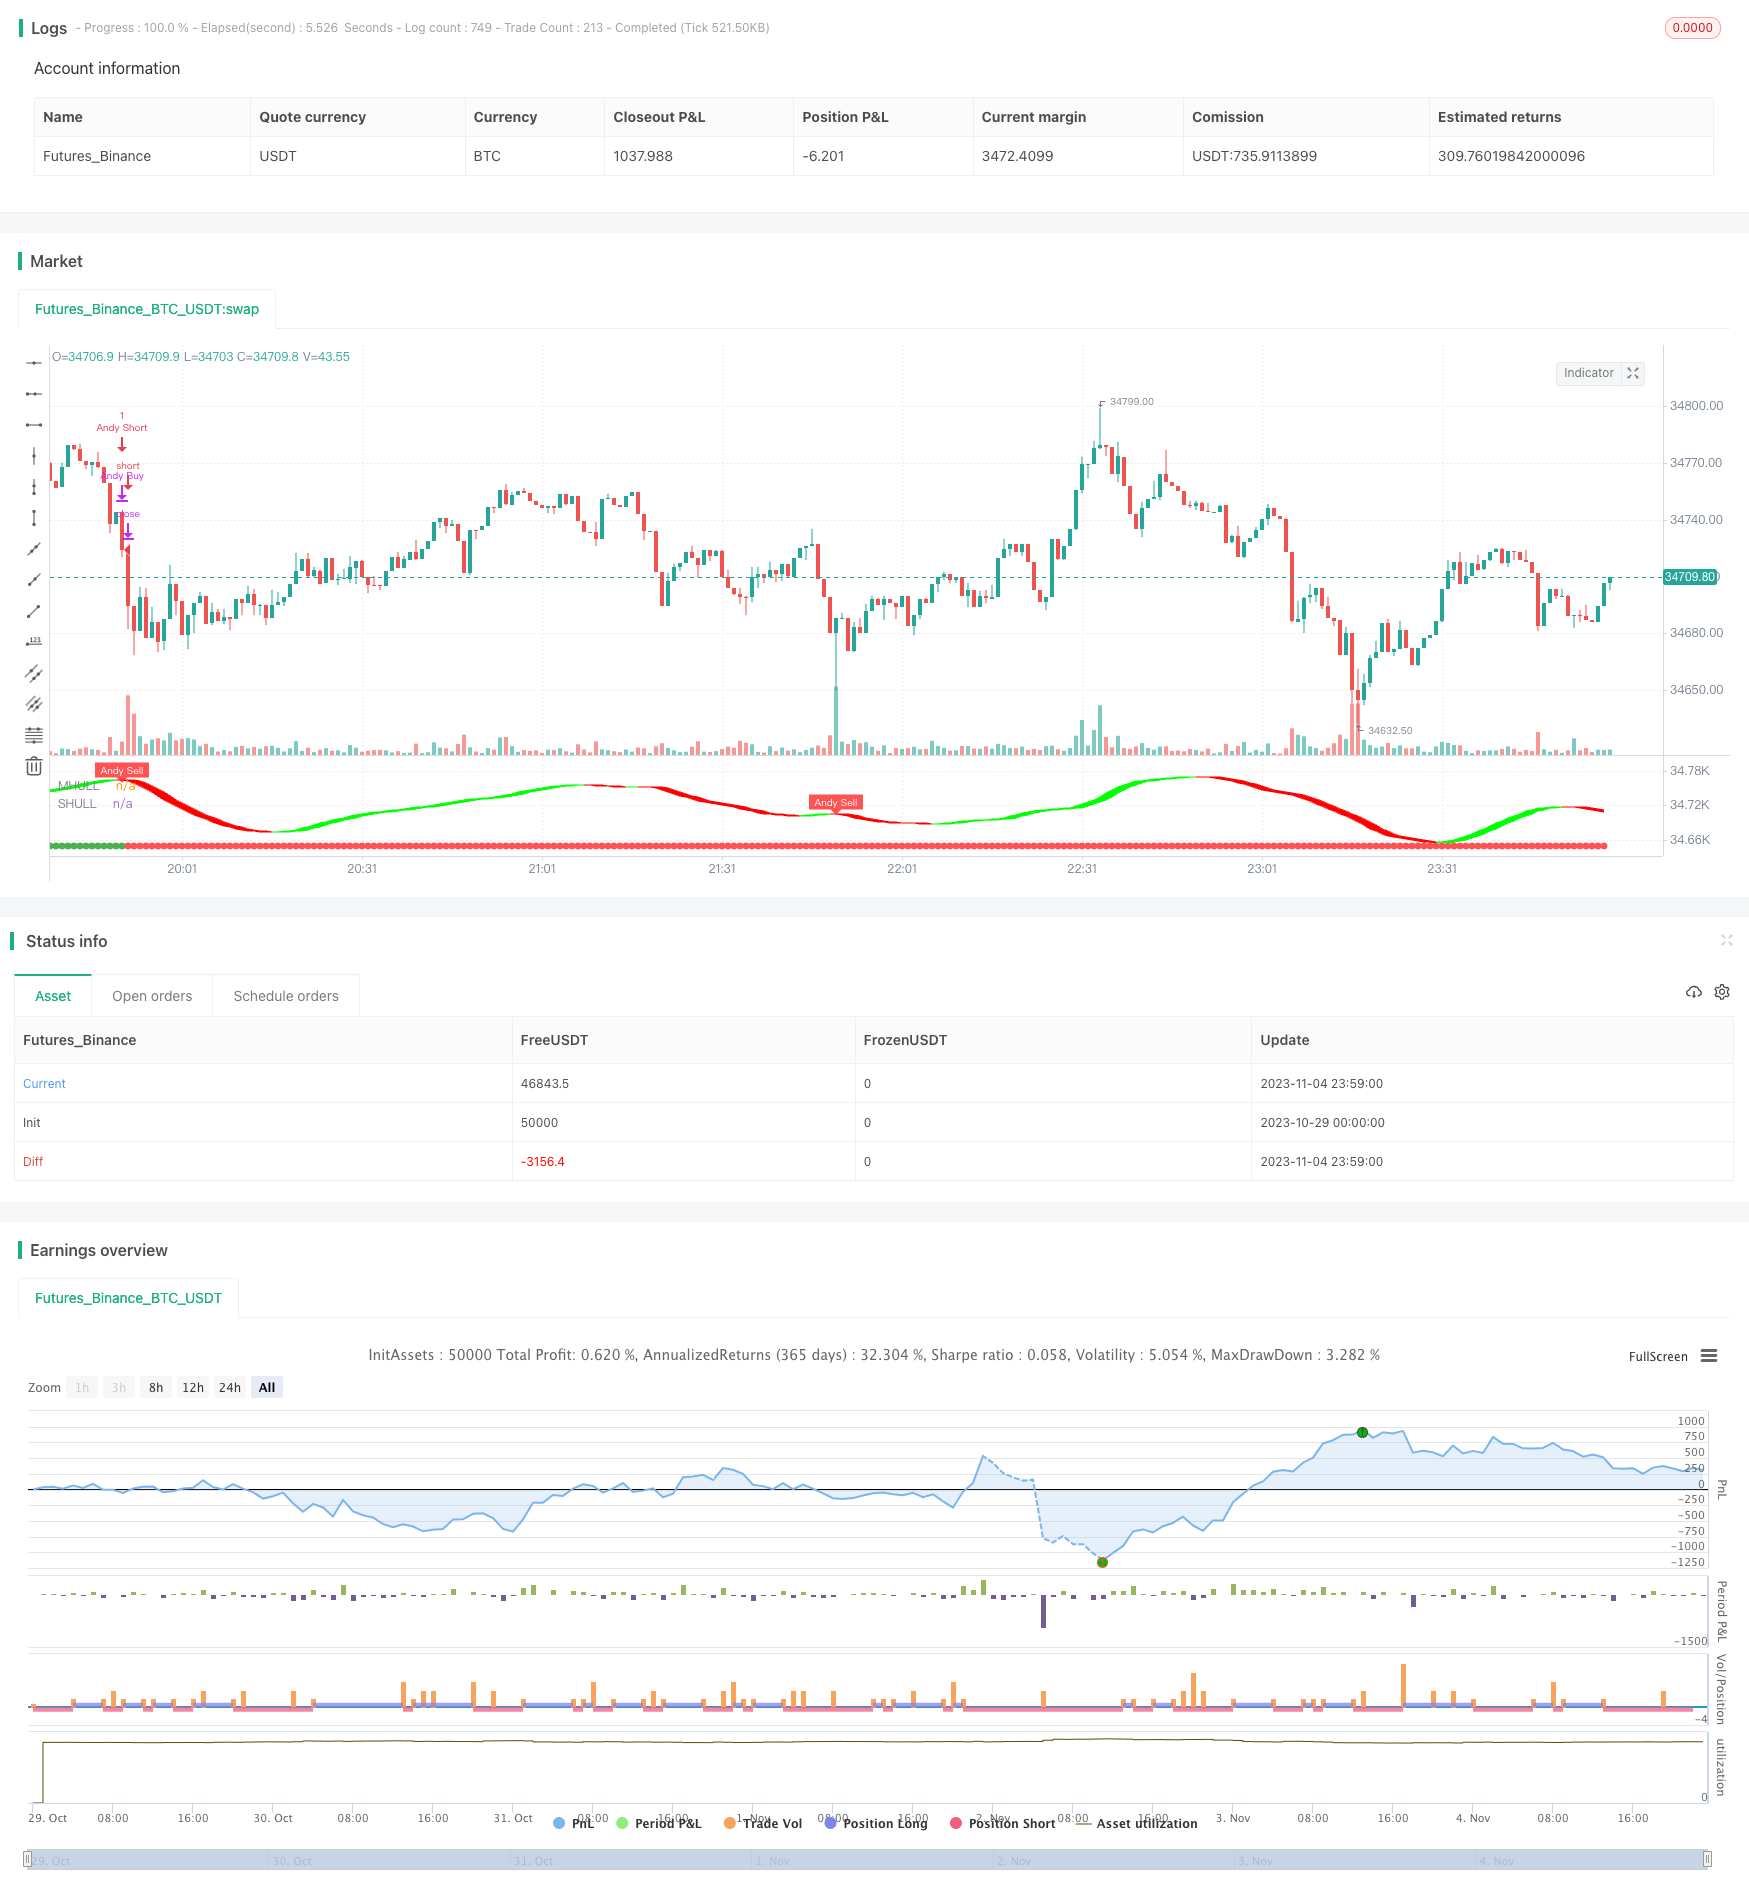
/*backtest
start: 2023-10-29 00:00:00
end: 2023-11-05 00:00:00
period: 1m
basePeriod: 1m
exchanges: [{"eid":"Futures_Binance","currency":"BTC_USDT"}]
*/

// This source code is subject to the terms of the Mozilla Public License 2.0 at https://mozilla.org/MPL/2.0/
// © kgynofomo

// @version=5
strategy(title="[Salavi] | Andy Super Pro Strategy",overlay = true)

//Doinchian Trend Ribbon
dlen = input.int(defval=30, minval=10)

dchannel(len) =>
    float hh = ta.highest(len)
    float ll = ta.lowest(len)

    int trend = 0
    trend := close > hh[1] ? 1 : close < ll[1] ? -1 : nz(trend[1])
    trend

dchannelalt(len, maintrend) =>
    float hh = ta.highest(len)
    float ll = ta.lowest(len)

    int trend = 0
    trend := close > hh[1] ? 1 : close < ll[1] ? -1 : nz(trend[1])
    maintrend == 1 ? trend == 1 ? #00FF00ff : #00FF009f : maintrend == -1 ? trend == -1 ? #FF0000ff : #FF00009f : na

maintrend = dchannel(dlen)
donchian_bull = maintrend==1
donchian_bear = maintrend==-1


//Hulls
src = input(hlc3, title='Source')
modeSwitch = input.string('Hma', title='Hull Variation', options=['Hma', 'Thma', 'Ehma'])
length = input(55, title='Length')
lengthMult = input(1.0, title='Length multiplier ')

useHtf = false
htf = '240'

switchColor = true
candleCol = false
visualSwitch = true
thicknesSwitch = 1
transpSwitch = 40

//FUNCTIONS
//HMA
HMA(_src, _length) =>
    ta.wma(2 * ta.wma(_src, _length / 2) - ta.wma(_src, _length), math.round(math.sqrt(_length)))
//EHMA
EHMA(_src, _length) =>
    ta.ema(2 * ta.ema(_src, _length / 2) - ta.ema(_src, _length), math.round(math.sqrt(_length)))
//THMA
THMA(_src, _length) =>
    ta.wma(ta.wma(_src, _length / 3) * 3 - ta.wma(_src, _length / 2) - ta.wma(_src, _length), _length)

//SWITCH
Mode(modeSwitch, src, len) =>
    modeSwitch == 'Hma' ? HMA(src, len) : modeSwitch == 'Ehma' ? EHMA(src, len) : modeSwitch == 'Thma' ? THMA(src, len / 2) : na

//OUT
_hull = Mode(modeSwitch, src, int(length * lengthMult))
HULL = useHtf ? request.security(syminfo.ticker, htf, _hull) : _hull
MHULL = HULL[0]
SHULL = HULL[2]

//COLOR
hullColor = switchColor ? HULL > HULL[2] ? #00ff00 : #ff0000 : #ff9800
hull_bull = HULL > HULL[2]
bull_start = hull_bull and hull_bull[1]==false
hull_bear = HULL < HULL[2]
bear_start = hull_bear and hull_bear[1]==false

barcolor(color=candleCol ? switchColor ? hullColor : na : na)

//halftrend
amplitude = input(title='Amplitude', defval=2)
channelDeviation = input(title='Channel Deviation', defval=2)
// showArrows = input(title='Show Arrows', defval=true)
// showChannels = input(title='Show Channels', defval=true)

var int trend = 0
var int nextTrend = 0
var float maxLowPrice = nz(low[1], low)
var float minHighPrice = nz(high[1], high)

var float up = 0.0
var float down = 0.0
float atrHigh = 0.0
float atrLow = 0.0
float arrowUp = na
float arrowDown = na

atr2 = ta.atr(100) / 2
dev = channelDeviation * atr2

highPrice = high[math.abs(ta.highestbars(amplitude))]
lowPrice = low[math.abs(ta.lowestbars(amplitude))]
highma = ta.sma(high, amplitude)
lowma = ta.sma(low, amplitude)

if nextTrend == 1
    maxLowPrice := math.max(lowPrice, maxLowPrice)

    if highma < maxLowPrice and close < nz(low[1], low)
        trend := 1
        nextTrend := 0
        minHighPrice := highPrice
        minHighPrice
else
    minHighPrice := math.min(highPrice, minHighPrice)

    if lowma > minHighPrice and close > nz(high[1], high)
        trend := 0
        nextTrend := 1
        maxLowPrice := lowPrice
        maxLowPrice

if trend == 0
    if not na(trend[1]) and trend[1] != 0
        up := na(down[1]) ? down : down[1]
        arrowUp := up - atr2
        arrowUp
    else
        up := na(up[1]) ? maxLowPrice : math.max(maxLowPrice, up[1])
        up
    atrHigh := up + dev
    atrLow := up - dev
    atrLow
else
    if not na(trend[1]) and trend[1] != 1
        down := na(up[1]) ? up : up[1]
        arrowDown := down + atr2
        arrowDown
    else
        down := na(down[1]) ? minHighPrice : math.min(minHighPrice, down[1])
        down
    atrHigh := down + dev
    atrLow := down - dev
    atrLow

ht = trend == 0 ? up : down

var color buyColor = color.blue
var color sellColor = color.red

htColor = trend == 0 ? buyColor : sellColor
// htPlot = plot(ht, title='HalfTrend', linewidth=2, color=htColor)

// atrHighPlot = plot(showChannels ? atrHigh : na, title='ATR High', style=plot.style_circles, color=color.new(sellColor, 0))
// atrLowPlot = plot(showChannels ? atrLow : na, title='ATR Low', style=plot.style_circles, color=color.new(buyColor, 0))

// fill(htPlot, atrHighPlot, title='ATR High Ribbon', color=color.new(sellColor, 90))
// fill(htPlot, atrLowPlot, title='ATR Low Ribbon', color=color.new(buyColor, 90))

HalfTrend_buySignal = not na(arrowUp) and trend == 0 and trend[1] == 1
HalfTrend_sellSignal = not na(arrowDown) and trend == 1 and trend[1] == 0

// plotshape(showArrows and buySignal ? atrLow : na, title='Arrow Up', style=shape.triangleup, location=location.absolute, size=size.tiny, color=color.new(buyColor, 0))
// plotshape(showArrows and sellSignal ? atrHigh : na, title='Arrow Down', style=shape.triangledown, location=location.absolute, size=size.tiny, color=color.new(sellColor, 0))


//ema
filter_ema = ta.ema(close,200)
ema_bull = close>filter_ema
ema_bear = close<filter_ema

atr_length = input.int(7)
atr = ta.atr(atr_length)
atr_rsi_length = input.int(50)
atr_rsi = ta.rsi(atr,atr_rsi_length)
atr_valid = atr_rsi>50

longCondition = bull_start and atr_valid
shortCondition = bear_start and atr_valid

Exit_long_condition = shortCondition
Exit_short_condition = longCondition

if longCondition
    strategy.entry("Andy Buy",strategy.long, limit=close,comment="Andy Buy Here")

if Exit_long_condition
    strategy.close("Andy Buy",comment="Andy Buy Out")
    // strategy.entry("Andy fandan Short",strategy.short, limit=close,comment="Andy 翻單 short Here")
    // strategy.close("Andy fandan Buy",comment="Andy short Out")


if shortCondition
    strategy.entry("Andy Short",strategy.short, limit=close,comment="Andy short Here")


// strategy.exit("STR","Long",stop=longstoploss)
if Exit_short_condition
    strategy.close("Andy Short",comment="Andy short Out")
    // strategy.entry("Andy fandan Buy",strategy.long, limit=close,comment="Andy 翻單 Buy Here")
    // strategy.close("Andy fandan Short",comment="Andy Buy Out")


inLongTrade = strategy.position_size > 0
inLongTradecolor = #58D68D
notInTrade = strategy.position_size == 0
inShortTrade = strategy.position_size < 0

// bgcolor(color = inLongTrade?color.rgb(76, 175, 79, 70):inShortTrade?color.rgb(255, 82, 82, 70):na)
plotshape(close!=0,location = location.bottom,color = inLongTrade?color.green:inShortTrade?color.red:na)


plotshape(longCondition, title='Buy', text='Andy Buy', style=shape.labelup, location=location.belowbar, color=color.new(color.green, 0), textcolor=color.new(color.white, 0), size=size.tiny)
plotshape(shortCondition, title='Sell', text='Andy Sell', style=shape.labeldown, location=location.abovebar, color=color.new(color.red, 0), textcolor=color.new(color.white, 0), size=size.tiny)

Fi1 = plot(MHULL, title='MHULL', color=hullColor, linewidth=thicknesSwitch, transp=50)
Fi2 = plot(SHULL, title='SHULL', color=hullColor, linewidth=thicknesSwitch, transp=50)

fill(Fi1, Fi2, title='Band Filler', color=hullColor, transp=transpSwitch)