概述
该策略基于快速移动平均线和慢速移动平均线的交叉原理生成交易信号。当快速移动平均线从下方上穿慢速移动平均线时,产生买入信号;当快速移动平均线从上方下穿慢速移动平均线时,产生卖出信号。
原理
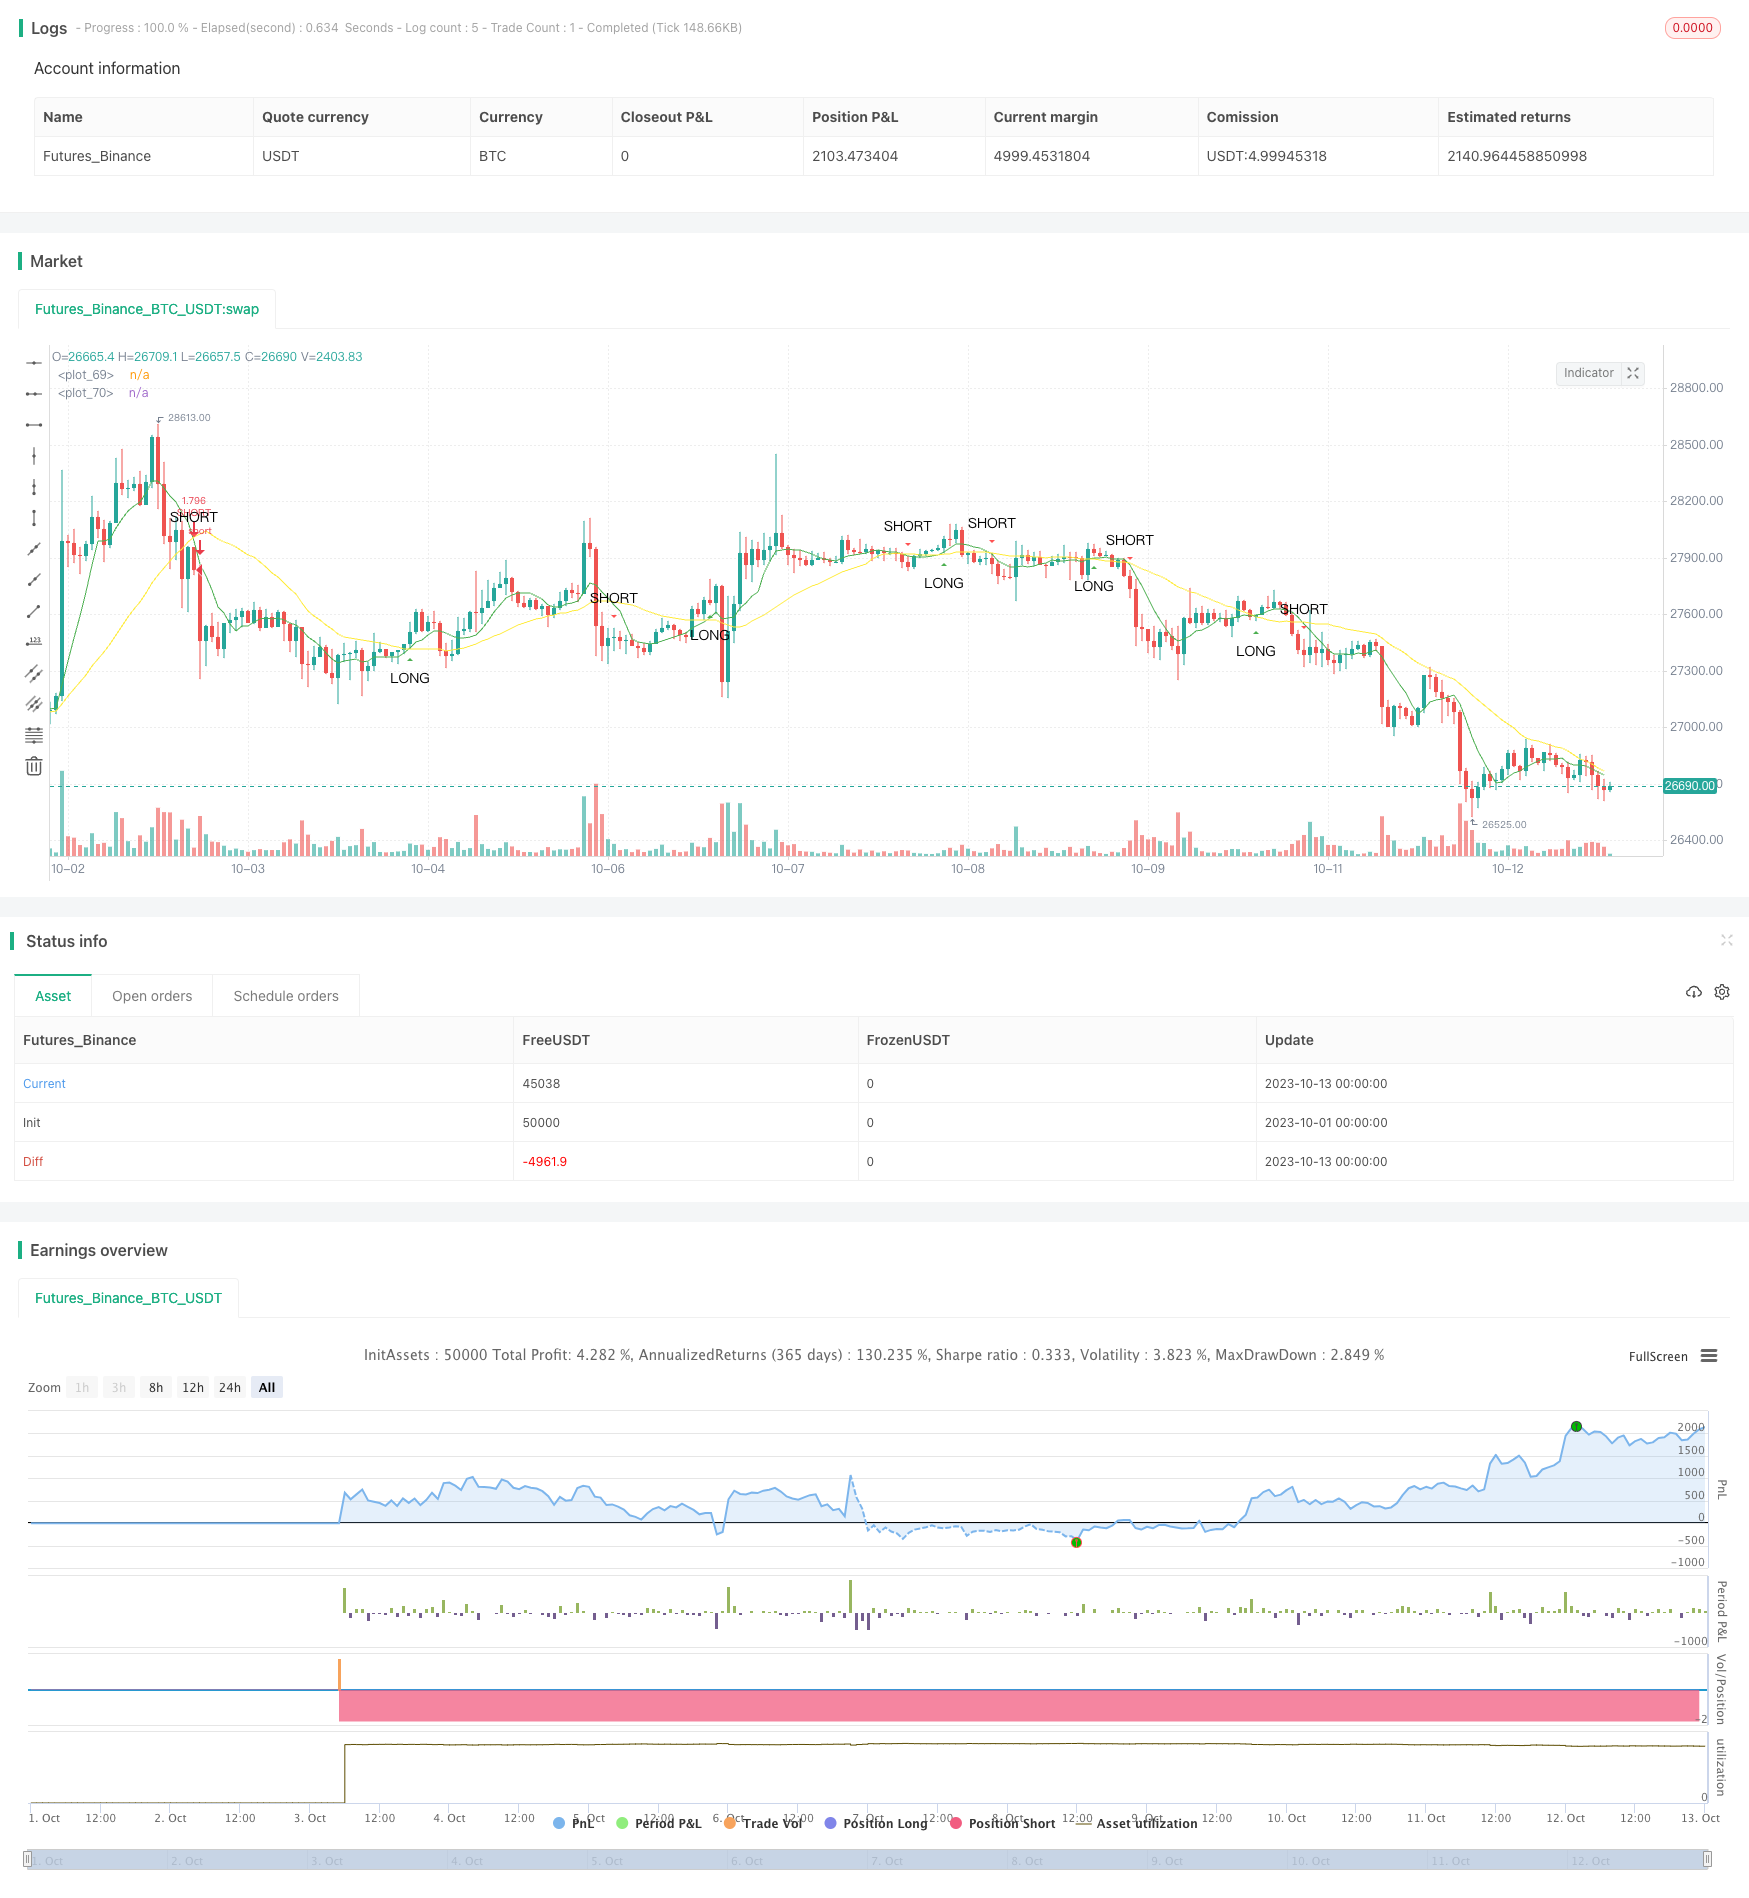
该策略使用sma函数计算快速移动平均线和慢速移动平均线。其中fast_SMA为快速移动平均线,周期长度为fast_SMA_input;slow_SMA为慢速移动平均线,周期长度为slow_SMA_input。
策略使用cross和crossunder函数判断快速移动平均线和慢速移动平均线的交叉情况。当快速移动平均线上穿慢速移动平均线时,LONG变量为true,产生买入信号;当快速移动平均线下穿慢速移动平均线时,SHORT变量为true,产生卖出信号。
优势分析
该策略具有以下优势:
- 策略原理简单,容易理解和实现。
- 可自定义移动平均线周期,适用于不同市场环境。
- 可过滤部分市场噪音,产生较为可靠的交易信号。
- 可同时捕捉趋势的启动和转折。
风险分析
该策略也存在以下风险:
- 如果设置不当,会产生过多交易信号,导致交易频繁。
- 在横盘市场中可能会产生大量无效信号。
- 无法判断趋势的持续时间,可能会过早反转。
风险控制方法:
- 合理设置移动平均线参数,平衡过滤效果和灵敏度。
- 结合趋势指标过滤无效信号。
- 设置止损点,控制单笔损失。
优化方向
该策略可以从以下方面进行优化:
- 增加过滤条件,在突破移动平均线时检查成交量或波动性指标,避免假突破。
- 结合趋势指标,识别趋势的方向和力度。
- 增加机器学习模型,自动优化移动平均线参数。
- 结合支持阻力位、布林带等技术指标绘制交易区域,提高入场精确度。
总结
该策略利用移动平均线的优势,简单有效地产生交易信号。虽然存在一些风险,但可通过参数优化、增加过滤条件等方式进行改进。移动平均线交叉策略值得进一步研究与应用。
策略源码
/*backtest
start: 2023-10-01 00:00:00
end: 2023-10-13 00:00:59
period: 1h
basePeriod: 15m
exchanges: [{"eid":"Futures_Binance","currency":"BTC_USDT"}]
*/

//@author Jacques Grobler
//
//                  SIMPLE CROSS OVER BOT
//                  =====================
//
// This is a simple example of how to set up a strategy to go long or short
// If you make any modifications or have any suggestions, let me know
// When using this script, every section marked back testing should be
// uncommented in order to use for back testing, same goes for using the script portion

///////////////////////////////////////////////////////////////////////////////////////
//// INTRO
//// -----
// BACKTESTING
//@version=4
strategy(title="SimpleCrossOver_Bot_V1_Backtester", overlay=true, default_qty_type=strategy.percent_of_equity, default_qty_value=100, pyramiding=0, commission_type=strategy.commission.percent, commission_value=0.1)

// SIGNALS
//study(title="SimpleCrossOver_Bot_V1_Signals", overlay = true)

///////////////////////////////////////////////////////////////////////////////////////
//// INPUTS
//// ------
// BACKTESTING
dateSart_Year = input(2018, title="Start Year", minval=2000)
dateSart_Month = input(1, title="Start Month", minval=1, maxval=12)
dateSart_Day = input(1, title="Start Day", minval=1, maxval=31)
dateEnd_Year = input(2019, title="End Year", minval=2000)
dateEnd_Month = input(1, title="End Month", minval=1, maxval=12)
dateEnd_Day = input(1, title="End Day", minval=1, maxval=31)

// BACKTESTING AND SIGNALS
fast_SMA_input = input(7, title="SMA Fast")
slow_SMA_input = input(25, title="SMA Slow")

///////////////////////////////////////////////////////////////////////////////////////
//// INDICATORS
//// ----------
fast_SMA = sma(close, fast_SMA_input)
slow_SMA = sma(close, slow_SMA_input)

///////////////////////////////////////////////////////////////////////////////////////
//// STRATEGY
//// --------
LONG = cross(fast_SMA, slow_SMA) and fast_SMA > slow_SMA
stratLONG() => crossover(fast_SMA, slow_SMA)
SHORT = cross(fast_SMA, slow_SMA) and fast_SMA < slow_SMA
stratSHORT() => crossunder(fast_SMA, slow_SMA)

///////////////////////////////////////////////////////////////////////////////////////
//// TRIGGERS
//// --------
// BACKTESTING
testPeriodStart = timestamp(dateSart_Year, dateSart_Month, dateSart_Day, 0, 0)
testPeriodStop = timestamp(dateEnd_Year, dateEnd_Month, dateEnd_Day, 0, 0)
timecondition = true

strategy.entry(id="LONG", long = true, when=timecondition and stratLONG())
strategy.entry(id="SHORT", long = false, when=timecondition and stratSHORT())

// SIGNALS
//alertcondition(LONG, title="LONG")
//alertcondition(SHORT, title="SHORT")

///////////////////////////////////////////////////////////////////////////////////////
//// PLOTS
//// -----
// BACKTESTING AND SIGNALS
plot(fast_SMA, color=green, linewidth=1)
plot(slow_SMA, color=yellow, linewidth=1)
plotshape(LONG, title="LONG", style=shape.triangleup, text="LONG", location=location.belowbar, size=size.small, color=green)
plotshape(SHORT, title="SHORT", style=shape.triangledown, text="SHORT", location=location.abovebar, size=size.small, color=red)