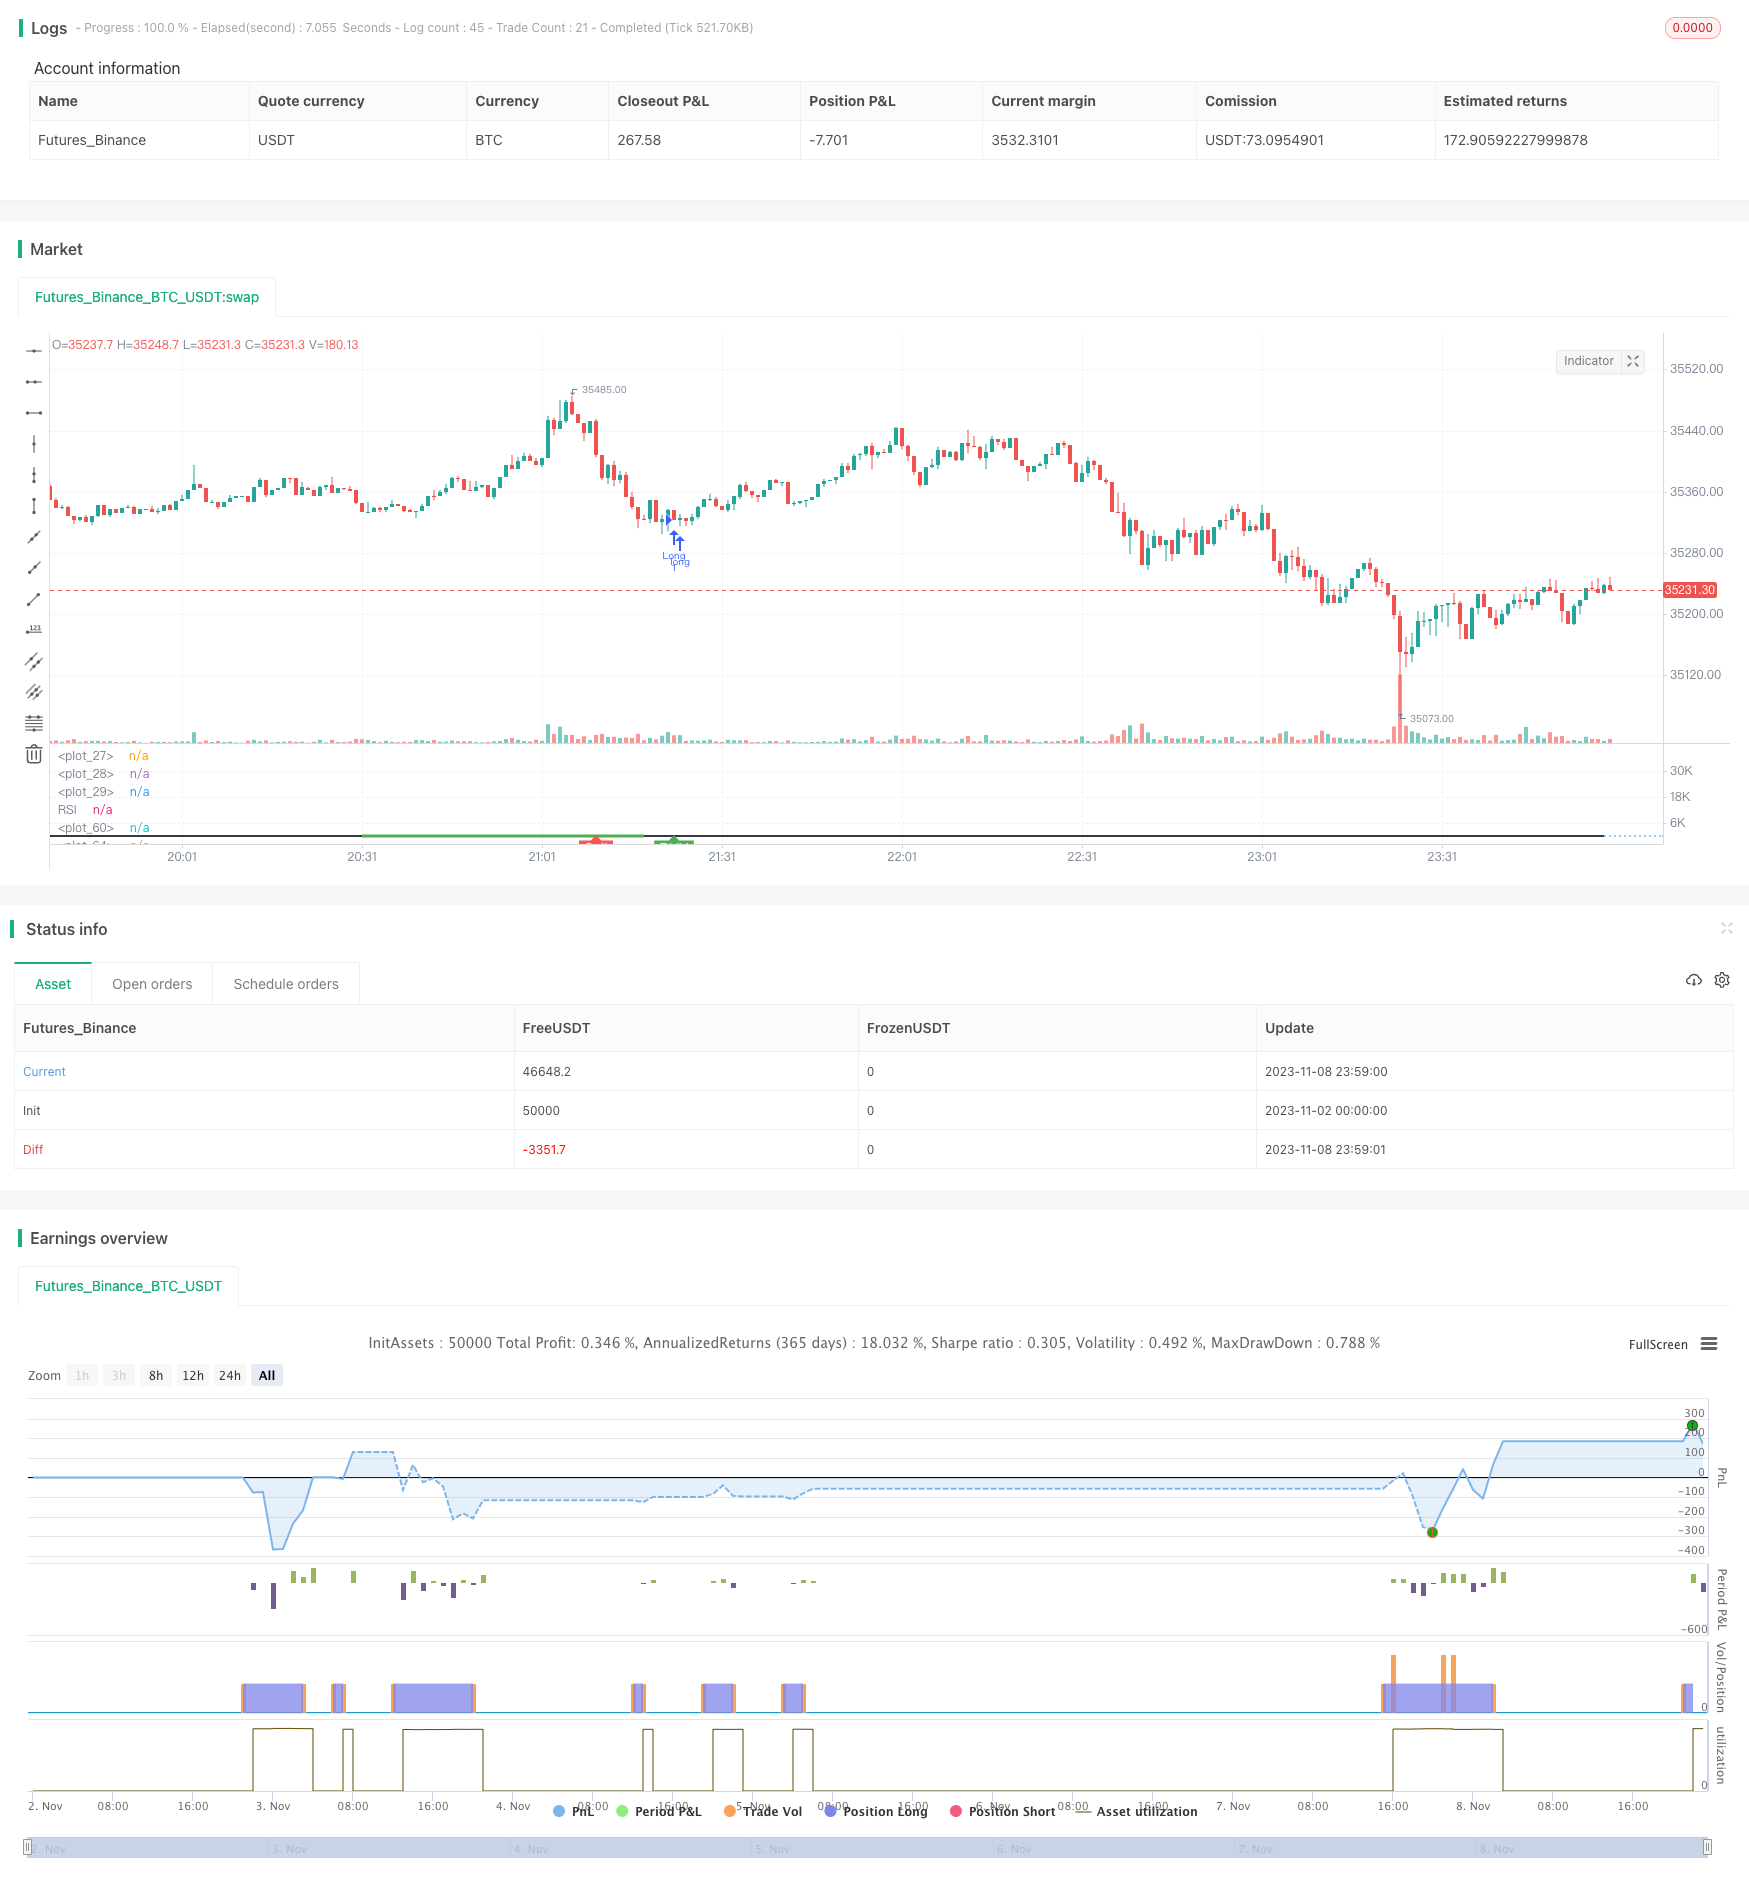
概述
该策略通过寻找RSI指标的多头背离情况,判断短期内比特币价格可能反弹上涨的时机,从而确定合适的买入时机。
策略原理
使用RSI指标判断是否存在多头背离
- 定义RSI指标参数(默认14周期)
- 计算当前RSI值
- 判断是否存在以下多头背离情况:
- RSI指标出现较低低点
- 此时价格出现较低低点
- 之后RSI指标出现较高低点
- 此时价格出现较高低点
判断RSI值是否低于门限值
- 定义RSI低点判定门限值(默认40)
- 如果当前RSI值低于该门限值,则可能为买入时机
判断收盘价是否低于背离开始的低点
- 如果是,则进一步验证背离买入信号
定义止损退出条件
- 设置止损百分比(默认5%)
- 如果回撤达到该百分比,则止损退出
定义盈利退出条件
- 设置RSI高点判定门限值(默认75)
- 如果RSI上涨达到该门限值,则盈利退出
优势分析
使用RSI指标判断多头背离,可以有效捕捉价格短期反弹的时机
配合RSI低点判断,可以在反弹前确定具体的买入点位
设置止损和止盈条件,可以对交易风险和收益进行管理
该策略参考了大量比特币实盘交易中RSI指标的特点,非常适合比特币短线做多
策略参数设置合理,可以适应不同市场情况,有利于实盘应用
风险分析
RSI指标存在失效的可能,如果判断错误,将导致交易亏损
单一技术指标容易产生假信号,应该与其他指标结合使用
需要选择合适的参数值,如果设置不当,会影响策略收益率
做多方向交易,需要关注大级别趋势,避免逆势操作
需要关注交易费用,过于频繁交易会影响最终收益
应定期回测优化参数,根据不同市场调整策略
优化方向
可以考虑加入移动均线等其他指标,设置过滤条件,减少假信号
可以测试不同周期的参数设置,寻找最佳参数组合
可以结合较大级别趋势判断,避免在趋势反转时做多
可以设置动态止损,当利润达到一定水平后逐步抬高止损点
可以根据具体持仓情况,设置不同的止损幅度
可以引入机器学习等技术,实现参数的自动优化
总结
该策略通过捕捉RSI指标多头背离,判断比特币短期内存在反弹上涨的可能,从而确定买入时机。策略简单有效,参考了大量实盘经验,非常适合比特币短线做多。但单一技术指标易产生假信号,需要与其他指标组合使用,同时要关注参数优化、止损设置、交易成本等问题。如果使用得当,该策略可以在实盘中获利良多。
策略源码
/*backtest
start: 2023-11-02 00:00:00
end: 2023-11-09 00:00:00
period: 1m
basePeriod: 1m
exchanges: [{"eid":"Futures_Binance","currency":"BTC_USDT"}]
*/

//@version=5
strategy("Bullish Divergence Short-term Long Trade Finder", overlay=false)

max_range = 50
min_range = 5
///pivot_left = 25
pivot_right = 5

//Inputs
src = input(close, title="Source")
rsiBearCondMin = input.int(50, title="RSI Bearish Condition Minimum")
rsiBearCondSellMin = input.int(60, title="RSI Bearish Condition Sell Min")
rsiBullCondMin = input.int(40, title="RSI Bull Condition Minimum")
pivot_left = input.int(25, title="Look Back this many candles")
SellWhenRSI = input.int(75, title="RSI Sell Value")
StopLossPercent = input.int(5, title="Stop loss Percentage")
rsiPeriod = input.int(14, title="RSI Length")
rsiOversold = input.int(30, title="RSI Oversold Level")
rsiOverbought = input.int(70, title="RSI Overbought Level")

//RSI Function/ value
rsi_value = ta.rsi(src, rsiPeriod)
rsi_hour = request.security(syminfo.tickerid,'60',rsi_value)
rsi_4hour = request.security(syminfo.tickerid,'240',rsi_value)
rsi_Day = request.security(syminfo.tickerid,'D',rsi_value)
plot(rsi_value, title="RSI", linewidth = 2, color = color.black, display =display.all)
hline(50, linestyle = hline.style_dotted)
rsi_ob = hline(70, linestyle=hline.style_dotted)
rsi_os = hline(30, linestyle=hline.style_dotted)
fill(rsi_ob, rsi_os, color.white)
SL_percent = (100-StopLossPercent)/100

pivot_low_true = na(ta.pivotlow(rsi_value, pivot_left, pivot_right)) ? false : true

//create a function that returns truee/false
confirm_range(x) =>
    bars = ta.barssince(x == true) //counts the number of bars since thee last time condition was true
    min_range <= bars and bars <= max_range // makees sure bars is less than max_range(50) and greater than min_range(5)


// RSI higher check / low check
RSI_HL_check = rsi_value<rsiBullCondMin and rsi_value > ta.valuewhen(pivot_low_true and rsi_value<rsiBullCondMin, rsi_value,1) and confirm_range(pivot_low_true[1])

// price check for lower low
price_ll_check = low < ta.valuewhen(pivot_low_true, low, 1)

bullCond = price_ll_check and RSI_HL_check and pivot_low_true

//pivot_high_true = na(ta.pivothigh(rsi_value, pivot_left, pivot_right))  ? false : true
pivot_high_true = na(ta.pivothigh(rsi_value, pivot_left, pivot_right))   ? false : true

// RSI Lower check / high check ensuring that the RSI dips below 30 to start divergence
RSI_LH_check = rsi_value < ta.valuewhen(pivot_high_true and rsi_value>rsiBearCondMin, rsi_value,1) and confirm_range(pivot_high_true[1]) //and rsi_value[pivot_right] >= 65

// price check for lower low
price_hh_check = high > ta.valuewhen(pivot_high_true, high, 1)

bearCond = price_hh_check and RSI_LH_check and pivot_high_true and rsi_value[3] > rsiBearCondSellMin

plot(pivot_low_true ? rsi_value : na, offset=-5, linewidth=3, color=(bullCond ? color.green : color.new(color.white, 100)))

plotshape(bullCond ? rsi_value : na , text = "BUY", style =  shape.labelup, location = location.absolute, color = color.green, offset =0, textcolor = color.white )

plot(pivot_low_true ? rsi_value : na, offset=-5, linewidth=3, color=(bearCond ? color.red : color.new(color.white, 100)))

plotshape(bearCond ? rsi_value : na , text = "Sell", style =  shape.labelup, location = location.absolute, color = color.red, offset =0, textcolor = color.white )
//[bbUpperBand, bbMiddleBand, bbLowerBand] = ta.bb(src, bbPeriod, bbDev)

//Entry Condition
longCondition = false

//bullEntry = bullCond and RSI_HL_check and confirm_range(pivot_low_true[1])
if bullCond and close < ta.valuewhen(pivot_low_true, low, 1) and rsi_hour <40 ///and rsi_4hour<40 //and rsi_Day<50
    strategy.entry("Long", strategy.long)

//Exit Condition
if (strategy.position_size > 0 and close < strategy.position_avg_price*SL_percent)
    strategy.close("Long")
if (strategy.position_size > 0 and (rsi_value > SellWhenRSI or bearCond))
    strategy.close("Long")