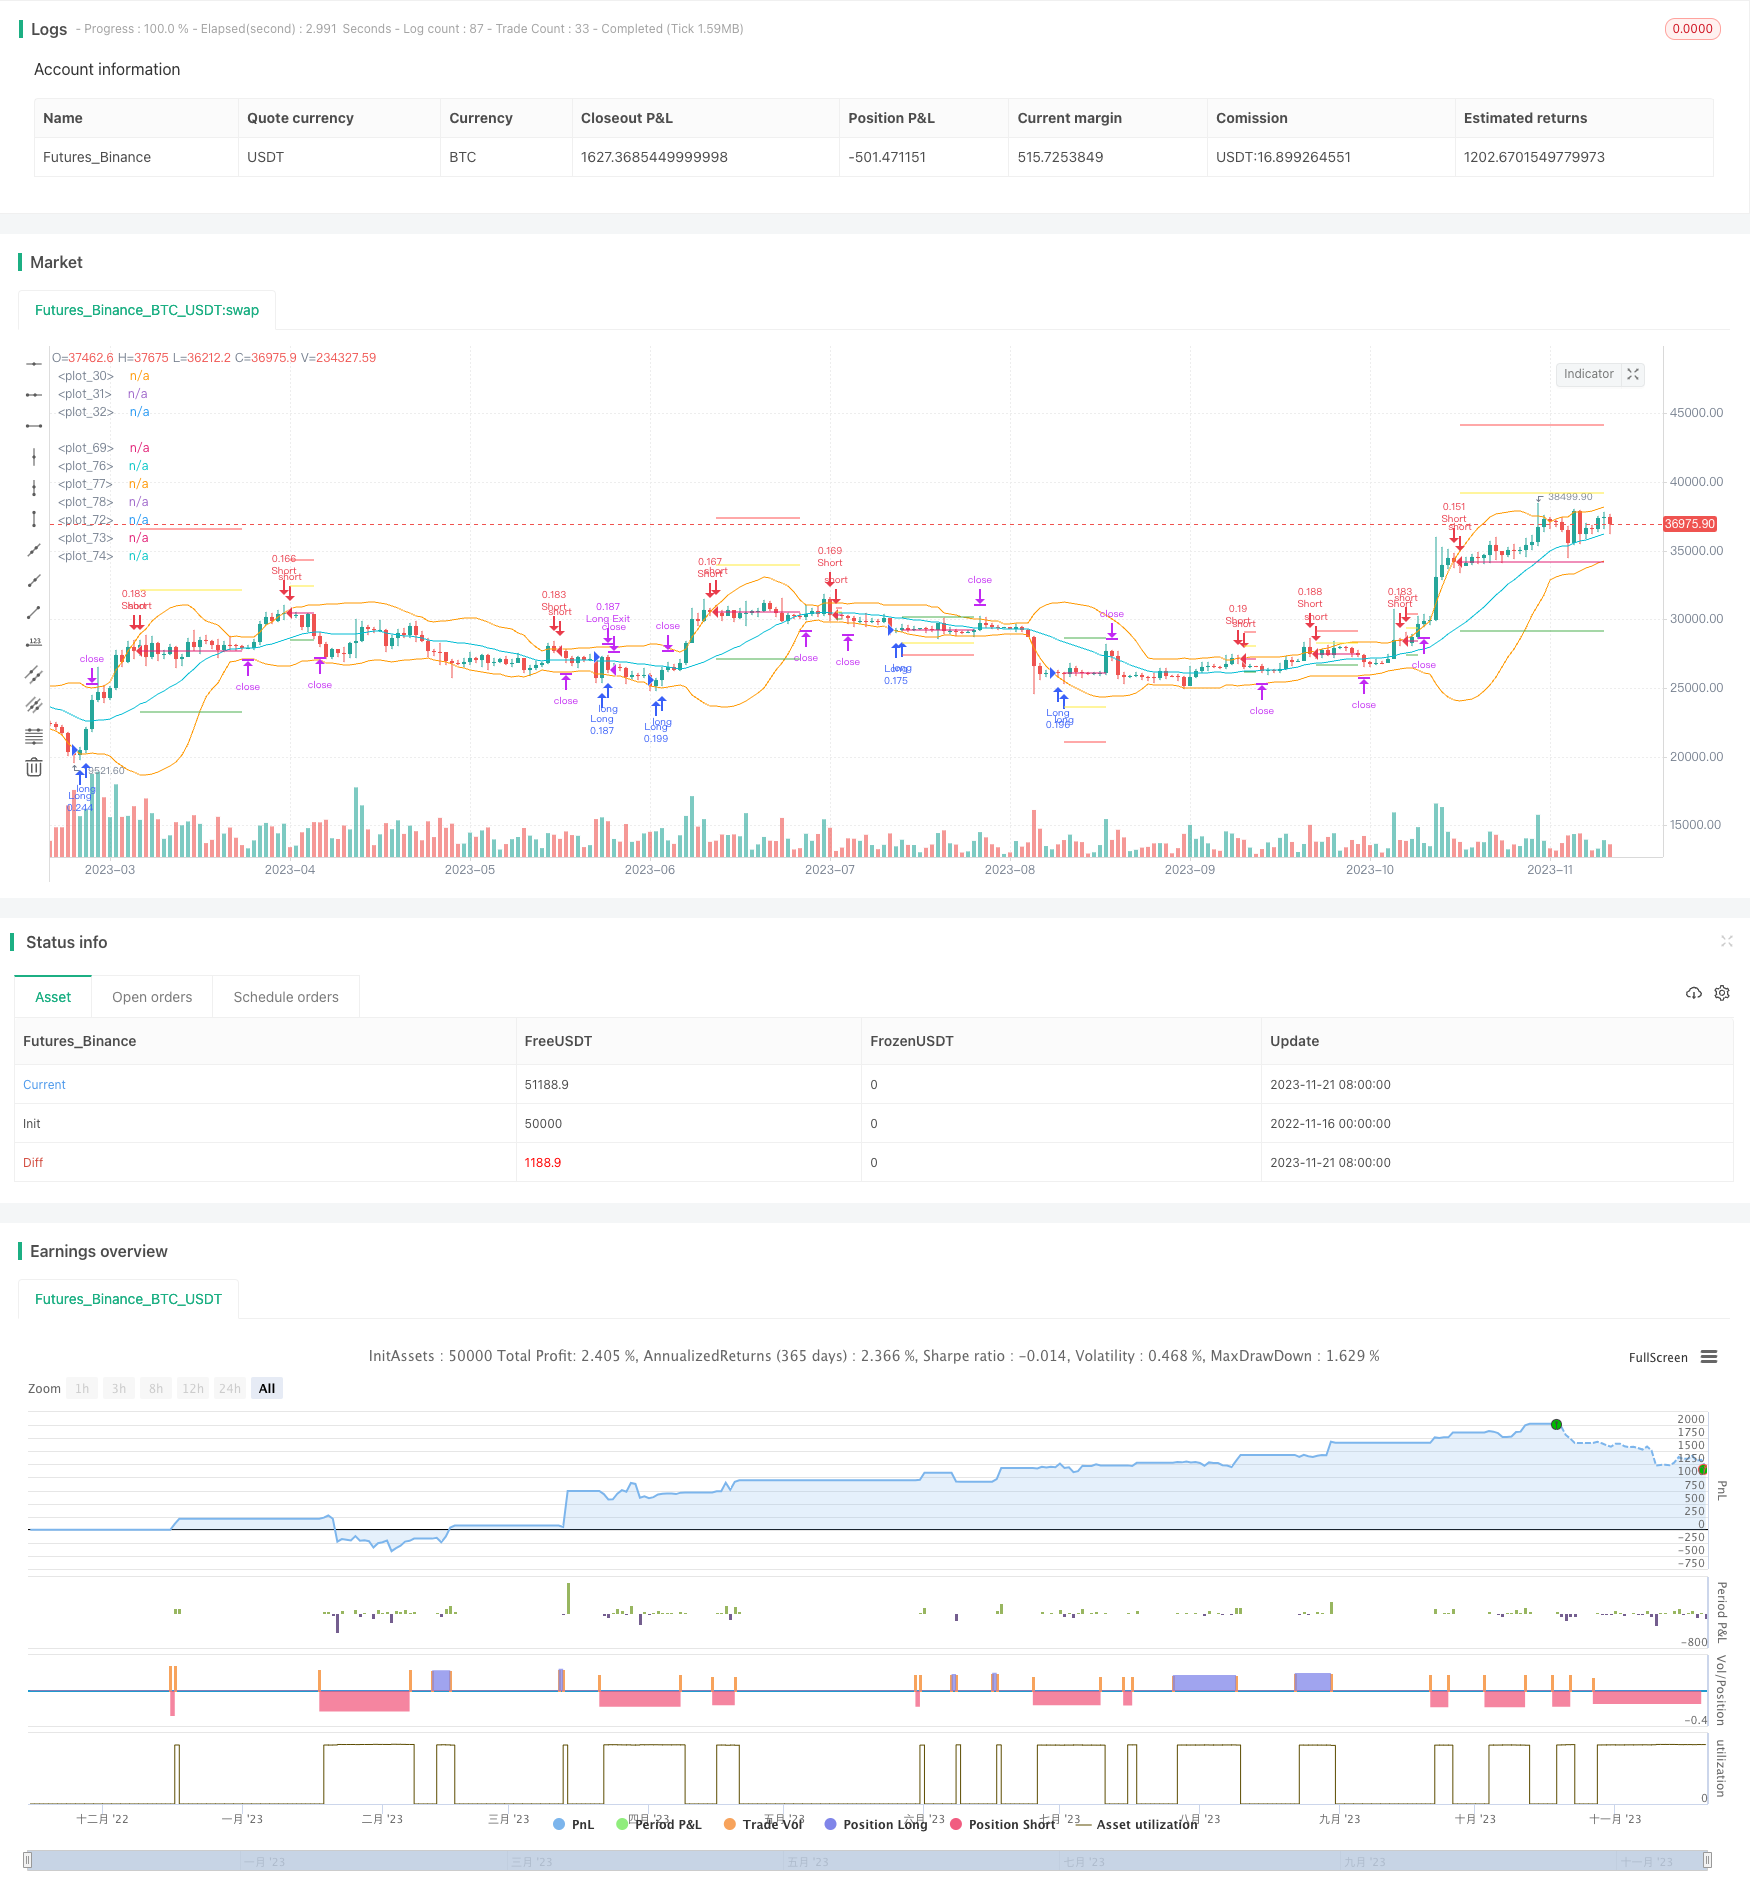
概述
该策略是基于布林带的金叉死叉进行做多做空的策略。当价格突破布林带上轨时,做空;当价格突破布林带下轨时,做多。在持仓期间,会进行加仓以及止损追踪。
策略原理
该策略使用布林带的上中下3条轨迹。布林带中轨是n天的移动平均线,上轨是中轨+k倍的n天标准差,下轨是中轨-k倍的n天标准差。n一般为20,k一般为2。
当价格从下向上突破下轨时,表明价格开始上涨,此时做多;当价格从上向下突破上轨时,表明价格开始下跌,此时做空。
在做多做空后,会继续进行加仓。加仓的条件是在已持仓的基础上,如果价格再次触碰均线,会再次开仓做多或做空。
所有持仓的止损追踪也会实时更新。止损线会根据当前持仓的平均价格与布林带价格的差值来设定。
优势分析
该策略具有以下优势:
- 使用布林带指标,能够捕捉价格的突破,精确做多做空
- 采用金叉死叉方式,进行规则化的入场
- 持仓后会加仓,可以获得更大利润
- 实时更新止损,避免止损被冲击
风险分析
该策略也存在一些风险:
- 布林带作为指标,对市场波动较为敏感,可能会被套利
- 加仓方式增加了风险敞口,亏损会被放大
- 止损线并不绝对,还是存在被套的可能
针对这些风险,可以从以下几个方面进行优化:
- 调整布林带的参数,适应不同周期
- 优化加仓的幅度和频率
- 增加中轨作为进一步止损线
优化方向
该策略可以从以下几个方面进行优化:
- 优化布林带的参数,适应更多市场环境
- 优化加仓逻辑,平衡风险和收益
- 增加止损线,如中轨止损等
- 增加止盈策略,更主动止盈
- 结合其他指标过滤入场时机
- 优化资金管理,控制单笔风险
总结
本策略整体来说是一种典型的趋势追踪策略。它能够顺势而为,在趋势出现时获取利润。同时,也具有一定的风险,需要进一步优化和改进,适应更多市场情况,减少假突破带来的风险。
策略源码
/*backtest
start: 2022-11-16 00:00:00
end: 2023-11-22 00:00:00
period: 1d
basePeriod: 1h
exchanges: [{"eid":"Futures_Binance","currency":"BTC_USDT"}]
*/

//@version=5

strategy(title='Bollinger Band strategy with split, limit, stop', shorttitle='bb strategy', overlay=true,commission_type = strategy.commission.percent, commission_value = 0.01, default_qty_type = strategy.percent_of_equity, default_qty_value = 10, pyramiding = 4)


//Summary: Going Long or Short when Entering after Breaking the Bollinger Bands\
//At this time, the stop-loss, profit-taking price, and pyramiding standard\
// are determined from the difference between the position average price and the band price.

//After entering the position, if the price crosses the mid-band line, the stop loss is adjusted to the mid-band line.


//each trade, entry position size = 10% of total cash
//max pyramiding is 4
//commission = 0.01%


in_period = true


bb_length = input.int(20)
bb_mult = input.int(2)

[middle, upper, lower] = ta.bb(close,bb_length, bb_mult)
plot(middle, color=color.aqua)
plot(upper, color=color.orange)
plot(lower, color=color.orange)
long_cond = ta.crossover(close,lower)
short_cond = ta.crossunder(close,upper)

var saved_ph = 0.0
if strategy.opentrades>0 and strategy.opentrades[1]==0 and strategy.position_size > 0
    saved_ph := upper[1]
var saved_pl = 0.0
if strategy.opentrades>0 and strategy.opentrades[1]==0 and strategy.position_size < 0
    saved_pl := lower[1]

avg = strategy.position_avg_price

long_diff = saved_ph-avg
short_diff = saved_pl-avg

long_stoploss = avg - 1*long_diff
short_stoploss = avg - 1*short_diff

long_avgdown = avg - 0.5*long_diff
short_avgup = avg - 0.5*short_diff

long_profit_price = avg + 0.5*long_diff
short_profit_price = avg + 0.5*short_diff

var label _label = na
if in_period
    if long_cond and strategy.opentrades==0
        strategy.entry("Long",strategy.long)
    if long_cond and strategy.opentrades >0 and (close[1]<long_avgdown or close[2]<long_avgdown)
        strategy.entry("Long",strategy.long)

    if short_cond and strategy.opentrades==0
        strategy.entry("Short", strategy.short)
    if short_cond and strategy.opentrades>0 and (close[1]>short_avgup or close[2]>short_avgup)
        strategy.entry("Short",strategy.short)

plot(avg, style=plot.style_linebr)


plot(strategy.position_size > 0? long_profit_price: na,color=color.green, style=plot.style_linebr)
plot(strategy.position_size > 0? long_avgdown: na,color=color.yellow, style=plot.style_linebr)
plot(strategy.position_size > 0? long_stoploss: na,color=color.red, style=plot.style_linebr)

plot(strategy.position_size < 0? short_profit_price: na,color=color.green, style=plot.style_linebr)
plot(strategy.position_size < 0? short_avgup: na,color=color.yellow, style=plot.style_linebr)
plot(strategy.position_size < 0? short_stoploss: na,color=color.red, style=plot.style_linebr)

if strategy.position_size > 0
    if ta.crossover(close, middle)
        strategy.exit("Long Exit", "Long", limit=long_profit_price, stop=middle)
    else
        strategy.exit("Long Exit", "Long", limit=long_profit_price, stop=long_stoploss)
if strategy.position_size < 0
    if ta.crossunder(close, middle)
        strategy.exit("Short Exit", "Short", limit=short_profit_price, stop=middle)
    else
        strategy.exit("Short Exit", "Short", limit=short_profit_price, stop=short_stoploss)