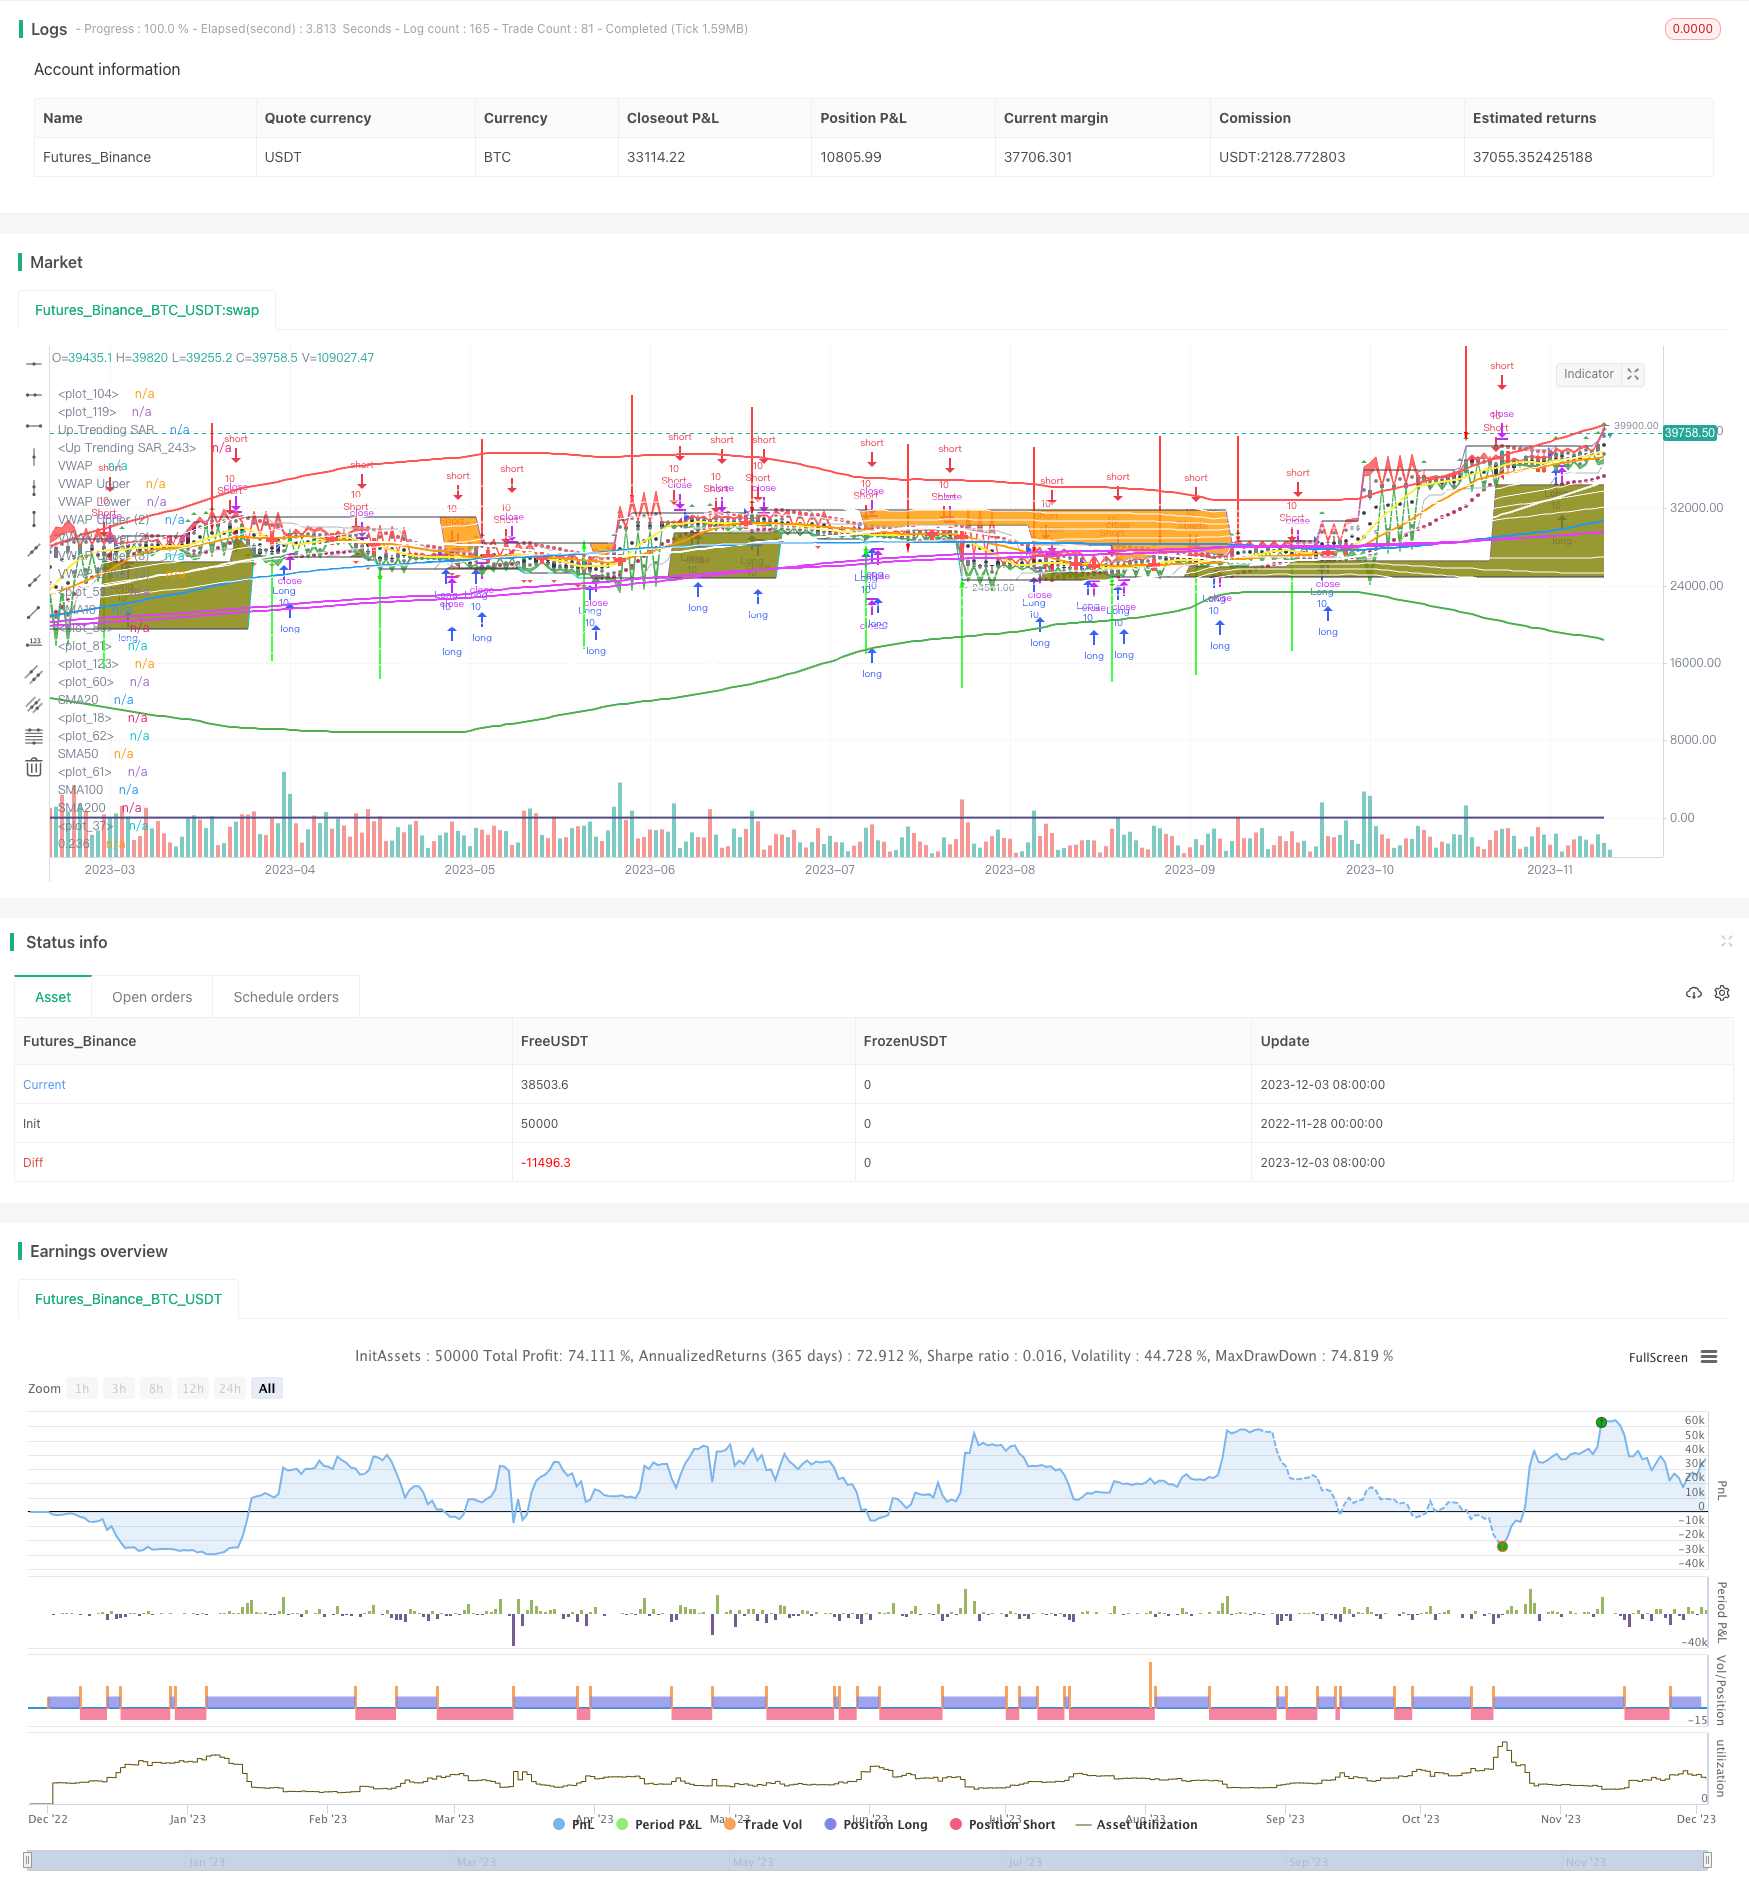
概述
本策略综合运用了移动平均线、波动率指标、成交量加权平均价格(VWAP)以及抛物线止损指标等多种技术分析工具,实现了一个具有较强突破识别能力和止损保护功能的混合Turtle交易策略。
策略原理
- 使用不同周期的SMA均线组合判断趋势方向和可能的突破点
- 应用波动率指标布林带判断短期的超买超卖情况
- 利用VWAP指标确定中长线的均衡价格区域
- 抛物线SAR作为止损指标,降低损失
- Turtle交易法则生成买卖信号
优势分析
- 多种指标融合,判断更全面、信号更准确
- VWAP指标辅助判断合理价格区间,避免盲目追高
- SAR止损指标有效控制每个头寸的损失
- Turtle交易法则确保进入位置的时机恰当
风险分析
- 参数设置不当可能导致交易频率过高或信号误判
- 单一止损方式会限制获利空间
- 需适当过滤Turtle信号,避免冲突
优化方向
- 调整SMA均线周期参数,优化突破识别
- 调整波动率参数,使布林带更贴近价格
- 优化抛物线参数,止损更精确
- 结合其他指标过滤Turtle信号
总结
本策略通过多种指标的有机结合,形成了一个交易信号较为准确、止损能力较强、参数调优空间大的混合突破类Turtle策略。适当调整参数后,其突破识别和止损保护的能力都将得到提升,是一个值得推荐的量化交易策略。
策略源码
/*backtest
start: 2022-11-28 00:00:00
end: 2023-12-04 00:00:00
period: 1d
basePeriod: 1h
exchanges: [{"eid":"Futures_Binance","currency":"BTC_USDT"}]
*/

//@version=4
strategy("Gui's Turtle", shorttitle = "Guis Turtles", overlay=true, pyramiding=0, default_qty_value = 10)

//This script has to be used with Heikin Ashi Caddles for the strategy to work well
//Thank you to all the ones that have their scripts public so we can make this everything one
//The colours and thicknesses have to be altered and messed with

sma1 = sma(close, 10)
sma2 = sma(close, 20)
plot(sma1, title="SMA10", color = yellow, linewidth = 2)
plot(sma2, title="SMA20", color = orange, linewidth = 2)
sma3 = sma(close, 50)
sma4 = sma(close, 100)
sma5 = sma(close, 200)
plot(sma3, title="SMA50", color = white, linewidth = 2)
plot(sma4, title="SMA100", color = blue, linewidth = 2)
plot(sma5, title="SMA200", color = fuchsia, linewidth = 2)
plot(cross(sma1, sma2) ? sma1 : na, style = cross, color = red, linewidth = 4)

length = input(200, minval=1)
src = input(hlc3, title="Source")
mult = input(3.0, minval=0.001, maxval=50)
basis = vwma(src, length)
dev = mult * stdev(src, length)
upper_1= basis + (0.236*dev)
upper_2= basis + (0.382*dev)
upper_3= basis + (0.5*dev)
upper_4= basis + (0.618*dev)
upper_5= basis + (0.764*dev)
upper_6= basis + (1*dev)
lower_1= basis - (0.236*dev)
lower_2= basis - (0.382*dev)
lower_3= basis - (0.5*dev)
lower_4= basis - (0.618*dev)
lower_5= basis - (0.764*dev)
lower_6= basis - (1*dev)
plot(basis, color=fuchsia, linewidth=2)
p1 = plot(upper_1, color=white, linewidth=1, title="0.236")
p2 = plot(upper_2, color=white, linewidth=1, title="0.382")
p3 = plot(upper_3, color=white, linewidth=1, title="0.5")
p4 = plot(upper_4, color=white, linewidth=1, title="0.618")
p5 = plot(upper_5, color=white, linewidth=1, title="0.764")
p6 = plot(upper_6, color=red, linewidth=2, title="1")
p13 = plot(lower_1, color=white, linewidth=1, title="0.236")
p14 = plot(lower_2, color=white, linewidth=1, title="0.382")
p15 = plot(lower_3, color=white, linewidth=1, title="0.5")
p16 = plot(lower_4, color=white, linewidth=1, title="0.618")
p17 = plot(lower_5, color=white, linewidth=1, title="0.764")
p18 = plot(lower_6, color=green, linewidth=2, title="1")

window1 = input(title='lookback window 1:',  defval=8)
window2 = input(title='lookback window 2:',  defval=21)

top1 = valuewhen(high >= highest(high, window1), high, 0)
bot1 = valuewhen(low <= lowest(low, window1), low, 0)
top2 = valuewhen(high >= highest(high, window2), high, 0)
bot2 = valuewhen(low <= lowest(low, window2), low, 0)

t1 = plot(top1, color=top1 != top1[1] ? na : black)
b1 = plot(bot1, color=bot1 != bot1[1] ? na : black)
t2 = plot(top2, color=top2 != top2[1] ? na : black)
b2 = plot(bot2, color=bot2 != bot2[1] ? na : black)

fill(t1, t2, color=orange, transp=80)
fill(b1, b2, color=olive, transp=80)

//inputs
h_left = input(title="H left",  defval=10)
h_right = input(title="H right",  defval=10)
sample_period = input(title="Sample bars for % TZ",  defval=5000)
show_ptz = input(title="Show PTZ", type=bool, defval=true)
show_channel = input(title="Show channel", type=bool, defval=true)

h_left_low = lowest(h_left)
h_left_high = highest(h_left)
newlow = low <= h_left_low
newhigh = high >= h_left_high
plotshape(newlow and show_ptz, style=shape.triangledown, location=location.belowbar, color=red)
plotshape(newhigh and show_ptz, style=shape.triangleup, location=location.abovebar, color=green)
channel_high = plot(show_channel ? h_left_low : 0, color=silver)
channel_low = plot (show_channel ? h_left_high : 0, color=silver)

central_bar_low = low[h_right + 1]
central_bar_high = high[h_right + 1]
full_zone_low = lowest(h_left + h_right + 1)
full_zone_high = highest(h_left + h_right + 1)
central_bar_is_highest = central_bar_high >= full_zone_high
central_bar_is_lowest = central_bar_low <= full_zone_low
plotarrow(central_bar_is_highest ? -1 : 0, offset=-h_right-1)
plotarrow(central_bar_is_lowest ? 1 : 0, offset=-h_right-1)

x = central_bar_is_highest ? 1 : 0
high_bar_tz_count = cum(x)

y = central_bar_is_lowest ? 1 : 0
low_bar_tz_count = cum(y)

total_tz = high_bar_tz_count + low_bar_tz_count
percent_tz_high = (high_bar_tz_count / sample_period) * 100
//plot(percent_tz_high, color = lime, transp=100)
percent_tz_low = (low_bar_tz_count / sample_period) * 100
//plot(low_bar_tz_count, color=red, transp=100)
percent_total_tz = (percent_tz_high + percent_tz_low)
plot(percent_total_tz, color=black, transp=100)

//PTZ probability calc
i = newhigh ? 1 : 0
high_bar_ptz_count = cum(i)

j = newlow ? 1 : 0
low_bar_ptz_count = cum(j)

total_ptz = high_bar_ptz_count + low_bar_ptz_count
percent_ptz_high = (high_bar_ptz_count / sample_period) * 100
//plot(percent_ptz_high, color=green, transp=100)
percent_ptz_low = (low_bar_ptz_count / sample_period) * 100
//plot(percent_ptz_low, color=maroon, transp=100)
percent_total_ptz = (percent_ptz_high + percent_ptz_low)
plot(percent_total_ptz, color=navy,  transp=100)

//PTZ resolving probability calc
percent_ptz_resolved = (1 - (total_tz / total_ptz)) * 100
plot(percent_ptz_resolved, color=gray,  transp=100)


devUp1 = input(1.28, title="Stdev above (1)")
devDn1 = input(1.28, title="Stdev below (1)")

devUp2 = input(2.01, title="Stdev above (2)")
devDn2 = input(2.01, title="Stdev below (2)")

devUp3 = input(2.51, title="Stdev above (3)")
devDn3 = input(2.51, title="Stdev below (3)")

devUp4 = input(3.09, title="Stdev above (4)")
devDn4 = input(3.09, title="Stdev below (4)")

devUp5 = input(4.01, title="Stdev above (5)")
devDn5 = input(4.01, title="Stdev below (5)")
showBcol = input(true, title="Turn Barcolor ON/OFF?")
showDv2 = input(true, type=bool, title="Show second group of bands?")
showDv3 = input(true, type=bool, title="Show third group of bands?")
showDv4 = input(false, type=bool, title="Show fourth group of bands?")
showDv5 = input(false, type=bool, title="Show fifth group of bands?")

showPrevVWAP = input(false, type=bool, title="Show previous VWAP close")
ColorSrc=input(close)
price=ColorSrc
start = request.security(syminfo.tickerid, "W", time)

newSession = iff(change(start), 1, 0)

vwapsum = iff(newSession, hl2*volume, vwapsum[1]+hl2*volume)
volumesum = iff(newSession, volume, volumesum[1]+volume)
v2sum = iff(newSession, volume*hl2*hl2, v2sum[1]+volume*hl2*hl2)
myvwap = vwapsum/volumesum
dev9 = sqrt(max(v2sum/volumesum - myvwap*myvwap, 0))

A=plot(myvwap,style=circles, title="VWAP", color=black)
U1=plot(myvwap + devUp1 * dev9,style=circles, title="VWAP Upper", color=gray)
D1=plot(myvwap - devDn1 * dev9, style=circles, title="VWAP Lower", color=gray)

myvwapu1= myvwap + devUp1 * dev9
myvwapd1= myvwap - devDn1 * dev9

U2=plot(showDv2 ? myvwap + devUp2 * dev9 : na, color=red, title="VWAP Upper (2)")
D2=plot(showDv2 ? myvwap - devDn2 * dev9 : na, color=green, title="VWAP Lower (2)")

myvwapu2= myvwap + devUp2 * dev9
myvwapu3= myvwap + devUp3 * dev9
myvwapd2= myvwap - devDn2 * dev9
myvwapd3= myvwap - devDn3 * dev9

U3=plot(showDv3 ? myvwap + devUp3 * dev9 : na, title="VWAP Upper (3)", color=red)
D3=plot(showDv3 ? myvwap - devDn3 * dev9 : na, title="VWAP Lower (3)", color=green)

myvwapu4= myvwap + devDn4 * dev9
myvwapd4= myvwap - devDn4 * dev9

U4=plot(showDv4 ? myvwap + devUp4 * dev9 : na, title="VWAP Upper (4)", color=red)
D4=plot(showDv4 ? myvwap - devDn4 * dev9 : na, title="VWAP Lower (4)", color=green)

U5=plot(showDv5 ? myvwap + devUp5 * dev9 : na, title="VWAP Upper (5)", color=red)
D5=plot(showDv5 ? myvwap - devDn5 * dev9 : na, title="VWAP Lower (5)", color=green)

prevwap = iff(newSession, myvwap[1], prevwap[1])

plot(showPrevVWAP ? prevwap : na, style=circles, color=close > prevwap ? green : red)

ColorMiddleU = price > myvwap and price < myvwapu2 ? white:na
ColorMiddleD = price > myvwapd1 and price < myvwap ? black:na

ColorDv1d = price > myvwapd2 and price < myvwapd1 ? gray:na
ColorDv1u = price > myvwapu1 and price < myvwapu2 ? gray:na

ColorDv2d = price > myvwapd3 and price < myvwapd2 ? green:na
ColorDv2u = price > myvwapu2 and price < myvwapu3 ? maroon:na

ColorDv3d = price > myvwapd4 and price < myvwapd3 ? lime:na
ColorDv3u = price > myvwapu3 and price < myvwapu4 ? red:na

barcolor(showBcol?ColorMiddleD:na, title="BarColor vwap-1 Lower")
barcolor(showBcol?ColorMiddleU:na, title="BarColorColor vwap-1 upper")
barcolor(showBcol?ColorDv1d:na, title="BarColor 1-2 Lower")
barcolor(showBcol?ColorDv1u:na, title="BarColorColor 1-2 upper")
barcolor(showBcol?ColorDv2d:na, title="BarColor 2-3 Lower")
barcolor(showBcol?ColorDv2u:na, title="BarColorColor 2-3 upper")
barcolor(showBcol?ColorDv3d:na, title="BarColor 3-4 Lower")
barcolor(showBcol?ColorDv3u:na, title="BarColorColor 3-4 upper")

fill(U1, U2, color=red, transp=90, title="Over Bought Fill 1")
fill(D1, D2, color=green, transp=90, title="Over Sold Fill 1")
fill(U2, U3, color=red, transp=90, title="Over Bought Fill 2")
fill(D2, D3, color=green, transp=90, title="Over Sold Fill 2")
fill(U3, U4, color=red, transp=90, title="Over Bought Fill 3")
fill(D3, D4, color=green, transp=90, title="Over Sold Fill 3")
fill(U4, U5, color=red, transp=90, title="Over Bought Fill 4")
fill(D4, D5, color=green, transp=90, title="Over Sold Fill 4")
fill(A, U1, color=gray, transp=90, title="Middle Fill Up")
fill(A, D1, color=gray, transp=90, title="Middle Fill Down")

//Created By ChrisMoody on 7/25/2014
//Simply Enhances Default Parabolic SAR by creating Two Color Options, One for UpTrend, Other for DownTrend
//Ability To Turn On/Off The Up Trending Parabolic SAR, And The Down Trending Parabolic SARstudy(title="CM_Parabolic SAR", shorttitle="CM_P-SAR", overlay=true)
start1 = input(2, minval=0, maxval=10, title="Start1 - Default = 2 - Multiplied by .01")
increment = input(2, minval=0, maxval=10, title="Step Setting (Sensitivity) - Default = 2 - Multiplied by .01" )
maximum = input(2, minval=1, maxval=10, title="Maximum Step (Sensitivity) - Default = 2 - Multiplied by .10")
sus = input(true, "Show Up Trending Parabolic Sar")
sds = input(true, "Show Down Trending Parabolic Sar")
disc = input(false, title="Start1 and Step settings are *.01 so 2 = .02 etc, Maximum Step is *.10 so 2 = .2")

startCalc = start1 * .01
incrementCalc = increment * .01
maximumCalc = maximum * .10

sarUp = sar(startCalc, incrementCalc, maximumCalc)
sarDown = sar(startCalc, incrementCalc, maximumCalc)

colUp = close >= sarDown ? lime : na
colDown = close <= sarUp ? red : na

plot(sus and sarUp ? sarUp : na, title="Up Trending SAR", style=circles, linewidth=4,color=colUp)
plot(sds and sarDown ? sarDown : na, title="Up Trending SAR", style=circles, linewidth=4,color=colDown)

TurtleSpeed = input(6, minval=1)

FastSpeed = highest(TurtleSpeed)
SlowSpeed = lowest(TurtleSpeed)

enterLong = high > FastSpeed[1]
enterShort = low < SlowSpeed[1]

strategy.entry("Long", strategy.long, when = enterLong)
strategy.entry("Short", strategy.short, when = enterShort)