概述
双重反转动点指数均线策略是一种结合反转交易和动态支撑阻力的策略。它利用斯托克指标判断市场反转点,并结合当日的高低价及收盘价计算动态支撑阻力位,在两种策略信号同时发出买入或卖出信号时下单。该策略适用于中短线交易。
策略原理
反转策略
反转策略基于该原理:当市场被高估或低估时,价格往往会反转回价值区间。具体来说,该反转策略是参考Ulf Jensen的规则:
当收盘价连续2天高于之前收盘价,且9日Slow K线低于50时,做多;当收盘价连续2天低于之前收盘价,且9日Fast K线高于50时,做空。
动态支撑阻力策略
动态支撑阻力策略每日根据前一日的最高价、最低价及收盘价计算当日的支撑阻力位。计算方法为:
中枢点=(最高价+最低价+收盘价)/3
支撑1=中枢点-(最高价-中枢点)
阻力1=中枢点+(中枢点-最低价)
当日收盘价高于阻力1线时做多,当日收盘价低于支撑1线时做空。
双重信号
该策略结合反转策略和动态支撑阻力策略。只有两者信号同时发出,才会下单。这样可以过滤掉部分噪声交易,提高稳定性。
优势分析
双重反转动点指数均线策略最大的优势是结合了反转策略和动态支撑阻力策略的优点,可以在市场转折点捕捉较大行情,同时也可以根据当日价格与关键点的关系判断方向。相比单一策略,它可以过滤部分噪声交易,提高稳定性。
另外,该策略参数较少,容易实现和优化。
风险分析
双重反转动点指数均线策略也存在以下风险:
反转失败风险。市场价格可能出现超扩张,反转信号发出后,价格继续运行而没有实质性反转。
支撑阻力被突破的风险。当日价格可能突破计算出的支撑或阻力位,从而产生错误信号。
双重信号过于保守,错过行情的风险。双重信号机制可能过滤掉较多交易机会。
对策:
适当调整参数, identification of key support and resistance levels.
使用Stop Loss来控制亏损。
适当调整双重信号规则,保留更多交易机会。
优化方向
该策略可以从以下几个方面进行优化:
测试不同的斯托克指标参数,识别反转信号的灵敏度。
测试不同的均线系统 Tracking longer term trends.
添加其他因素判断市场结构,例如交易量能量指标。
优化双重信号规则,允许更多交易机会。
添加止损策略来控制风险。
总结
双重反转动点指数均线策略结合反转交易和动态支撑阻力判断,在市场转折点可获利较大,同时也可根据当日价格与关键点关系判断趋势方向。相比单一策略,它可以过滤噪声,稳定性更好。该策略可适当优化参数,测试其他指标等来提高效果。
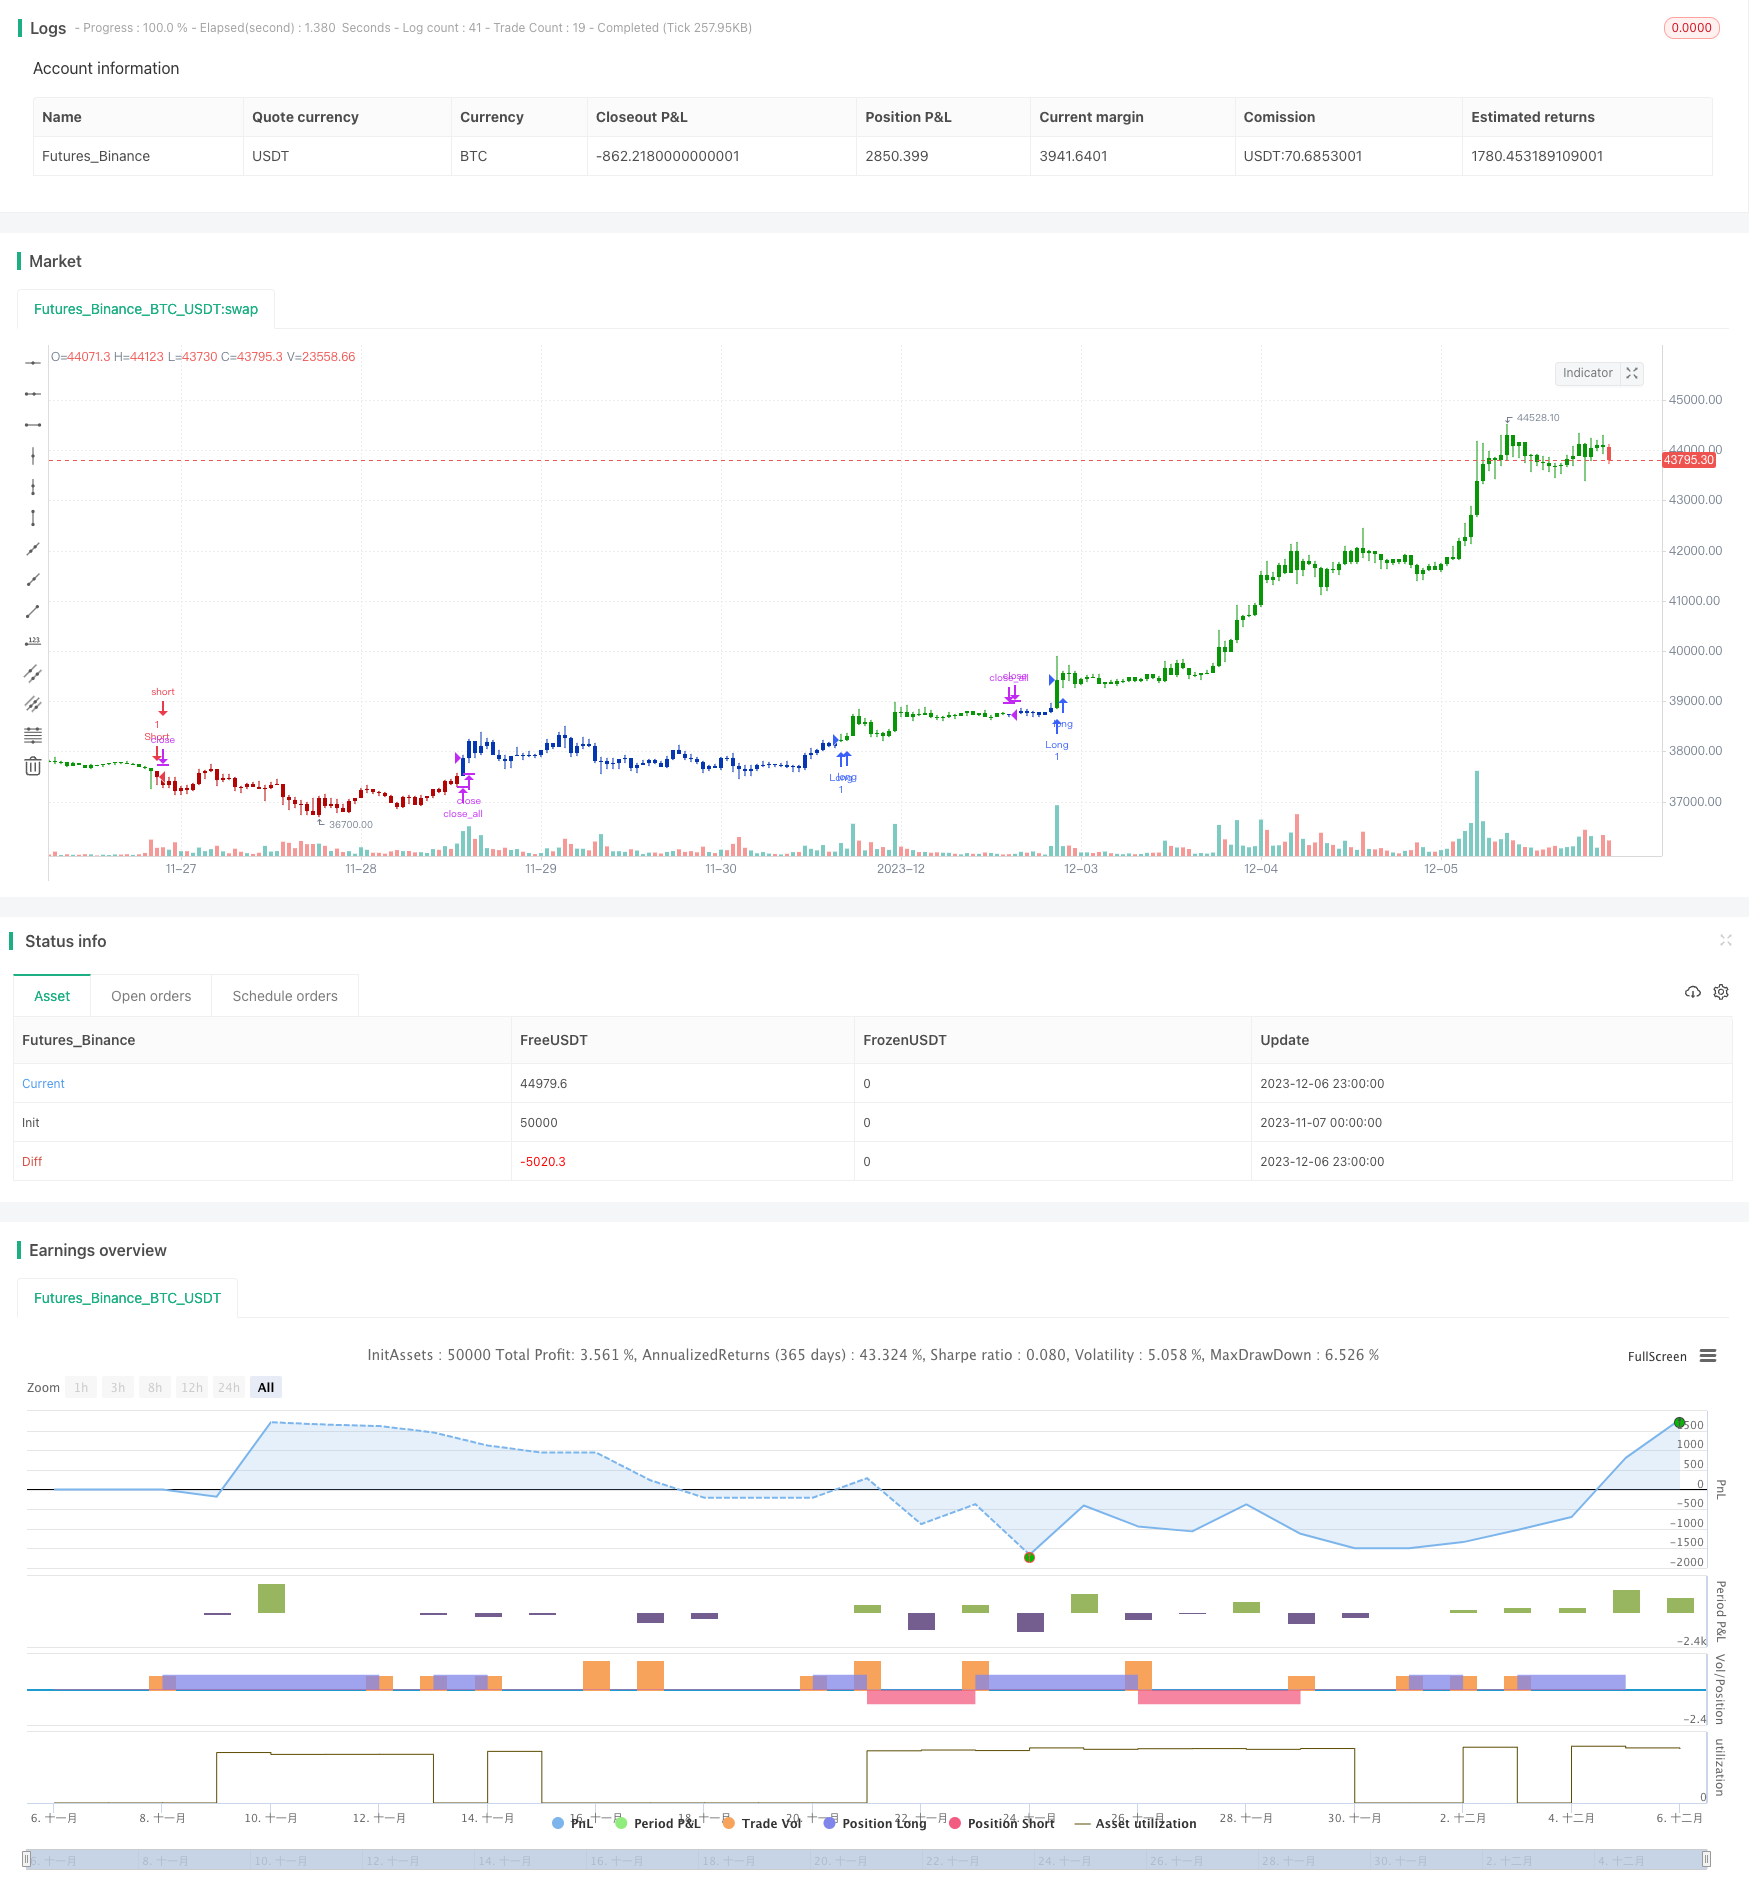
/*backtest
start: 2023-11-07 00:00:00
end: 2023-12-07 00:00:00
period: 1h
basePeriod: 15m
exchanges: [{"eid":"Futures_Binance","currency":"BTC_USDT"}]
*/

//@version=4
////////////////////////////////////////////////////////////
//  Copyright by HPotter v1.0 25/03/2020
// This is combo strategies for get a cumulative signal.
//
// First strategy
// This System was created from the Book "How I Tripled My Money In The
// Futures Market" by Ulf Jensen, Page 183. This is reverse type of strategies.
// The strategy buys at market, if close price is higher than the previous close
// during 2 days and the meaning of 9-days Stochastic Slow Oscillator is lower than 50.
// The strategy sells at market, if close price is lower than the previous close price
// during 2 days and the meaning of 9-days Stochastic Fast Oscillator is higher than 50.
//
// Second strategy
// This Pivot points is calculated on the current day.
// Pivot points simply took the high, low, and closing price from the previous period and
// divided by 3 to find the pivot. From this pivot, traders would then base their
// calculations for three support, and three resistance levels. The calculation for the most
// basic flavor of pivot points, known as ‘floor-trader pivots’, along with their support and
// resistance levels.
//
// WARNING:
// - For purpose educate only
// - This script to change bars colors.
////////////////////////////////////////////////////////////
Reversal123(Length, KSmoothing, DLength, Level) =>
    vFast = sma(stoch(close, high, low, Length), KSmoothing)
    vSlow = sma(vFast, DLength)
    pos = 0.0
    pos := iff(close[2] < close[1] and close > close[1] and vFast < vSlow and vFast > Level, 1,
	         iff(close[2] > close[1] and close < close[1] and vFast > vSlow and vFast < Level, -1, nz(pos[1], 0)))
	pos

DPP() =>
    pos = 0
    xHigh  = security(syminfo.tickerid,"D", high[1])
    xLow   = security(syminfo.tickerid,"D", low[1])
    xClose = security(syminfo.tickerid,"D", close[1])
    vPP = (xHigh+xLow+xClose) / 3
    vR1 = vPP+(vPP-xLow)
    vS1 = vPP-(xHigh - vPP)
    pos := iff(close > vR1, 1,
             iff(close < vS1, -1, nz(pos[1], 0)))
    pos

strategy(title="Combo Backtest 123 Reversal & Dynamic Pivot Point", shorttitle="Combo", overlay = true)
Length = input(14, minval=1)
KSmoothing = input(1, minval=1)
DLength = input(3, minval=1)
Level = input(50, minval=1)
//-------------------------
reverse = input(false, title="Trade reverse")
posReversal123 = Reversal123(Length, KSmoothing, DLength, Level)
posDPP = DPP()
pos = iff(posReversal123 == 1 and posDPP == 1 , 1,
	   iff(posReversal123 == -1 and posDPP == -1, -1, 0))
possig = iff(reverse and pos == 1, -1,
          iff(reverse and pos == -1 , 1, pos))
if (possig == 1)
    strategy.entry("Long", strategy.long)
if (possig == -1)
    strategy.entry("Short", strategy.short)
if (possig == 0)
    strategy.close_all()
barcolor(possig == -1 ? #b50404: possig == 1 ? #079605 : #0536b3 )