概述
本策略主要基于Stochastic Momentum Index(SMI)和相对强弱指数(RSI)这两大指标。此外还加入了颜色过滤器和K线实体过滤器作为辅助判断条件。依据SMI和RSI指标的多空信号,结合过滤条件发出交易信号。该策略可以有效发现市场中的短线交易机会。
策略原理
本策略核心依赖 SMI 和 RSI 两个指标进行判断。其中 SMI 主要判断股票是否超买超卖,RSI 则判断股票的相对强弱。当两者同时给出买入信号时,进行买入操作。具体逻辑如下:
- SMI 超卖(低于下限),视为买入信号
- RSI 低于阈值,视为买入信号
- 当 SMI 超卖和 RSI 同时低于对应的阈值时,发出买入信号
- 空头信号判断逻辑类似
此外,本策略还设置了双signals模式。该模式要求SMI和RSI必须同时发出信号才进行交易。这可以有效减少假信号。
另外,本策略还加入颜色过滤器和K线实体过滤器。这两个过滤器要求K线实体较大,并且最后一个K线的收盘价高于开盘价。这可以进一步避免交易假突破。
策略优势
- 利用SMI判断是否超买超卖,RSI判断相对强弱,双重确认可以减少假信号
- 设置双信号模式,可以大幅减少无效交易
- 颜色过滤器和K线实体过滤器可有效过滤假突破
- 策略运行逻辑清晰简单
- 大部分参数都可自定义设置
策略风险及优化
- SMI和RSI作为单独指标使用时,可能会产生较多假信号,需谨慎看待
- 双信号模式下,如果参数设定不当,可能错过较好的交易机会
- 可测试不同周期参数下策略收益情况,寻找最佳参数组合
- 可通过模拟或回测评估具体阈值参数的设定
- 可考虑结合更多过滤器优化策略
总结
本策略整合了SMI和RSI两个指标的信号,通过双重确认发出交易指令。同时设置颜色过滤器和K线实体过滤器可过滤假突破。该策略运行逻辑简单清晰,大部分参数可自定义设置。通过参数调整可获得更好的策略收益表现。
策略源码
/*backtest
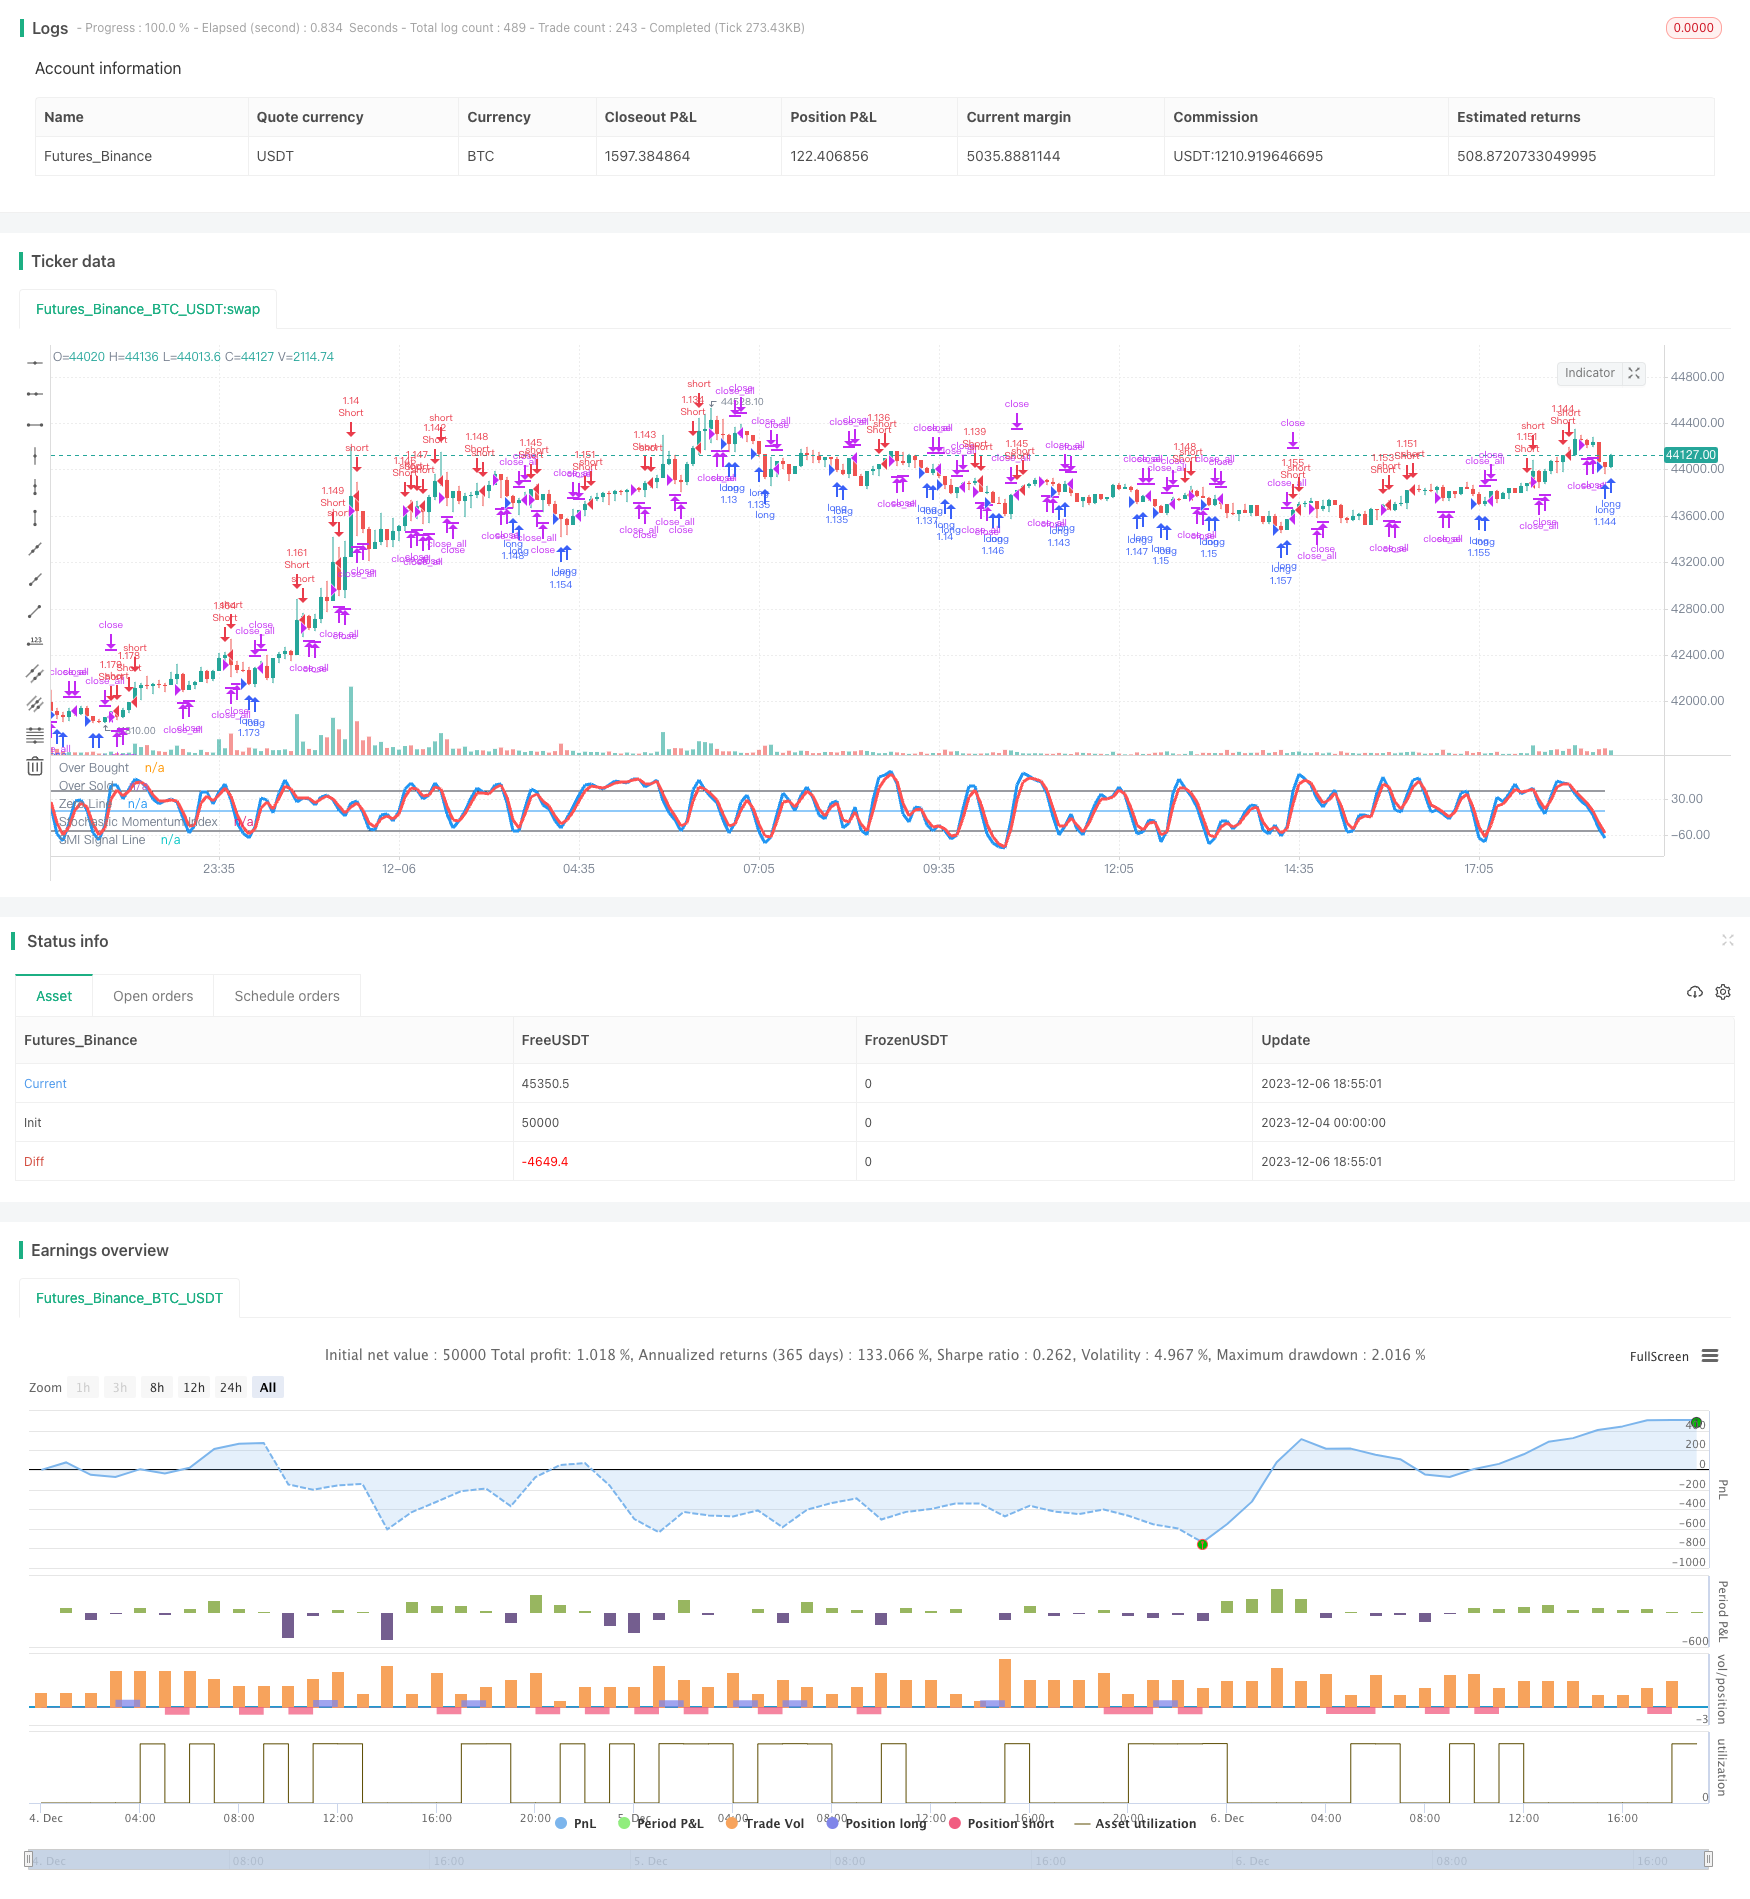
start: 2023-12-04 00:00:00
end: 2023-12-06 19:00:00
period: 5m
basePeriod: 1m
exchanges: [{"eid":"Futures_Binance","currency":"BTC_USDT"}]
*/
//Noro
//2018
//@version=2
strategy(title = "Noro's Stochastic Strategy v1.3", shorttitle = "Stochastic str 1.3", overlay = false, default_qty_type = strategy.percent_of_equity, default_qty_value = 100, pyramiding = 0)
//Settings
needlong = input(true, defval = true, title = "Long")
needshort = input(true, defval = true, title = "Short")
usemar = input(false, defval = false, title = "Use Martingale")
capital = input(100, defval = 100, minval = 1, maxval = 10000, title = "Capital, %")
usesmi = input(true, defval = true, title = "Use SMI Strategy")
usersi = input(true, defval = true, title = "Use RSI Strategy")
usecol = input(true, defval = true, title = "Use Color-Filter")
usebod = input(true, defval = true, title = "Use Body-Filter")
a = input(2, defval = 2, minval = 2, maxval = 50, title = "SMI Percent K Length")
b = input(2, defval = 2, minval = 2, maxval = 50, title = "SMI Percent D Length")
limitsmi = input(50, defval = 50, minval = 1, maxval = 100, title = "SMI Limit")
periodrsi = input(2, defval = 2, minval = 2, maxval = 50, title = "RSI Period")
limitrsi = input(10, defval = 10, minval = 1, maxval = 50, title = "RSI Limit")
double = input(false, defval = false, title = "SMI+RSI Mode")
showbg = input(false, defval = false, title = "Show background")
fromyear = input(2018, defval = 2018, minval = 1900, maxval = 2100, title = "From Year")
toyear = input(2100, defval = 2100, minval = 1900, maxval = 2100, title = "To Year")
frommonth = input(01, defval = 01, minval = 01, maxval = 12, title = "From Month")
tomonth = input(12, defval = 12, minval = 01, maxval = 12, title = "To Month")
fromday = input(01, defval = 01, minval = 01, maxval = 31, title = "From day")
today = input(31, defval = 31, minval = 01, maxval = 31, title = "To day")
//Fast RSI
fastup = rma(max(change(close), 0), periodrsi)
fastdown = rma(-min(change(close), 0), periodrsi)
fastrsi = fastdown == 0 ? 100 : fastup == 0 ? 0 : 100 - (100 / (1 + fastup / fastdown))
//Stochastic Momentum Index
ll = lowest (low, a)
hh = highest (high, a)
diff = hh - ll
rdiff = close - (hh+ll)/2
//avgrel = ema(ema(rdiff,b),b)
//avgdiff = ema(ema(diff,b),b)
avgrel = sma(sma(rdiff,b),b)
avgdiff = sma(sma(diff,b),b)
SMI = avgdiff != 0 ? (avgrel/(avgdiff/2)*100) : 0
SMIsignal = ema(SMI,b)
//Lines
plot(SMI, color = blue, linewidth = 3, title = "Stochastic Momentum Index")
plot(SMIsignal, color = red, linewidth = 3, title = "SMI Signal Line")
plot(limitsmi, color = black, title = "Over Bought")
plot(-1 * limitsmi, color = black, title = "Over Sold")
plot(0, color = blue, title = "Zero Line")
//Color-Filter
gb = close > open or usecol == false
rb = close < open or usecol == false
//Body Filter
nbody = abs(close - open)
abody = sma(nbody, 10)
body = nbody > abody / 3 or usebod == false
//Signals
up1 = SMI < -1 * limitsmi and rb and body and usesmi
dn1 = SMI > limitsmi and gb and body and usesmi
up2 = fastrsi < limitrsi and rb and body and usersi
dn2 = fastrsi > 100 - limitrsi and gb and body and usersi
exit = ((strategy.position_size > 0 and close > open) or (strategy.position_size < 0 and close < open)) and body
//Background
redb = (SMI > limitsmi and usesmi) or (fastrsi > 100 - limitrsi and usersi)
limeb = (SMI < -1 * limitsmi and usesmi) or (fastrsi < limitrsi and usersi)
col = showbg == false ? na : redb ? red : limeb ? lime : na
bgcolor(col, transp = 50)
//Trading
profit = exit ? ((strategy.position_size > 0 and close > strategy.position_avg_price) or (strategy.position_size < 0 and close < strategy.position_avg_price)) ? 1 : -1 : profit[1]
mult = usemar ? exit ? profit == -1 ? mult[1] * 2 : 1 : mult[1] : 1
lot = strategy.position_size == 0 ? strategy.equity / close * capital / 100 * mult : lot[1]
signalup = ((up1 or up2) and double == false) or (up1 and up2 and double)
if signalup
if strategy.position_size < 0
strategy.close_all()
strategy.entry("long", strategy.long, needlong == false ? 0 : lot, when=(time > timestamp(fromyear, frommonth, fromday, 00, 00) and time < timestamp(toyear, tomonth, today, 23, 59)))
signaldn = ((dn1 or dn2) and double == false) or (dn1 and dn2 and double)
if signaldn
if strategy.position_size > 0
strategy.close_all()
strategy.entry("Short", strategy.short, needshort == false ? 0 : lot, when=(time > timestamp(fromyear, frommonth, fromday, 00, 00) and time < timestamp(toyear, tomonth, today, 23, 59)))
if time > timestamp(toyear, tomonth, today, 23, 59) or exit
strategy.close_all()