概述
一云双提前知机会均线趋势跟踪策略是一种基于人气指标一云图的趋势跟踪策略。该策略利用一云图的转折线提前发出买卖信号,实现趋势的提前捕捉。同时,策略还融合了均线的趋势判断,进行多层确认,避免假突破。
策略原理
该策略主要基于以下几个要点:
使用转化线(Conversion Line)和基准线(Base Line)构建一云图,并以26周期的位移绘制云图。
当收盘价突破云图上轨时,发出买入信号;当收盘价跌破云图下轨时,发出卖出信号。
为过滤假突破,要求当前收盘价同时突破转化线和基准线的最大值和最小值。
止损线设置为入场价的5%,可关闭。
通过这样的多重过滤,可以有效识别趋势转折点,及时捕捉新的交易机会。同时严格的突破过滤也可以减少假信号的发出。
策略优势
这种策略有以下几个优势:
- 一云图转折线有明显的提前特征,可以较早捕捉到趋势的转折。
- 融合均线判断,避免了隔夜gaps造成的假突破。
- 多重条件过滤,可以减少假信号,提高信号质量。
- 长线操作,回撤相对较小,容易寻找止盈位置。
- 可适用于不同品种,特别适合趋势品种。
策略风险
该策略也存在以下一些风险:
- 趋势市场适用性更好,盘整市场会增加假信号。
- 一云图参数设置会影响效果,需要针对不同品种进行优化。
- 止损位置设置需要谨慎,避免被套。
- 信号频率偏低,容易错过短线机会。
可以通过以下方法减少风险:
- 选择趋势明显的品种,避免交易盘整品种。
- 优化一云图参数,针对不同周期确定最佳参数组合。
- 采用移动止损或及时止损,控制单笔损失。
- 可以结合其他指标,增加信号释放频率。
策略优化
该策略还可以从以下几个方面进行优化:
增加仓位管理机制,通过运算符如
strategy.position_size控制建仓比例。增加品种过滤,通过
security()过滤品种池,自动识别趋势程度。增加止损止盈策略,设置移动止损或部分止盈,进一步控制风险。
结合其他指标,如布林线、RSI等,构建多指标交易系统,提高信号质量。
应用机器学习方法,通过训练判断买卖信号的可靠性,动态调整下单数量。
总结
一云双提前知机会均线趋势跟踪策略通过一云图实现趋势的提前判断,再融合均线多层过滤器,可以有效识别高质量交易机会。策略较为稳健,优化空间大,可广泛应用于实盘交易。
策略源码
/*backtest
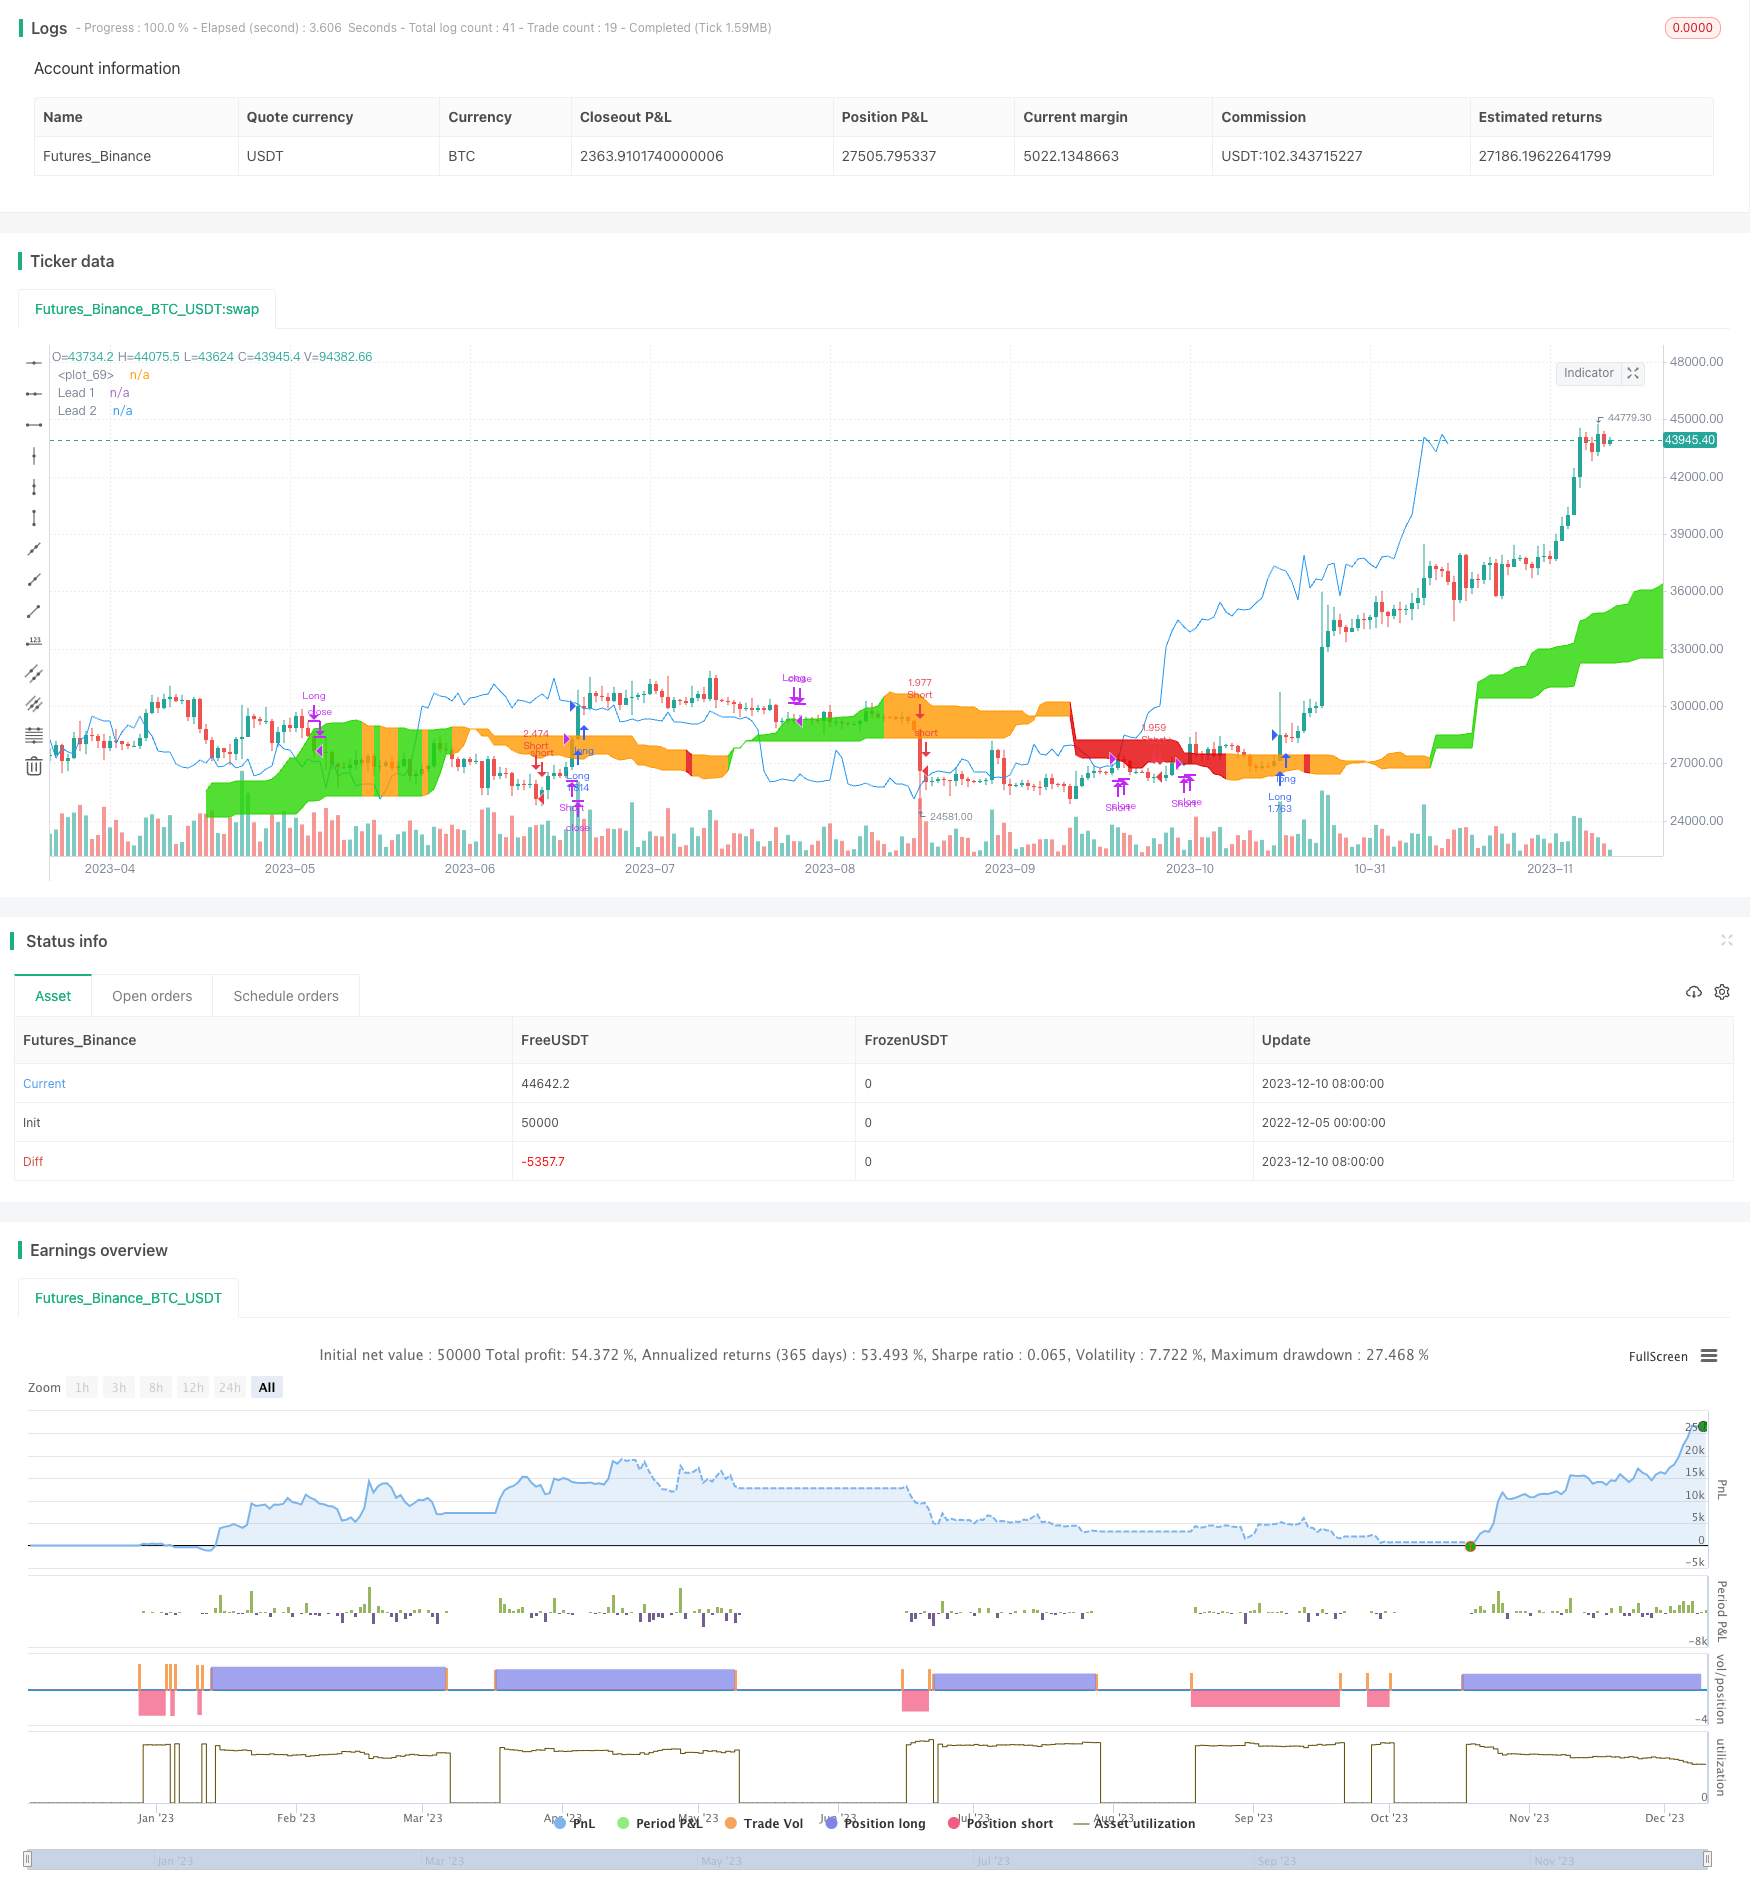
start: 2022-12-05 00:00:00
end: 2023-12-11 00:00:00
period: 1d
basePeriod: 1h
exchanges: [{"eid":"Futures_Binance","currency":"BTC_USDT"}]
*/
// This source code is subject to the terms of the Mozilla Public License 2.0 at https://mozilla.org/MPL/2.0/
// © QuantCT
//@version=4
strategy("Ichimoku Cloud Strategy Idea",
shorttitle="Ichimoku",
overlay=true,
pyramiding=0,
default_qty_type=strategy.percent_of_equity,
default_qty_value=99,
initial_capital=1000,
commission_type=strategy.commission.percent,
commission_value=0.1)
// ____ Inputs
conversion_period = input(9, minval=1, title="Conversion Line Period")
base_period = input(26, minval=1, title="Base Line Period")
lagging_span2_period = input(52, minval=1, title="Lagging Span 2 Period")
displacement = input(26, minval=1, title="Displacement")
long_only = input(title="Long Only", defval=false)
slp = input(title="Stop-loss (%)", minval=1.0, maxval=25.0, defval=5.0)
use_sl = input(title="Use Stop-Loss", defval=false)
// ____ Logic
donchian(len) => avg(lowest(len), highest(len))
conversion_line = donchian(conversion_period)
base_line = donchian(base_period)
lead_line1 = avg(conversion_line, base_line)
lead_line2 = donchian(lagging_span2_period)
chikou = close
chikou_free_long = close > high[displacement] and close > max(lead_line1[2 * displacement], lead_line2[2 * displacement])
enter_long = chikou_free_long and close > max(lead_line1[displacement], lead_line2[displacement])
exit_long = close < lead_line1[displacement] or close < lead_line2[displacement]
chikou_free_short = close < low[displacement] and close < min(lead_line1[2 * displacement], lead_line2[2 * displacement])
enter_short = chikou_free_short and close < min(lead_line1[displacement], lead_line2[displacement])
exit_short = close > lead_line1[displacement] or close > lead_line2[displacement]
strategy.entry("Long", strategy.long, when=enter_long)
strategy.close("Long", when=exit_long)
if (not long_only)
strategy.entry("Short", strategy.short, when=enter_short)
strategy.close("Short", when=exit_short)
// ____ SL
sl_long = strategy.position_avg_price * (1- (slp/100))
sl_short = strategy.position_avg_price * (1 + (slp/100))
if (use_sl)
strategy.exit(id="SL", from_entry="Long", stop=sl_long)
strategy.exit(id="SL", from_entry="Short", stop=sl_short)
// ____ Plots
colors =
enter_long ? #27D600 :
enter_short ? #E30202 :
color.orange
p1 = plot(lead_line1, offset = displacement, color=colors,
title="Lead 1")
p2 = plot(lead_line2, offset = displacement, color=colors,
title="Lead 2")
fill(p1, p2, color = colors)
plot(chikou, offset = -displacement, color=color.blue)