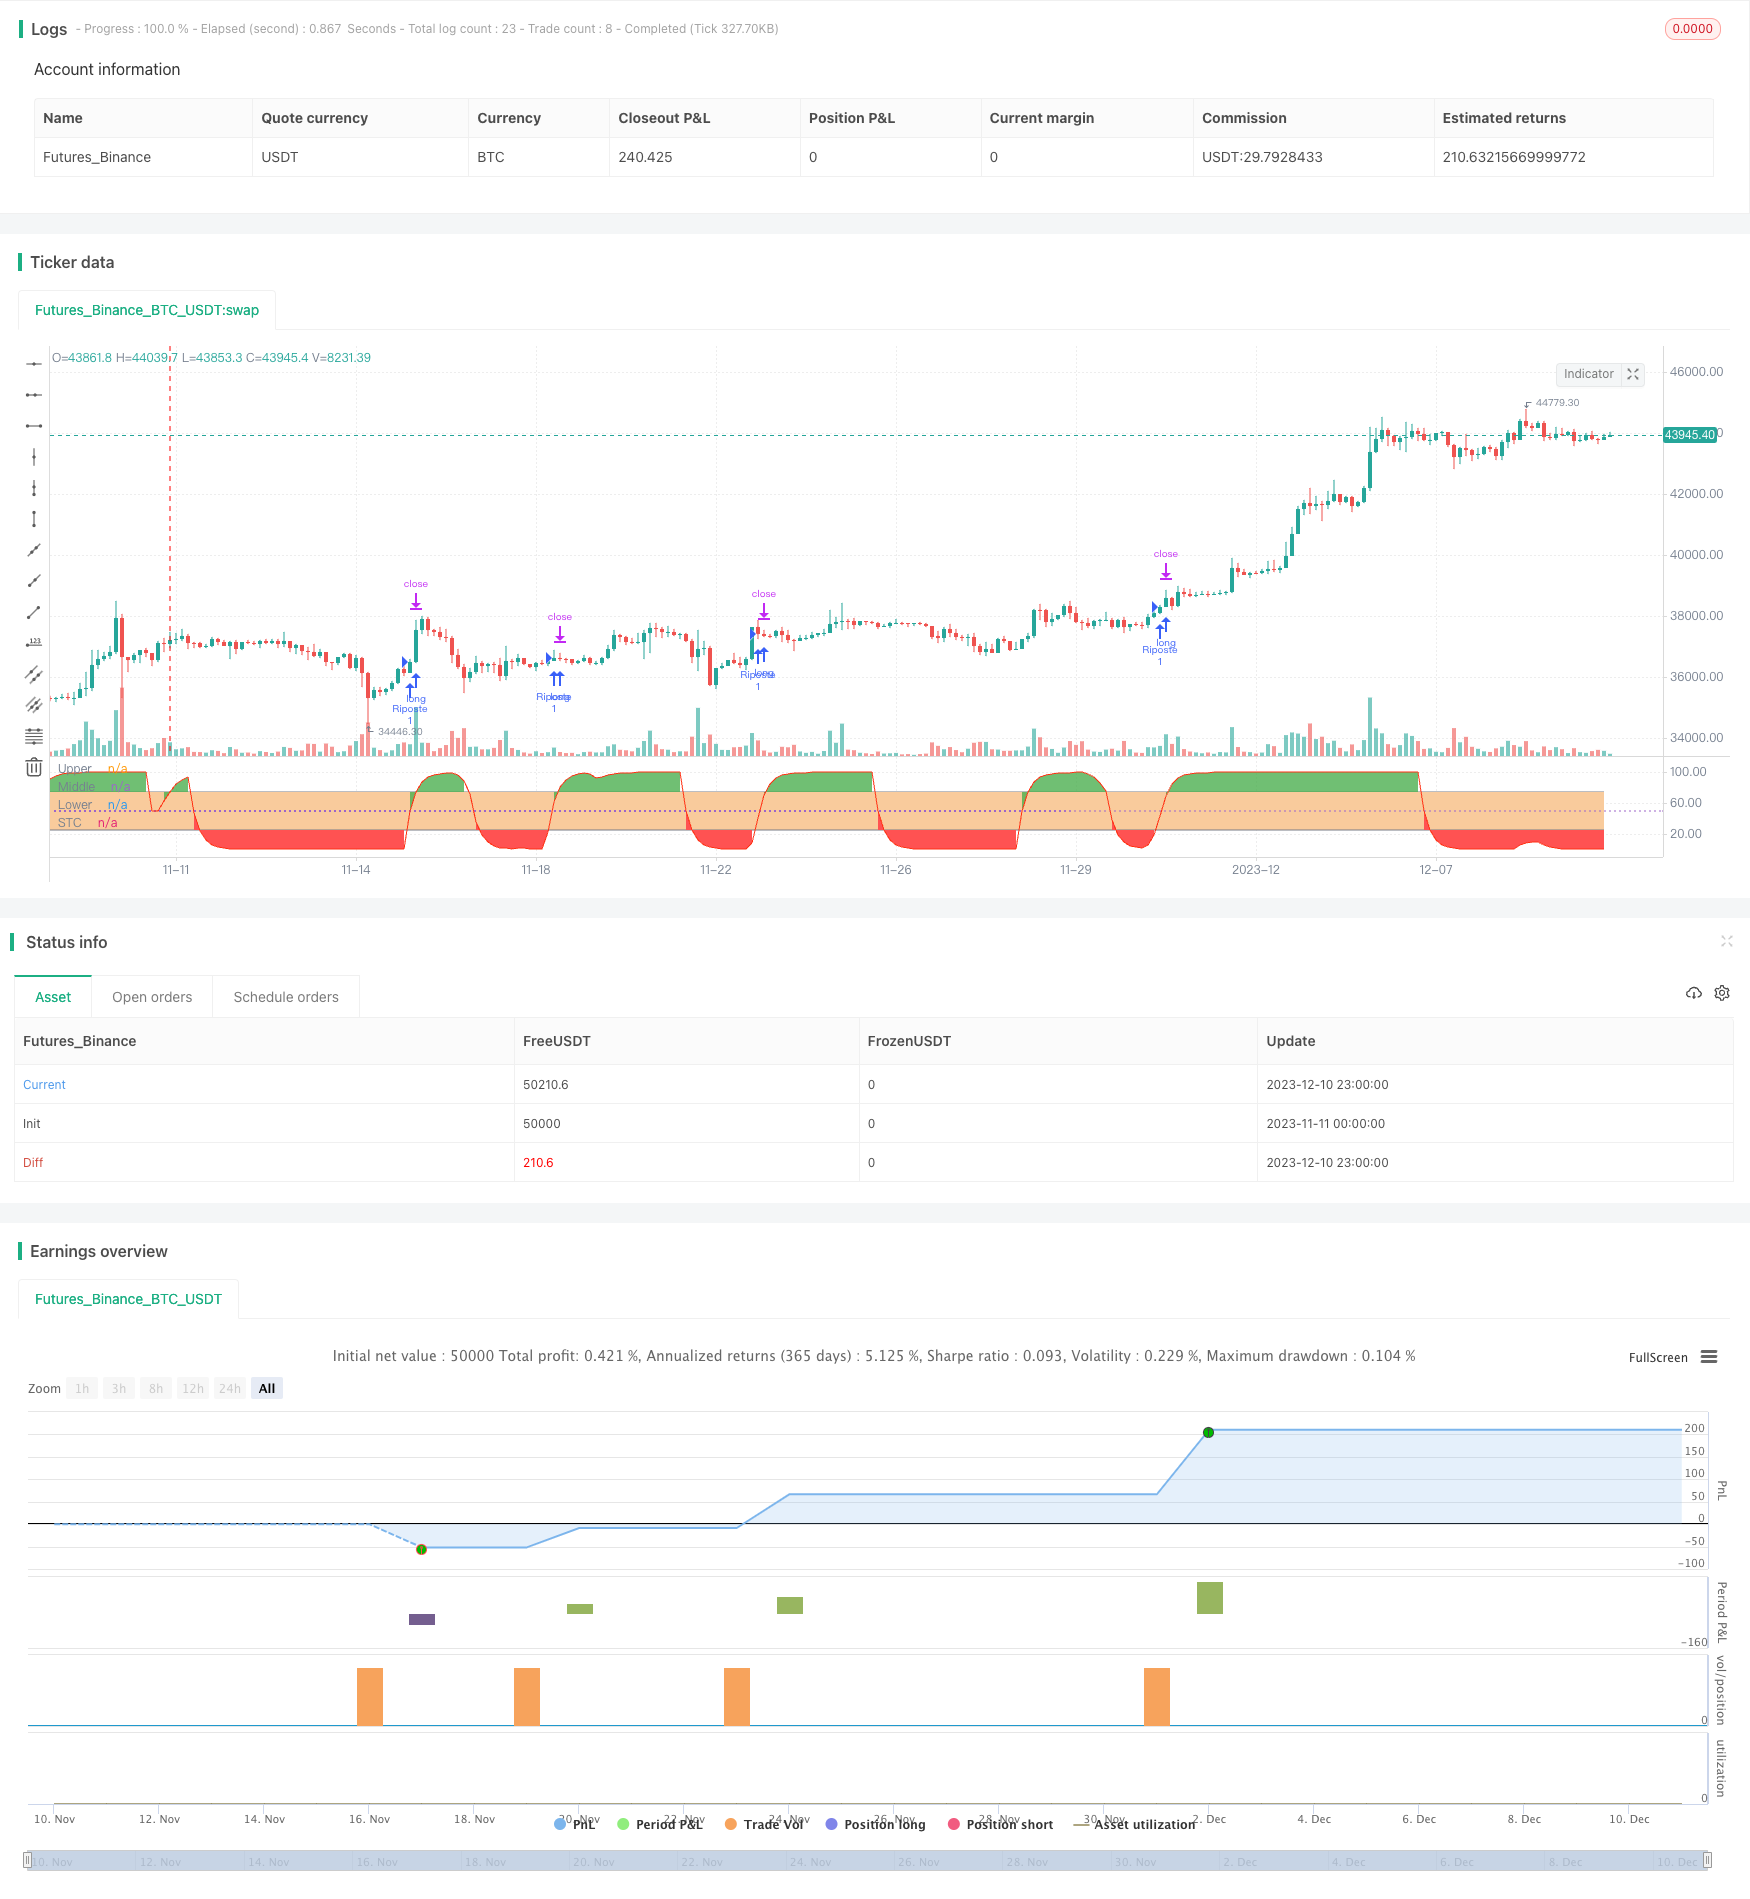
概述
本策略名为“顺势突破均线交叉策略”,主要思想是结合顺势指标和均线交叉进行判断做多做空。具体来说,本策略运用 шаф趋势周期(Schaff Trend Cycle,STC)指标和双平均线交叉。当 STC 方向突破超买超卖区域,价格高于短期指数移动平均线,短期指数移动平均线高于长期指数移动平均线时,做多;反之,做空。
策略原理
本策略主要基于两个技术指标:
顺势指标:STC 指标,判断趋势方向。STS 指标包含 MACD 指标、Stoch 指标和 STC 指标线。当 STC 线从 0-25 区间向上突破时为多头信号;当从 75-100 区间向下突破时为空头信号。
均线交叉:快速简单移动平均线(默认周期 35)和慢速简单移动平均线(默认周期 200)的交叉。快速线上穿慢速线为多头信号,快速线下穿慢速线为空头信号。
本策略的交易信号判断逻辑如下:
做多信号:STC 指标向上突破 25 线,且快速简单移动平均线高于慢速简单移动平均线,且价格高于快速简单移动平均线时,做多。
做空信号:STC 指标向下突破 75 线,且快速简单移动平均线低于慢速简单移动平均线,且价格低于快速简单移动平均线时,做空。
优势分析
本策略具有以下优势:
结合趋势指标和均线指标,交易信号比较可靠。STC 指标判断大趋势方向,双均线判断具体入场。
均线参数可调。可以根据市场调整均线参数,优化策略。
风险可控。STC 指标判断超买超卖区域,避免在极端区域追高抄底。目标止损设置了 400 个点的止盈止损范围。
风险分析
本策略也存在一定风险:
STC 指标可能出现假突破。需要结合价格实体判断。
均线交叉可能产生较多假信号。需要调整均线周期参数。
只做单边交易。空间有限。可以考虑双向交易。
没有处理外汇保证金交易的滑点风险。实盘中滑点可能较大。
优化方向
本策略可以从以下几个方面进行优化:
调整 STC 参数,优化超买超卖判断。
优化均线周期,提高交叉信号的可靠性。
增加其他滤波指标,过滤假突破。例如布林带。
增加双向交易逻辑。降低空间风险。
添加止损逻辑。控制单笔亏损。
总结
本策略综合运用了顺势指标和均线交叉指标,判断趋势方向和具体入场点位。在确保一定的风险控制条件下,可以获得较好的收益。该策略模型简单清晰,容易理解,也便于根据不同市场进行参数调整和功能优化,适合初学者学习和应用。
/*backtest
start: 2023-11-11 00:00:00
end: 2023-12-11 00:00:00
period: 3h
basePeriod: 15m
exchanges: [{"eid":"Futures_Binance","currency":"BTC_USDT"}]
*/

//@version=4
// Shaff Trend Cycle coded by Alex Orekhov (everget)
// Strategy and its additional conditions provided by greenmask
// Schaff Trend Cycle script may be freely distributed under the MIT license.
strategy("STC", shorttitle="STC")

fastLength = input(title="MACD Fast Length", type=input.integer, defval=23)
slowLength = input(title="MACD Slow Length", type=input.integer, defval=50)
cycleLength = input(title="Cycle Length", type=input.integer, defval=10)
d1Length = input(title="1st %D Length", type=input.integer, defval=3)
d2Length = input(title="2nd %D Length", type=input.integer, defval=3)
src = close
highlightBreakouts = input(title="Highlight Breakouts ?", type=input.bool, defval=true)

macd = ema(src, fastLength) - ema(src, slowLength)
k = nz(fixnan(stoch(macd, macd, macd, cycleLength)))
d = ema(k, d1Length)
kd = nz(fixnan(stoch(d, d, d, cycleLength)))
stc = ema(kd, d2Length)
stc := 	stc > 100 ? 100 : stc < 0 ? 0 : stc
stcColor = not highlightBreakouts ? (stc > stc[1] ? color.green : color.red) : #ff3013
stcPlot = plot(stc, title="STC", color=stcColor, transp=0)
upper = 75
lower = 25
transparent = color.new(color.white, 100)
upperLevel = plot(upper, title="Upper", color=color.gray)
hline(50, title="Middle", linestyle=hline.style_dotted)
lowerLevel = plot(lower, title="Lower", color=color.gray)

fill(upperLevel, lowerLevel, color=#f9cb9c, transp=90)

upperFillColor = stc > upper and highlightBreakouts ? color.green : transparent
lowerFillColor = stc < lower and highlightBreakouts ? color.red : transparent

fill(upperLevel, stcPlot, color=upperFillColor, transp=80)
fill(lowerLevel, stcPlot, color=lowerFillColor, transp=80)
strategy.initial_capital = 50000
ordersize=floor(strategy.initial_capital/close)
targetvalue = input(title="Target/stop", type=input.integer, defval=400)

ma1length = input(title="SMA1", type=input.integer, defval=35)
ma2length = input(title="SMA2", type=input.integer, defval=200)
ma1 = ema(close,ma1length)
ma2 = ema(close,ma2length)

bullbuy = crossover(stc, lower) and ma1>ma2 and close>ma1
bearsell = crossunder(stc, upper) and ma1<ma2 and close<ma1

if (bullbuy)
    strategy.entry("Riposte", strategy.long, ordersize)
    strategy.exit( "Riposte close", from_entry="Riposte", qty_percent=100, profit=targetvalue,loss=targetvalue)

if (bearsell)
    strategy.entry("Riposte", strategy.short, ordersize)
    strategy.exit( "Riposte close", from_entry="Riposte", qty_percent=100, profit=targetvalue,loss=targetvalue)

//plotshape(bullbuy,  title= "Purple", location=location.belowbar, color=#006600, transp=0, style=shape.circle, size=size.tiny, text="Riposte")
//plotshape(bearsell,  title= "Purple", location=location.abovebar, color=#006600, transp=0, style=shape.circle, size=size.tiny, text="Riposte")