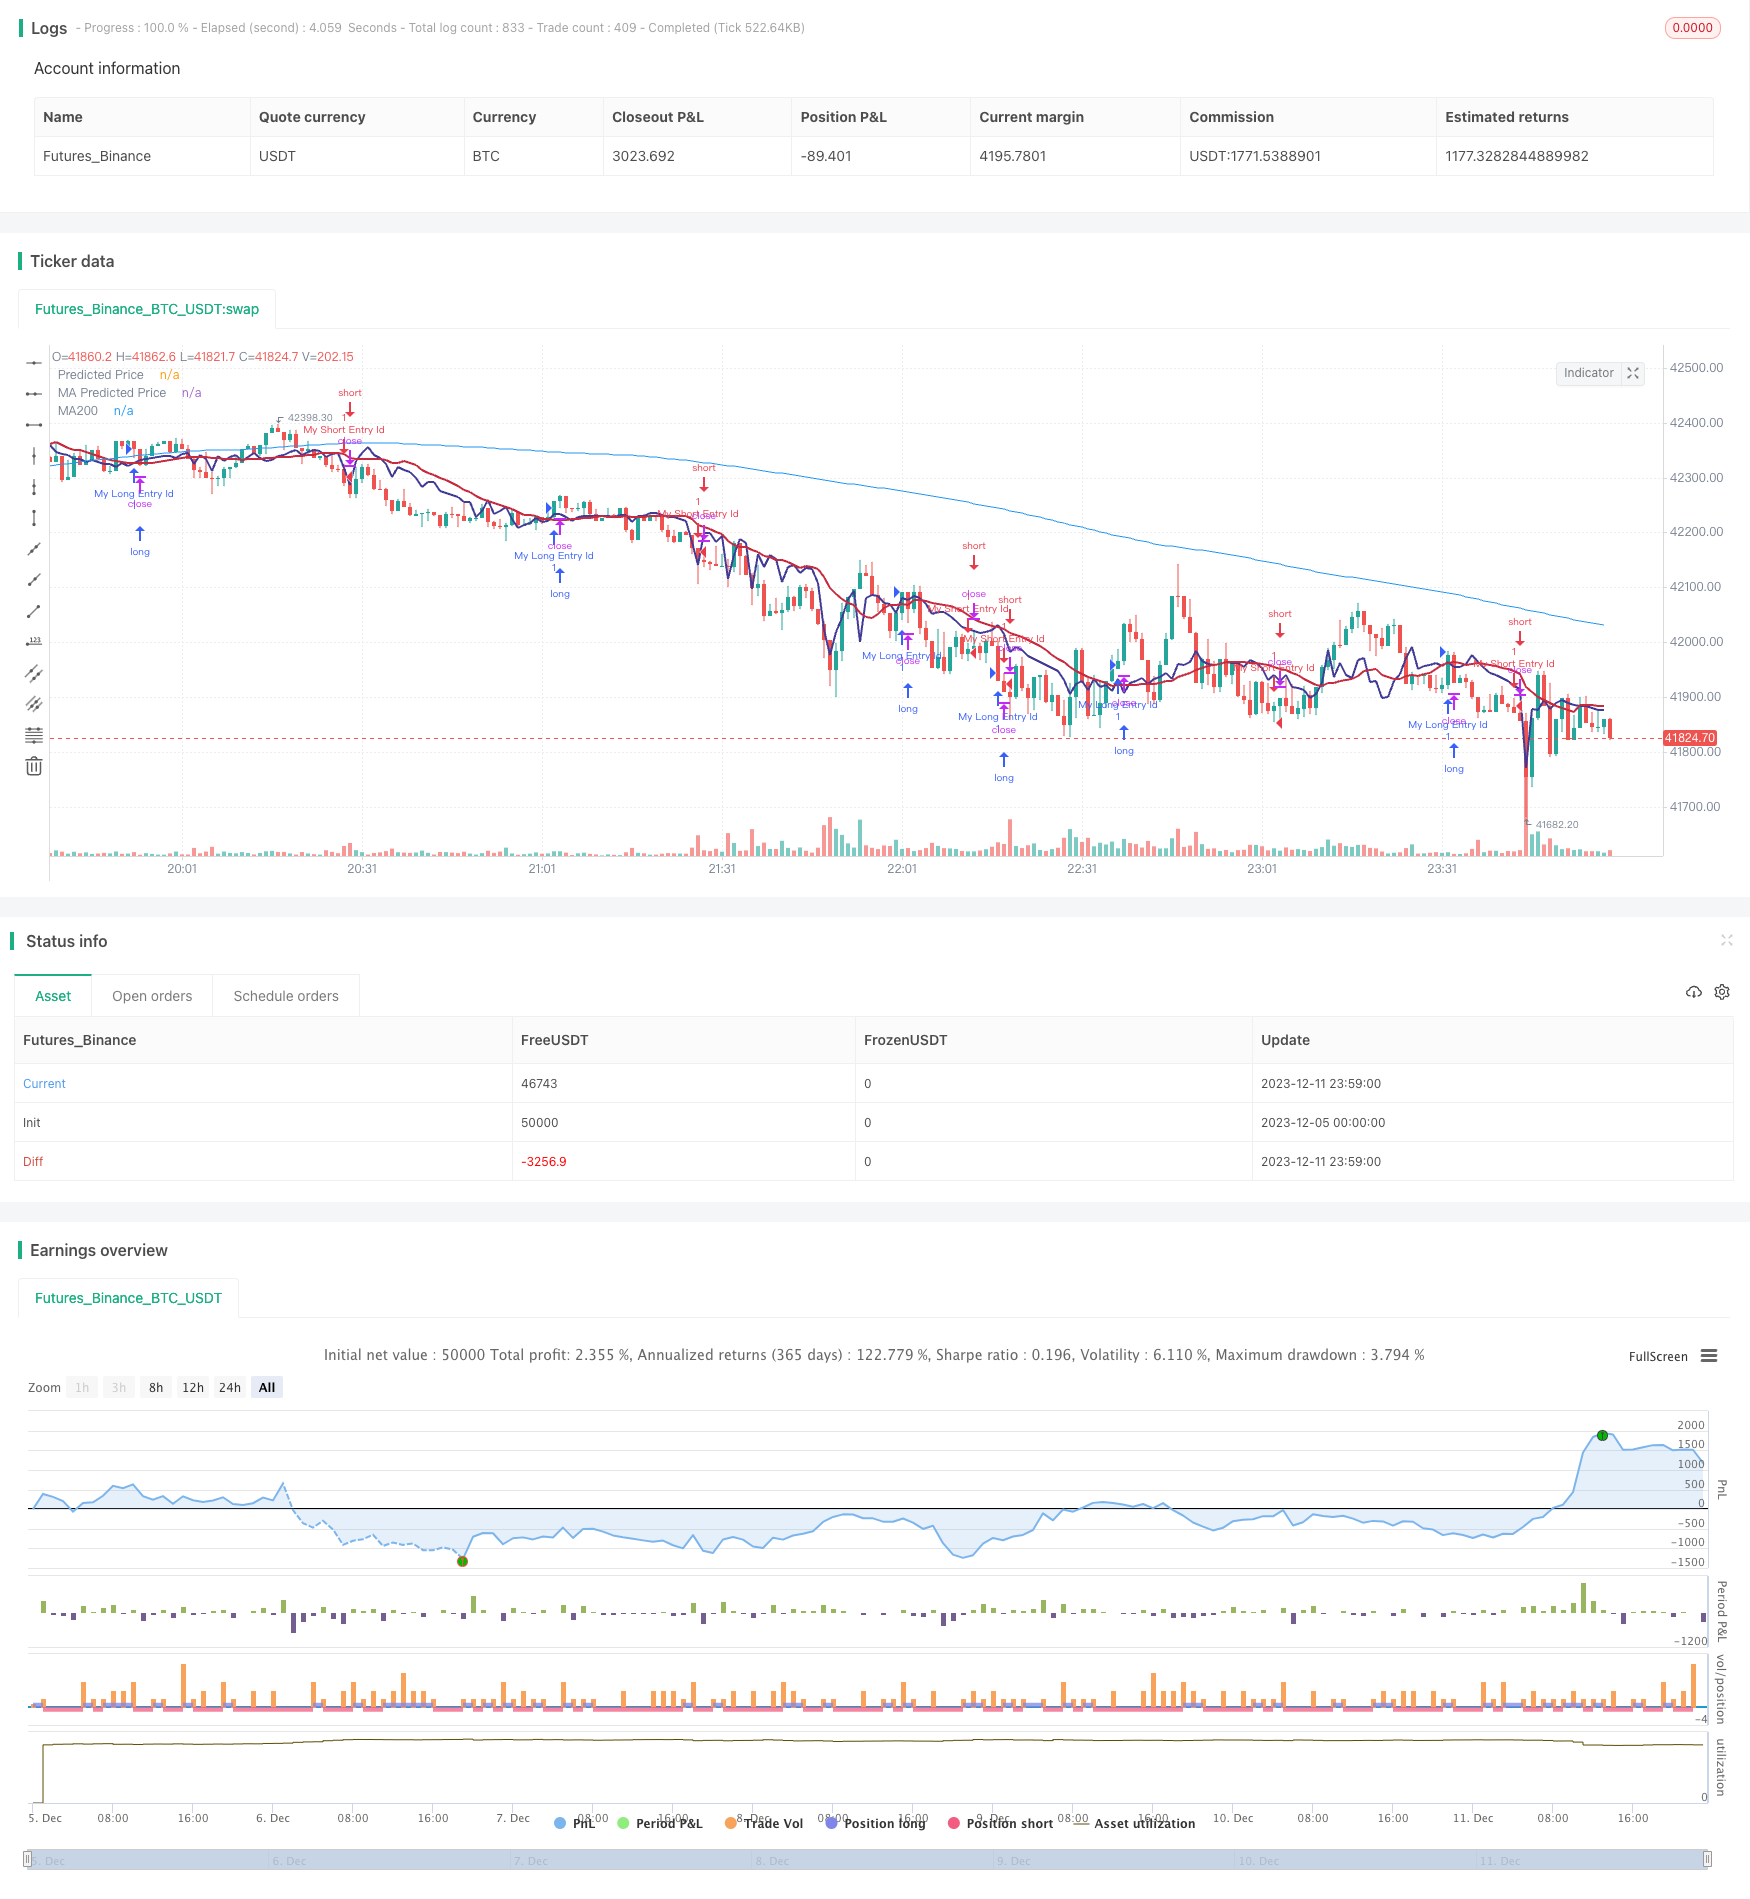
概述
动态意识形态趋势反转策略利用线性回归预测价格,并结合移动平均线形成的意识形态进行交易信号生成。当预测价格从下向上穿过移动平均线时产生买入信号;当预测价格从上向下穿过移动平均线时产生卖出信号,实现对趋势反转的捕捉。
策略原理
- 基于交易量计算股票价格的线性回归,得到价格的预测值
- 计算 diferentes 条件下的移动平均线
- 当预测价格从下向上穿过移动平均线时,产生买入信号
- 当预测价格从上向下穿过移动平均线时,产生卖出信号
- 结合MACD指标判断趋势反转的时机
以上信号结合多种confirmation,避免假突破,从而提高信号的准确性。
优势分析
- 利用线性回归预测价格趋势,提高信号准确性
- 结合移动平均线形成意识形态,捕捉趋势反转
- 基于交易量计算线性回归,更具有经济意义
- 结合MACD等指标进行多重confirmation,减少假信号
风险分析
- 线性回归的参数设置会对结果产生很大影响
- 移动平均线设置也会影响信号质量
- 虽有confirmation机制,仍然存在假信号风险
- 代码可进一步优化,以减少交易次数,提高盈利率
优化方向
- 优化线性回归和移动平均线的参数
- 增加confirmation条件,降低假信号率
- 结合更多因子判断趋势反转质量
- 优化止损策略,降低单次交易风险
总结
动态意识形态趋势反转策略整合线性回归预测和移动平均线形成的意识形态,对趋势反转时机进行捕捉。相比单一指标,具有更高的可靠性。同时,策略可通过参数调整和confirmation条件优化来进一步提升信号质量和盈利水平。
策略源码
/*backtest
start: 2023-12-05 00:00:00
end: 2023-12-12 00:00:00
period: 1m
basePeriod: 1m
exchanges: [{"eid":"Futures_Binance","currency":"BTC_USDT"}]
*/

// This source code is subject to the terms of the Mozilla Public License 2.0 at https://mozilla.org/MPL/2.0/
// © stocktechbot
//@version=5
strategy("Linear Cross", overlay=true, margin_long=100, margin_short=0)

//Linear Regression

vol = volume

// Function to calculate linear regression
linregs(y, x, len) =>
    ybar = math.sum(y, len)/len
    xbar = math.sum(x, len)/len
    b = math.sum((x - xbar)*(y - ybar),len)/math.sum((x - xbar)*(x - xbar),len)
    a = ybar - b*xbar
    [a, b]

// Historical stock price data
price = close

// Length of linear regression
len = input(defval = 21, title = 'Strategy Length')
linearlen=input(defval = 9, title = 'Linear Lookback')
[a, b] = linregs(price, vol, len)

// Calculate linear regression for stock price based on volume
//eps = request.earnings(syminfo.ticker, earnings.actual)
//MA For double confirmation

out = ta.sma(close, 200)
outf = ta.sma(close, 50)
outn = ta.sma(close, 90)
outt = ta.sma(close, 21)
outthree = ta.sma(close, 9)

// Predicted stock price based on volume
predicted_price = a + b*vol

// Check if predicted price is between open and close
is_between = open < predicted_price and predicted_price < close

//MACD
//[macdLine, signalLine, histLine] = ta.macd(close, 12, 26, 9)

// Plot predicted stock price
plot(predicted_price, color=color.rgb(65, 59, 150), linewidth=2, title="Predicted Price")
plot(ta.sma(predicted_price,linearlen), color=color.rgb(199, 43, 64), linewidth=2, title="MA Predicted Price")
//offset = input.int(title="Offset", defval=0, minval=-500, maxval=500)
plot(out, color=color.blue, title="MA200")
[macdLine, signalLine, histLine] = ta.macd(predicted_price, 12, 26, 9)

//BUY Signal

longCondition=false
mafentry =ta.sma(close, 50) > ta.sma(close, 90)
//matentry = ta.sma(close, 21) > ta.sma(close, 50)
matwohun = close > ta.sma(close, 200)
twohunraise = ta.rising(out, 2)
twentyrise = ta.rising(outt, 2)
macdrise = ta.rising(macdLine,2)
macdlong = ta.crossover(predicted_price, ta.wma(predicted_price,linearlen))  and (signalLine < macdLine)
if macdlong and macdrise
    longCondition := true

if (longCondition)
    strategy.entry("My Long Entry Id", strategy.long)
//Sell Signal
lastEntryPrice = strategy.opentrades.entry_price(strategy.opentrades - 1)
daysSinceEntry = len
daysSinceEntry := int((time - strategy.opentrades.entry_time(strategy.opentrades - 1)) / (24 * 60 * 60 * 1000))
percentageChange = (close - lastEntryPrice) / lastEntryPrice * 100
//trailChange = (ta.highest(close,daysSinceEntry) - close) / close * 100

//label.new(bar_index, high, color=color.black, textcolor=color.white,text=str.tostring(int(trailChange)))
shortCondition=false
mafexit =ta.sma(close, 50) < ta.sma(close, 90)
matexit = ta.sma(close, 21) < ta.sma(close, 50)
matwohund = close < ta.sma(close, 200)
twohunfall = ta.falling(out, 3)
twentyfall = ta.falling(outt, 2)
shortmafall = ta.falling(outthree, 1)
macdfall = ta.falling(macdLine,1)
macdsell = macdLine < signalLine
if macdfall and macdsell and (macdLine < signalLine) and ta.falling(low,2)
    shortCondition := true

if (shortCondition)
    strategy.entry("My Short Entry Id", strategy.short)