策略概述
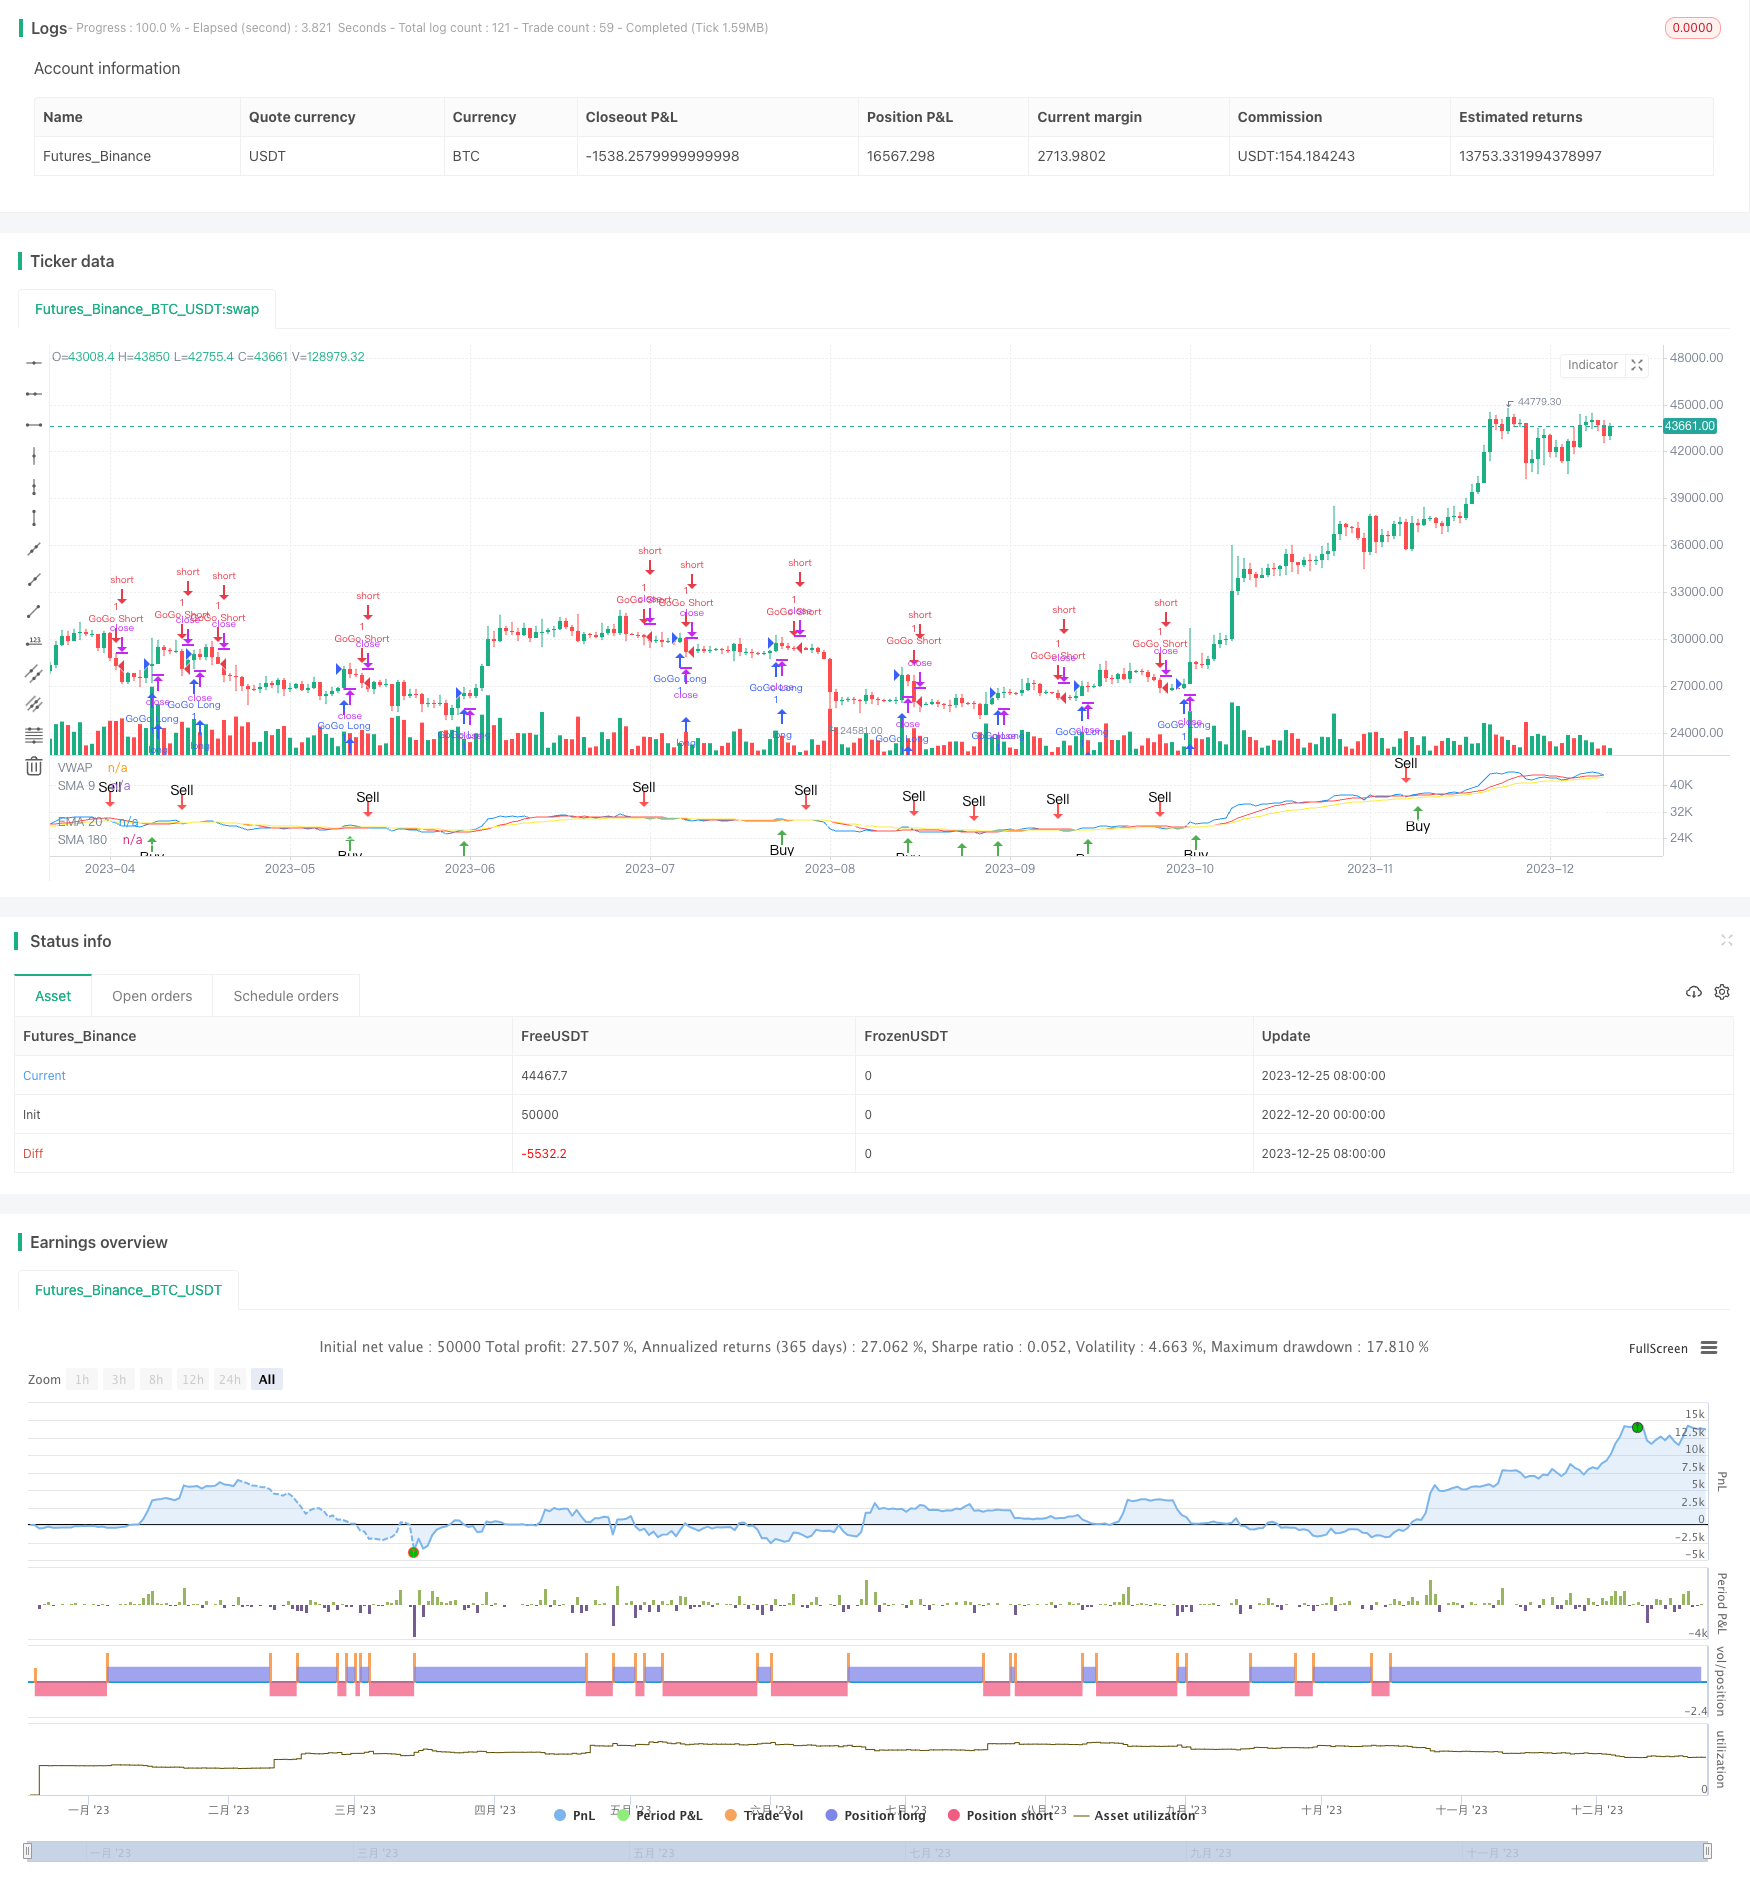
JBravo量化趋势策略是一个基于移动平均线的趋势跟踪策略。它利用9日简单移动平均线、20日指数移动平均线和180日简单移动平均线来判断市场的趋势方向,以及最终的买入和卖出信号。
该策略名称的灵感来源于Johnny Bravo这一动画人物,代表了一个自信和果断的交易决策。“GoGo果汁”这个词汇描绘了当VWAP线穿过20日指数移动平均线时的激进入场。
策略原理
当一根K线收盘价上穿9日简单移动平均线时,产生买入信号;当收盘价下穿20日指数移动平均线时,产生卖出信号。
如果9日、20日和180日移动平均线全部向上,并且9日移动平均线高于20日移动平均线,20日移动平均线高于180日移动平均线,则产生强烈的买入信号。
如果9日、20日和180日移动平均线全部向下,并且9日移动平均线低于20日移动平均线,20日移动平均线低于180日移动平均线,则产生强烈的卖出信号。
当成交量加权平均价线从下方向上穿过20日指数移动平均线时,产生“GoGo 看涨”信号;当成交量加权平均价线从上方向下穿过20日指数移动平均线时,产生“GoGo 看跌”信号。
策略优势分析
该策略结合了趋势跟踪和突破的策略思想。移动平均线能清晰判断市场趋势方向,减少错误交易的概率。同时,它灵活运用了成交量加权平均价这一指标判断入场时机,在看好市场突破的同时控制了风险。
相比单一使用移动平均线,该策略增加了“GoGo果汁”这个激进入场机制,这在强势行情中可以获得更高的市场报酬率。
总体来说,该策略回撤较小,具有稳定的盈利能力。
策略风险分析 ##
尽管该策略增加了强势入场机制,但在震荡行情中,止损点可能会被频繁触发。此外,移动平均线本身滞后性较强,无法及时捕捉价格变化。
这意味着策略可能会产生一定数量的虚拟交易,无法真实反映市场价格行情。此外,强势入场也增加了亏损的风险。
为降低风险,可以适当调整移动平均线的周期;或者增加止损模块,在亏损达到一定幅度后止损退出。
策略优化方向
该策略可以在以下几个方向进行优化:
调整移动平均线参数,优化周期参数,找到最佳参数组合
增加成交量指标判断,避免在价格剧烈波动中造成错误信号
增加止损模块,设置离场规则,控制单笔亏损
结合市场热点板块选择,使策略更具有针对性
优化开仓仓位比例,不同参数优化不同的仓位 scale
总结
JBravo量化趋势策略整合了移动平均线分析和成交量加权平均价的趋势判断。它追求稳定的长线获利,同时具有一定的激进交易机制。该策略适用于中长线持有,风险中等偏上,回报率较高。它可以成为组合交易策略的组成部分,具有很好的市场适应性。
||
Strategy Overview
The JBravo Quantitative Trend Strategy is a trend-following strategy based on moving averages. It uses the 9-day simple moving average, 20-day exponential moving average, and 180-day simple moving average to determine the market trend direction, as well as the final buy and sell signals.
The strategy name is inspired by the cartoon character Johnny Bravo, representing a confident and decisive trading decision. The term “GoGo Juice” depicts the aggressive entry when the VWAP line crosses the 20-day exponential moving average.
Strategy Principle ##
A buy signal is generated when the closing price crosses above the 9-day simple moving average; A sell signal is generated when the closing price crosses below the 20-day exponential moving average.
If the 9-day, 20-day and 180-day moving averages are all moving up, and the 9-day moving average is above the 20-day moving average, the 20-day moving average is above the 180-day moving average, a strong buy signal is generated.
If the 9-day, 20-day and 180-day moving averages are all moving down, and the 9-day moving average is below the 20-day moving average, the 20-day moving average is below the 180-day moving average, a strong sell signal is generated.
When the Volume Weighted Average Price line crosses the 20-day exponential moving average upward, a “GoGo Long” signal is generated; When the Volume Weighted Average Price line crosses the 20-day exponential moving average downward, a “GoGo Short” signal is generated.
Advantage Analysis
This strategy combines the ideas of trend following and breakout strategies. Moving averages can clearly determine the direction of the market trend and reduce the probability of wrong trades. At the same time, it flexibly uses the VWAP indicator to determine the entry time, controlling risks while favoring breakthroughs in the market.
Compared to using moving averages alone, this strategy adds the aggressive entry mechanism of “GoGo Juice”, which can obtain higher returns in strong trends.
Overall, this strategy has small drawdowns and stable profitability.
Risk Analysis
Although the strategy increases the strength of entries, stop loss points can be frequently triggered in sideways markets. In addition, moving averages themselves have high inertia and cannot keep up with price changes in time.
This means that the strategy may generate a certain number of virtual trades that do not actually reflect market price movements. In addition, aggressive entries also increase the risk of losses.
To reduce risks, we can adjust the cycle of moving averages as appropriate; or add a stop loss module to stop loss when losses reach a certain level.
Optimization Directions ##
The strategy can be optimized in the following directions:
Adjust moving average parameters and optimize cycle parameters to find the optimal parameter combination
Add volume indicators to avoid false signals in times of violent price fluctuations
Increase stop loss modules and set exit rules to control per trade loss
Combine selections of market hot sectors to make strategies more targeted
Optimize opening position proportions, optimize different scale for different parameters
Conclusion ##
The JBravo Quantitative Trend Strategy integrates moving average analysis and VWAP trend judgment. It pursues stable long-term profits while having a certain degree of aggressive trading mechanisms. The strategy is suitable for medium-long term holdings, with medium-high risks and high returns. It can become a part of portfolio trading strategies with very good market adaptability.
[/trans]
/*backtest
start: 2022-12-20 00:00:00
end: 2023-12-26 00:00:00
period: 1d
basePeriod: 1h
exchanges: [{"eid":"Futures_Binance","currency":"BTC_USDT"}]
*/

// This source code is subject to the terms of the Mozilla Public License 2.0 at https://mozilla.org/MPL/2.0/
// © bradvaughn

//@version=4
strategy("JBravo Swing", overlay = false)

var buy_in_progress = false


//Moving Averages
smaInput1 = input(title="Display SMA 9", type=input.bool, defval=true)
smaInput2 = input(title="Display EMA 20", type=input.bool, defval=true)
smaInput4 = input(title="Display SMA 180", type=input.bool, defval=true)
colored_180 = input(false, title="Color-code 180 trend direction")
vwapInput = input(title="Display VWAP", type=input.bool, defval=true)

sma9 = sma(close, 9)
ema20 = ema(close, 20)
sma180 = sma(close, 180)

//Plot Moving Averages
plot(smaInput1 ? sma9 : na, color= color.red, title="SMA 9")
plot(smaInput2 ? ema20 : na, color = color.yellow, title="EMA 20")

// Plot VWAP
vwap1 = vwap(hlc3)
plot(vwapInput ? vwap1 : na, color = color.blue, title="VWAP")
vwaplong = vwap1 > ema20
vwapshort = vwap1 < ema20

//Color SMA 180 trend direction if selected
sma180_uptrend = sma(close, 180) > sma(close[2], 180)
colr = sma180_uptrend == true or colored_180 == false ? color.white : colored_180 == true ? color.gray : na
plot(smaInput4 ? sma180 : na, color = colr, title="SMA 180")

//Get value of lower end of candle
buyLow = iff(lowest(open, 1) < lowest(close, 1), lowest(open, 1), lowest(close, 1))
sellLow = lowest(close, 1)

// Find the lower MA for crossover sell condition
sellma = iff((sma9<ema20), sma9, ema20)


//SMA 9 trend direction
sma9_uptrend = sma(close, 9) > sma(close[2], 9)
//EMA 20 trend direction
ema20_uptrend = ema(close, 20) > sma(close[2], 20)

//Buy or sell if conditions are met
// Buy when the candle low is above the SMA9
// Sell when the candle low is below the lower of SMA9 and EMA20
Buy = iff(buy_in_progress == false and buyLow > sma9 == true, true, false)
Sell = iff(buy_in_progress == true and sellLow < sellma == true, true, false)

// Determine stong buy and strong sell conditions.
// If moving averages are all up, then this will qualify a buy as a strong buy.
// If the moving averages are not up (ie. down) then this will qualify a sell as a strong sell
StrongBuy = iff (Buy and sma9_uptrend and sma180_uptrend and ema20_uptrend and (sma9 > ema20) and (ema20 > sma180), true, false)
StrongSell = iff (Sell and not sma9_uptrend and not sma180_uptrend and not ema20_uptrend and (sma9 < ema20) and (ema20 < sma180), true, false)

//Update Trading status if bought or sold
if Buy
    buy_in_progress := true
if Sell
    buy_in_progress := false

// Clear Buy and Sell conditions if StrongBuy or StrongSell conditions exist.
// This disables plotting Buy and Sell conditions
if StrongBuy
    Buy := false
if StrongSell
    Sell := false


//Display BUY/SELL indicators

plotshape(Buy,title="Buy", color=color.green, style=shape.arrowup,location=location.belowbar, text="Buy")
plotshape(StrongBuy,title="Strong Buy", color=color.green, style=shape.arrowup,location=location.belowbar, text="Strong Buy")
plotshape(Sell,title="Sell", color=color.red, style=shape.arrowdown,text="Sell")
plotshape(StrongSell,title="Strong Sell", color=color.red, style=shape.arrowdown,text="Strong Sell")

strategy.entry("GoGo Long", strategy.long, 1, when=vwaplong and vwapInput)
strategy.entry("GoGo Short", strategy.short, 1, when=vwapshort and vwapInput)

strategy.close("GoGo Long", when = vwapshort and vwapInput)
strategy.close("GoGo Short", when = vwaplong and vwapInput)


alertcondition(Buy, title="Buy Signal", message="Buy")
alertcondition(Sell, title="Sell Signal", message="Sell")