概述
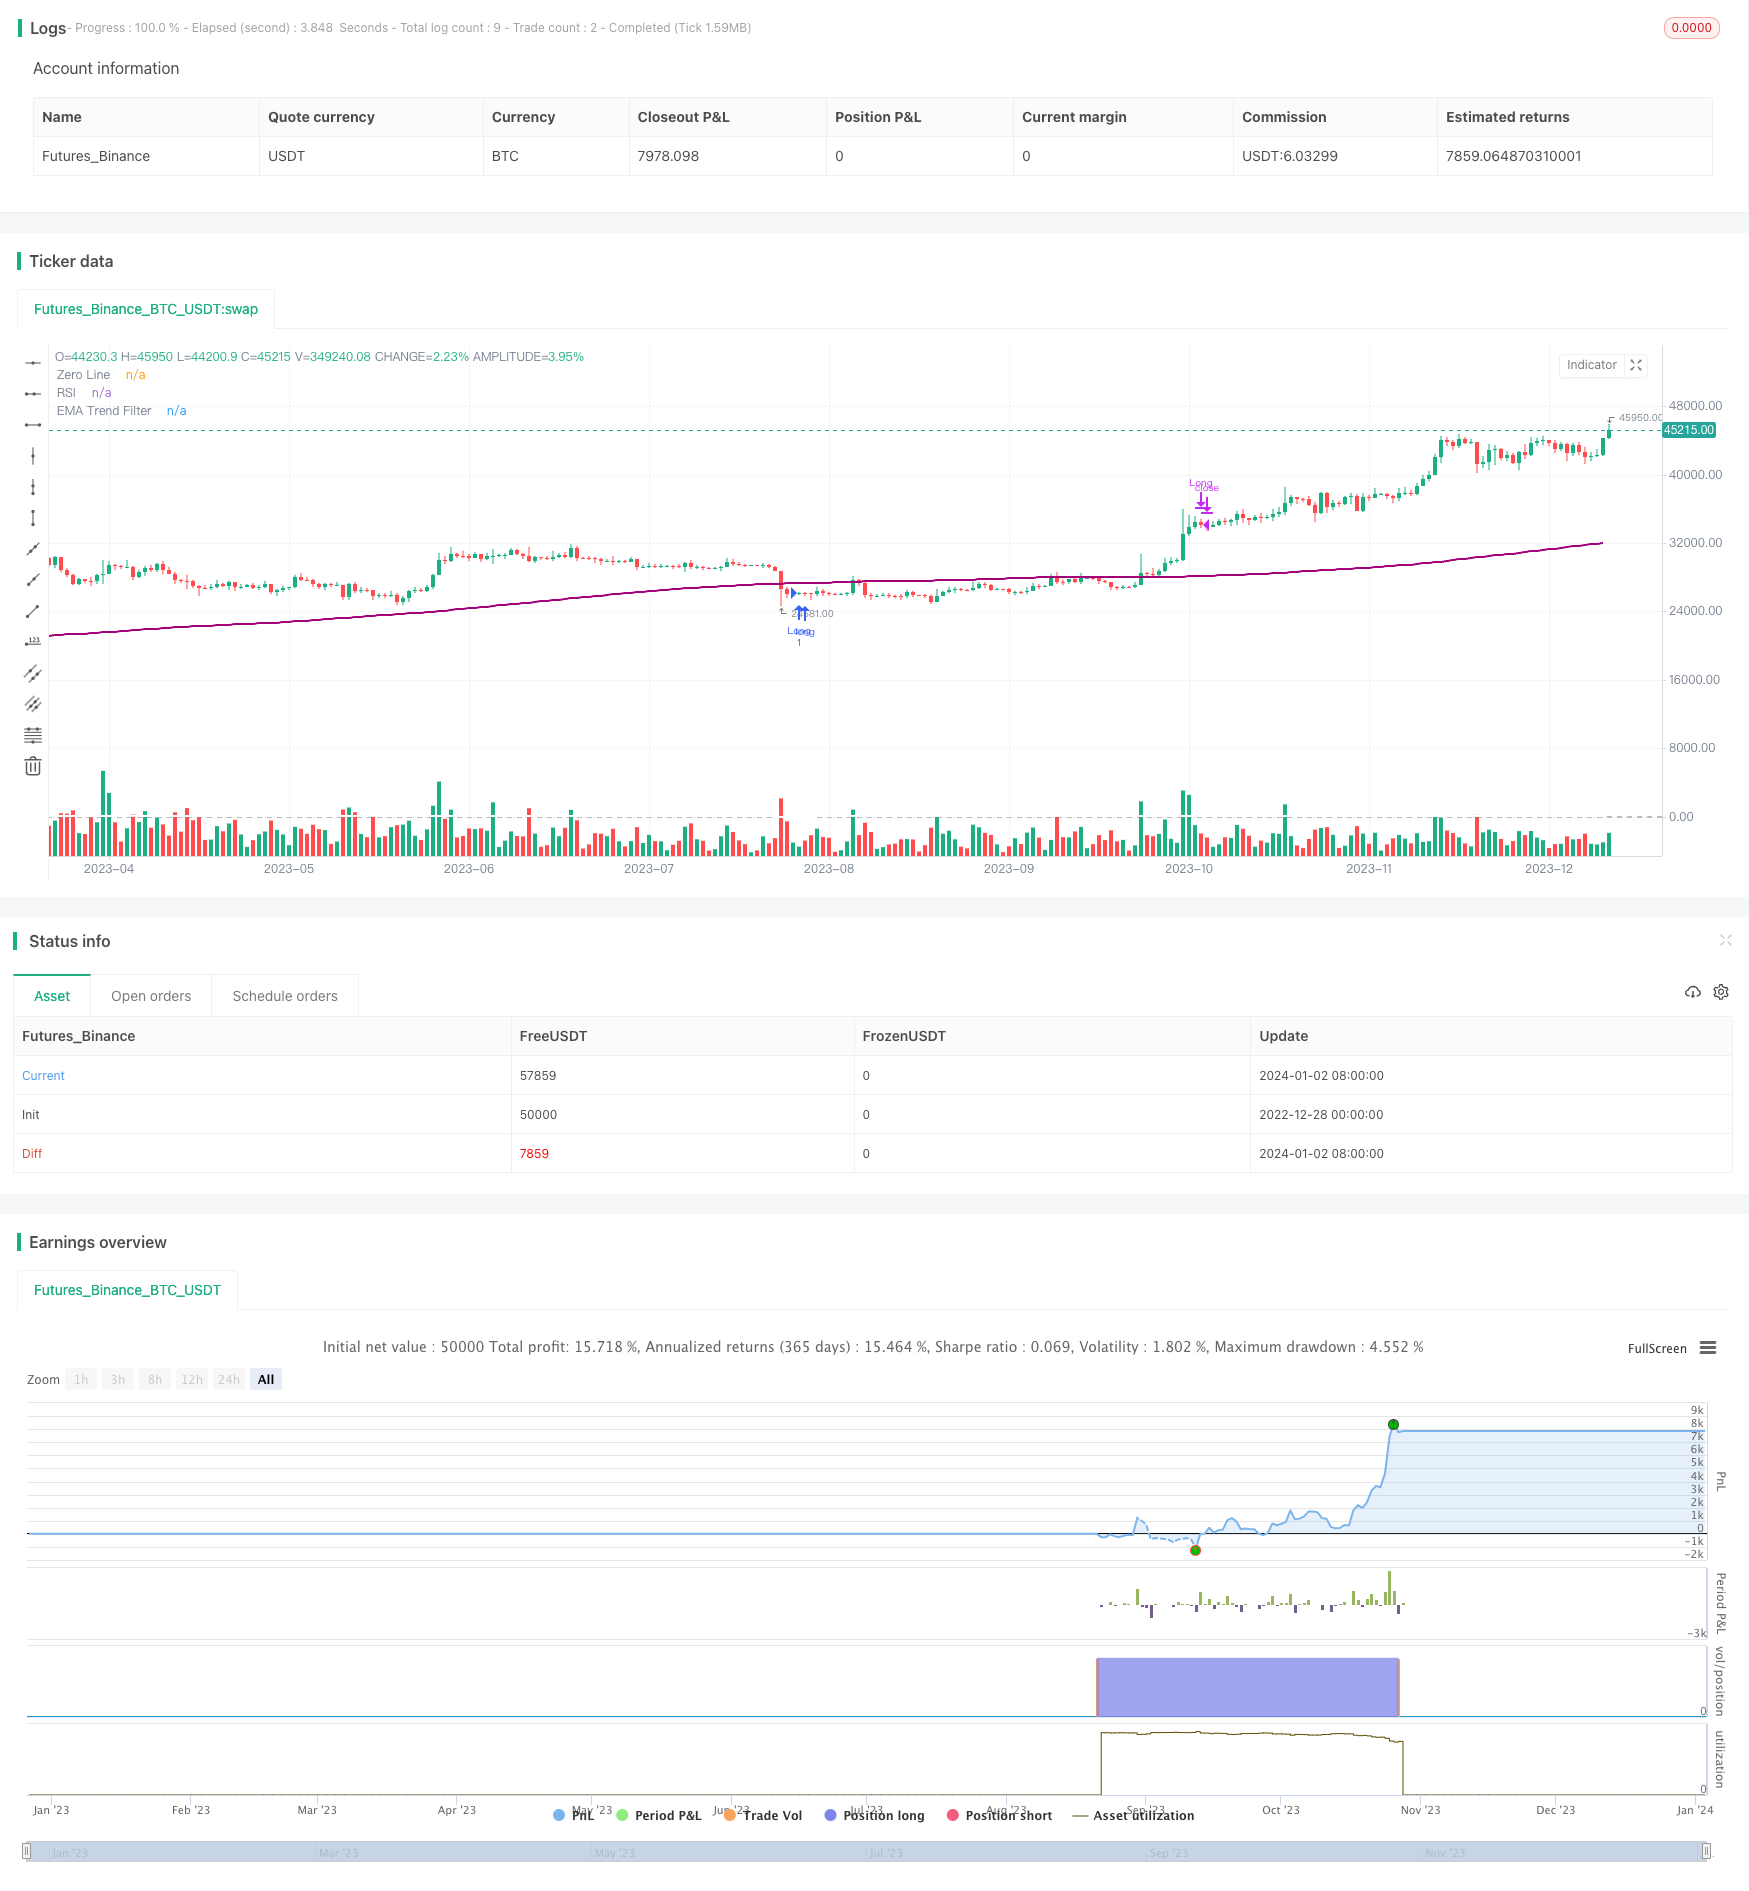
该策略是一个利用RSI指标判断趋势,配合MACD指标进行入市的趋势追踪型多头策略。该策略同时结合EMA均线作为趋势过滤器,以及紧急止损机制来控制风险。
策略原理
该策略主要依赖RSI指标判断趋势方向。当RSI指标上穿设定的RSI长线(默认21)时,认为行情可能反转为涨趋势。此时如果MACD已经处于下降趋势,那么可以判断目前处于反转点,是一个较好的做多时机。
另外,该策略还引入EMA均线(默认200周期)作为趋势过滤器。只有当价格高于EMA均线时才会考虑做多。这可以有效过滤趋势不明或者下降趋势中的假反转。
在止损方面,该策略同时设置了常规止损线和紧急止损线。当RSI下穿常规止损线(默认86)时平仓;如果价格大幅下挫,RSI下穿紧急止损线(默认73)时无条件平仓,以控制最大损失。
优势分析
- 使用RSI判断反转点,配合MACD滤除误入。
- 引入EMA均线判断大趋势。
- 同时使用常规止损和紧急止损,控制风险。
风险分析
- RSI反转信号可能出现误判。
- 大盘趋势变化时,EMA均线无法及时响应。
- 单一止损指标可能将获利交易截止。
优化方向
- 可以引入价量指标或者阳线/阴线比例作为辅助判断指标,提高入场准确率。
- 均线系统可以调整为动态追踪最近N日趋势。
- 增加移动止损或者统计止损,让止损更加灵活。
总结
本策略总体来说是一个较为传统的趋势追踪型多头策略。利用RSI识别反转点,MACD过滤误判,EMA判断大趋势,止损控制风险。该策略较为简单直观,容易理解,在判断行情反转上具有一定优势,可以作为量化交易的入门策略之一。但该策略可优化空间较大,后续可以从入场信号、趋势判断、止损机制等多个方面进行进一步完善。
策略源码
/*backtest
start: 2022-12-28 00:00:00
end: 2024-01-03 00:00:00
period: 1d
basePeriod: 1h
exchanges: [{"eid":"Futures_Binance","currency":"BTC_USDT"}]
*/

// This Pine Script™ code is subject to the terms of the Mozilla Public License 2.0 at https://mozilla.org/MPL/2.0/
// © dravitch
//@version=4
strategy("RSI - BULL RUN (Improved)", overlay=true)

// Input
UseEmergency = input(true, "Use Emergency Exit?")
RSIlong = input(21, "RSI Long Cross")
RSIcloseLong = input(86, "RSI Close Long Position")

EmergencycloseLong = input(73, "RSI Emergency Close Long Position")
UseEMAFilter = input(true, "Use EMA Trend Filter")
EMAlength = input(200, "EMA Length for Trend Filter")  // Utiliser 200 pour SMMA

// RSI
rsiValue = rsi(close, 14)

// MACD
[macdLine, signalLine, _] = macd(close, 12, 26, 9)

// EMA Trend Filter
emaTrend = sma(close, EMAlength)  // Utiliser sma pour la SMMA (Simple Moving Average)

// Conditions pour les trades longs
trendUp = close > emaTrend
trendDown = close < emaTrend
longCondition = crossover(rsiValue, RSIlong) and trendDown or crossunder(macdLine, signalLine) and crossover(rsiValue, RSIlong)
longCloseCondition = crossunder(rsiValue, RSIcloseLong) and trendUp
emergencyLongCondition = crossunder(rsiValue, EmergencycloseLong)

// Plots
plot(rsiValue, color=color.white, linewidth=2, title="RSI")

// Strategy
if (longCondition)
    strategy.entry("Long", strategy.long, alert_message='RSI Long Cross: LONG')
if (longCloseCondition)
    strategy.close("Long", alert_message='RSI Close Long Position')
if (emergencyLongCondition and UseEmergency)
    strategy.close("Long", alert_message='RSI Emergency Close Long')

// Plot EMA Trend Filter in a separate pane
plot(emaTrend, color=color.rgb(163, 0, 122), title="EMA Trend Filter", linewidth=2, style=plot.style_line, transp=0)
hline(0, "Zero Line", color=color.gray)