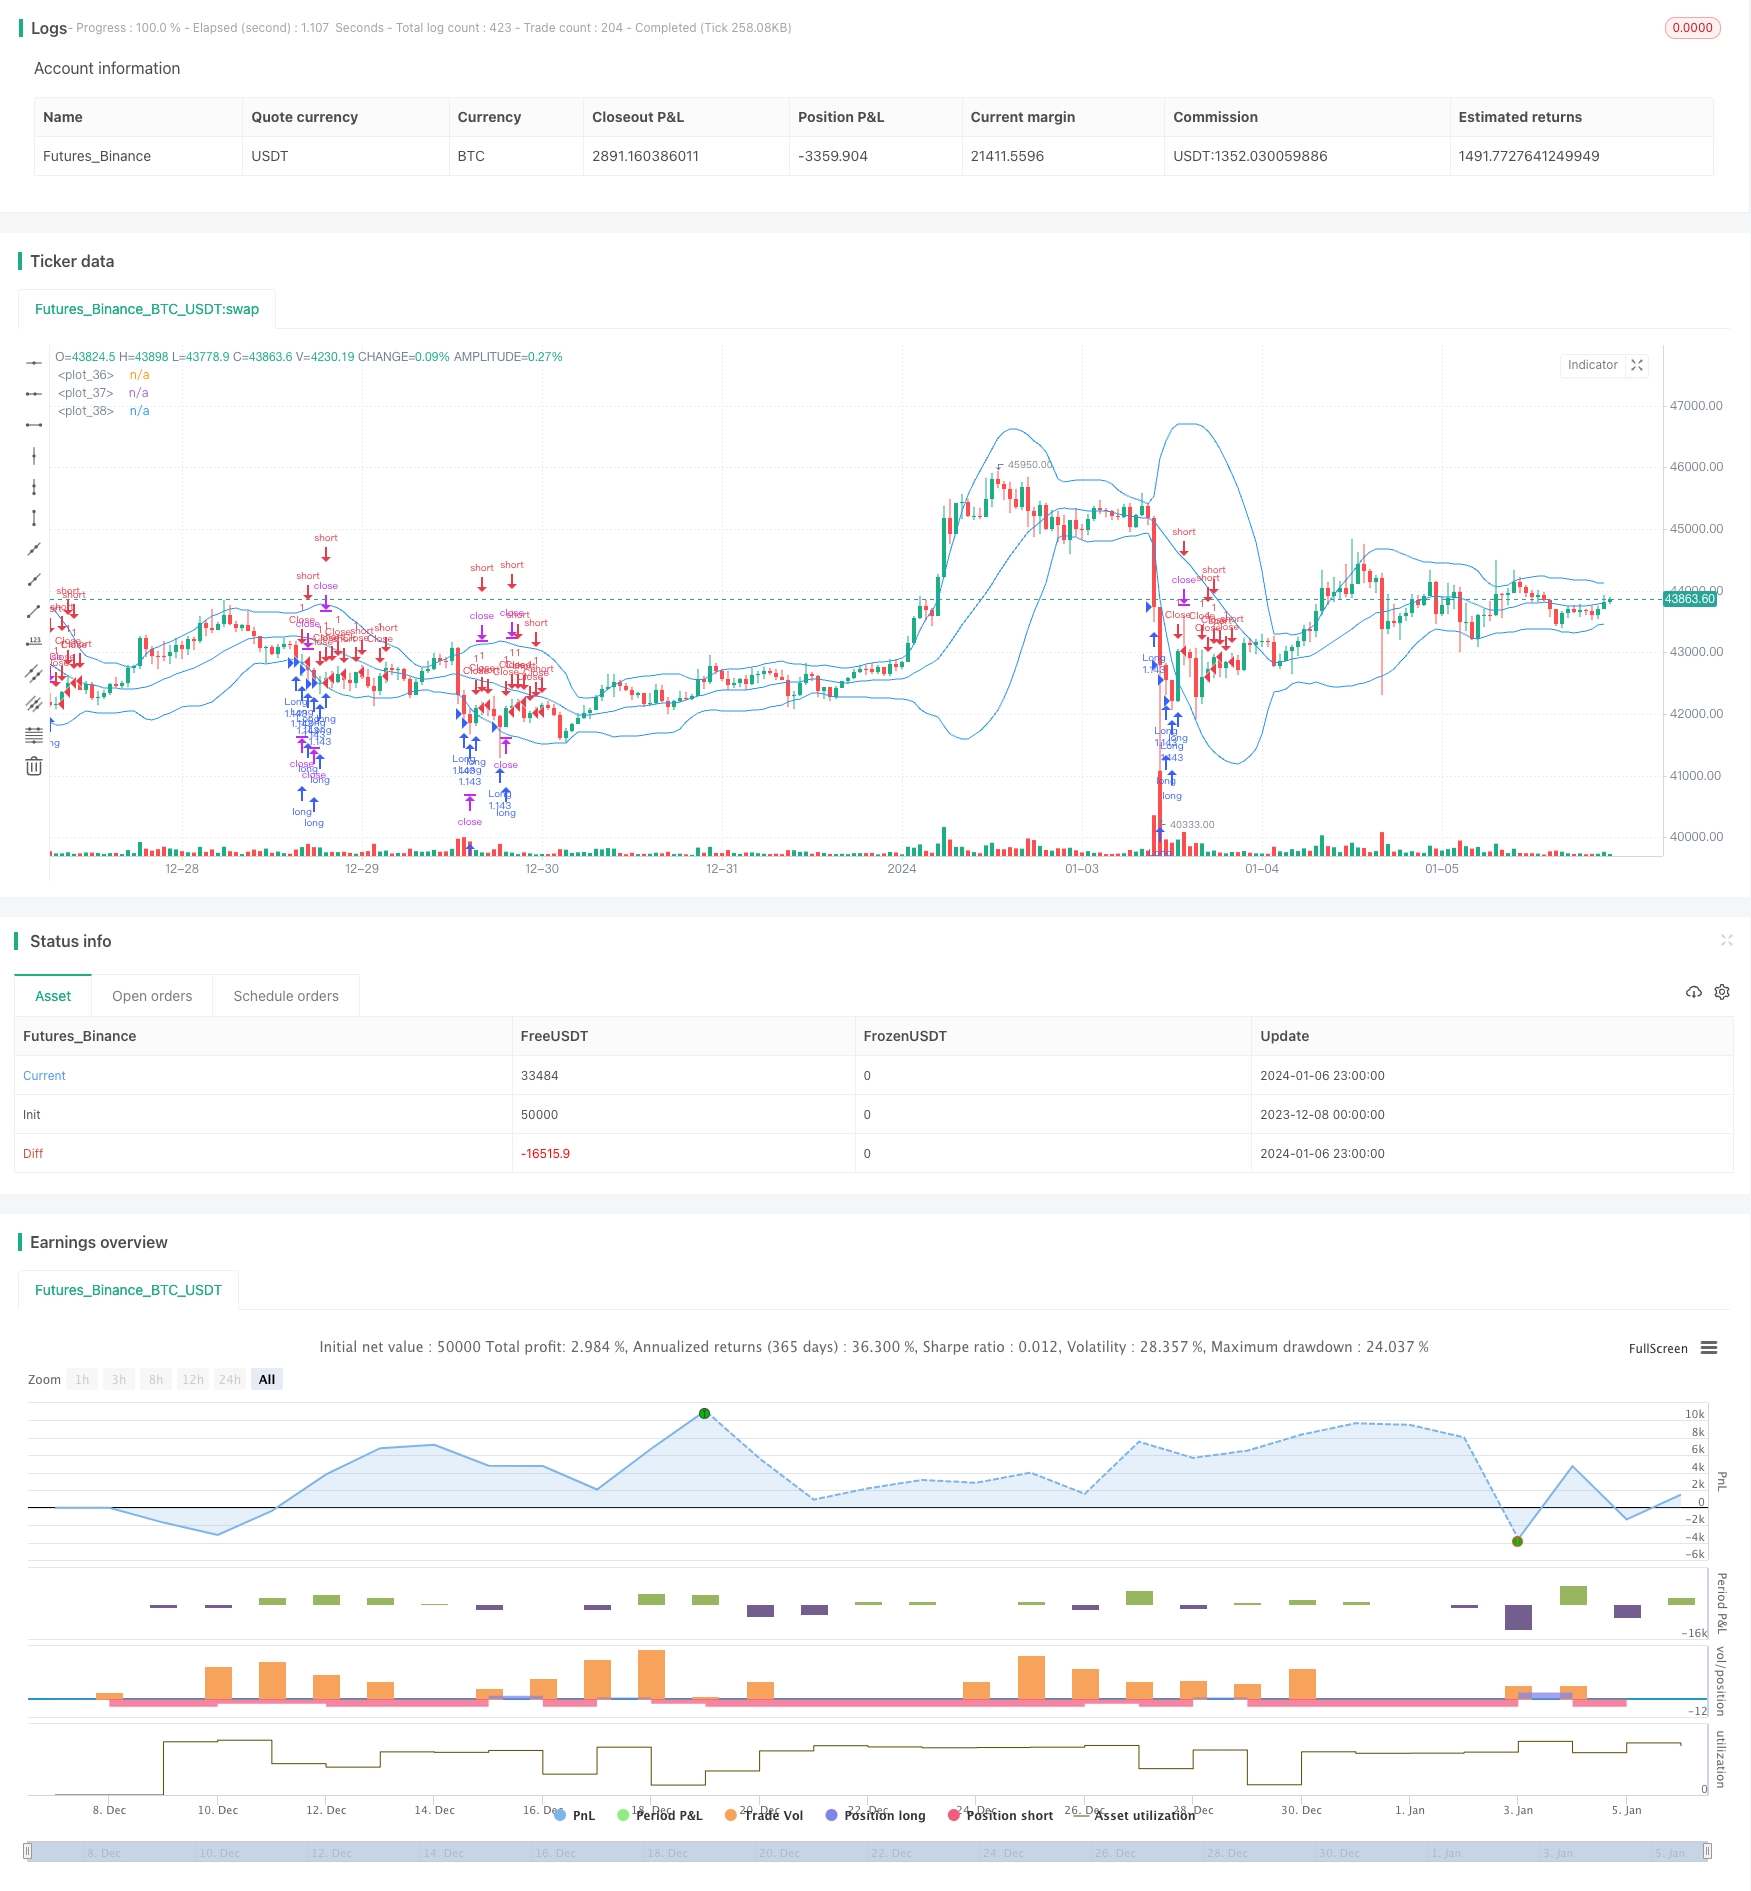
概述
本策略通过结合相对强弱指标(RSI)和布林线通道来识别交易机会,属于量化交易中的均值回复策略。当RSI低于设定阈值时买入,当价格上穿布林线通道中轨时平仓,没有做空机会。
策略原理
使用RSI指标判断市场是否处于超卖状态。RSI低于30时,被视为超卖信号。
使用布林线通道判断价格是否开始反弹上行。当价格从布林线下轨反弹上穿布林线中轨时,做多方向结束。
结合RSI超卖信号和布林线出圈信号,可以设定买入点位。当两种信号同时触发时买入,等待价格上穿布林线中轨时平仓套现。
优势分析
该策略结合均值反转型指标RSI和通道指标布林线,可以更准确定位买入时机。
RSI指标可以过滤掉许多假突破的情况,减少不必要的交易。
布林线通道作为止损指标,可以控制单笔交易的风险。
风险分析
RSI指标可能发出错误信号,导致错过买入机会。
布林线通道参数设置不当可能导致止损过于宽松或严格。
交易品种选择不当,如交易小市值股票时流动性风险较大。
优化方向
可以测试不同参数组合,如RSI周期、布林线通道周期和倍数,寻找最优参数。
可以结合其他指标如KD、MACD等,设定更严格的买入条件以过滤信号。
可以根据不同交易品种设定止损幅度,如设置波动率止损。
总结
本策略首先利用RSI低位买入,再利用布林线通道高位止损的思路,属于均值回复交易策略。相比单一使用RSI或布林线等指标,本策略可以更准确定位买入卖出点位,从而获得更好的策略效果。下一步可以通过参数优化、信号过滤、止损策略等进一步完善。
策略源码
/*backtest
start: 2023-12-08 00:00:00
end: 2024-01-07 00:00:00
period: 1h
basePeriod: 15m
exchanges: [{"eid":"Futures_Binance","currency":"BTC_USDT"}]
*/

//Noro
//2018

//@version=3
strategy(title = "Noro's BB + RSI Strategy v1.0", shorttitle = "BB+RSI str 1.0", overlay = true, default_qty_type = strategy.percent_of_equity, default_qty_value = 100, pyramiding = 5)

//Settings
capital = input(100, defval = 100, minval = 1, maxval = 10000, title = "Lot, %")
rsiuse = input(true, defval = true, title = "Use RSI")
bbuse = input(true, defval = true, title = "Use BB")
showbb = input(true, defval = true, title = "Show BB Overlay")
bbperiod = input(20, defval = 20, minval = 2, maxval = 1000, title = "BB period")
bbsource = input(ohlc4, title = "BB source")
bbmult = input(2, defval = 2, minval = 1, maxval = 100, title = "BB Mult")
rsiperiod = input(7, defval = 7, minval = 2, maxval = 1000, title = "RSI period")
rsisource = input(close, title = "RSI source")
rsilimit = input(30, defval = 30, minval = 1, maxval = 49, title = "RSI Limit")
fromyear = input(1900, defval = 1900, minval = 1900, maxval = 2100, title = "From Year")
toyear = input(2100, defval = 2100, minval = 1900, maxval = 2100, title = "To Year")
frommonth = input(01, defval = 01, minval = 01, maxval = 12, title = "From Month")
tomonth = input(12, defval = 12, minval = 01, maxval = 12, title = "To Month")
fromday = input(01, defval = 01, minval = 01, maxval = 31, title = "From Day")
today = input(31, defval = 31, minval = 01, maxval = 31, title = "To Day")

//RSI
rsi = rsi(rsisource, rsiperiod)

//BB
basis = sma(bbsource, bbperiod)
dev = bbmult * stdev(bbsource, bbperiod)
upper = basis + dev
lower = basis - dev

//Overlay
col = showbb ? blue : na
plot(upper, color = col)
plot(basis, color = col)
plot(lower, color = col)

//Signals
up = (rsi < rsilimit or rsiuse == false) and (low < lower or bbuse == false)
cl = close > open

//Trading
lot = 0.0
lot := strategy.position_size == 0 ? strategy.equity / close * capital / 100 : lot[1]
if up
    strategy.entry("Long", strategy.long, lot)
if cl
    strategy.entry("Close", strategy.short, 0)
if time > timestamp(toyear, tomonth, today, 23, 59)
    strategy.close_all()