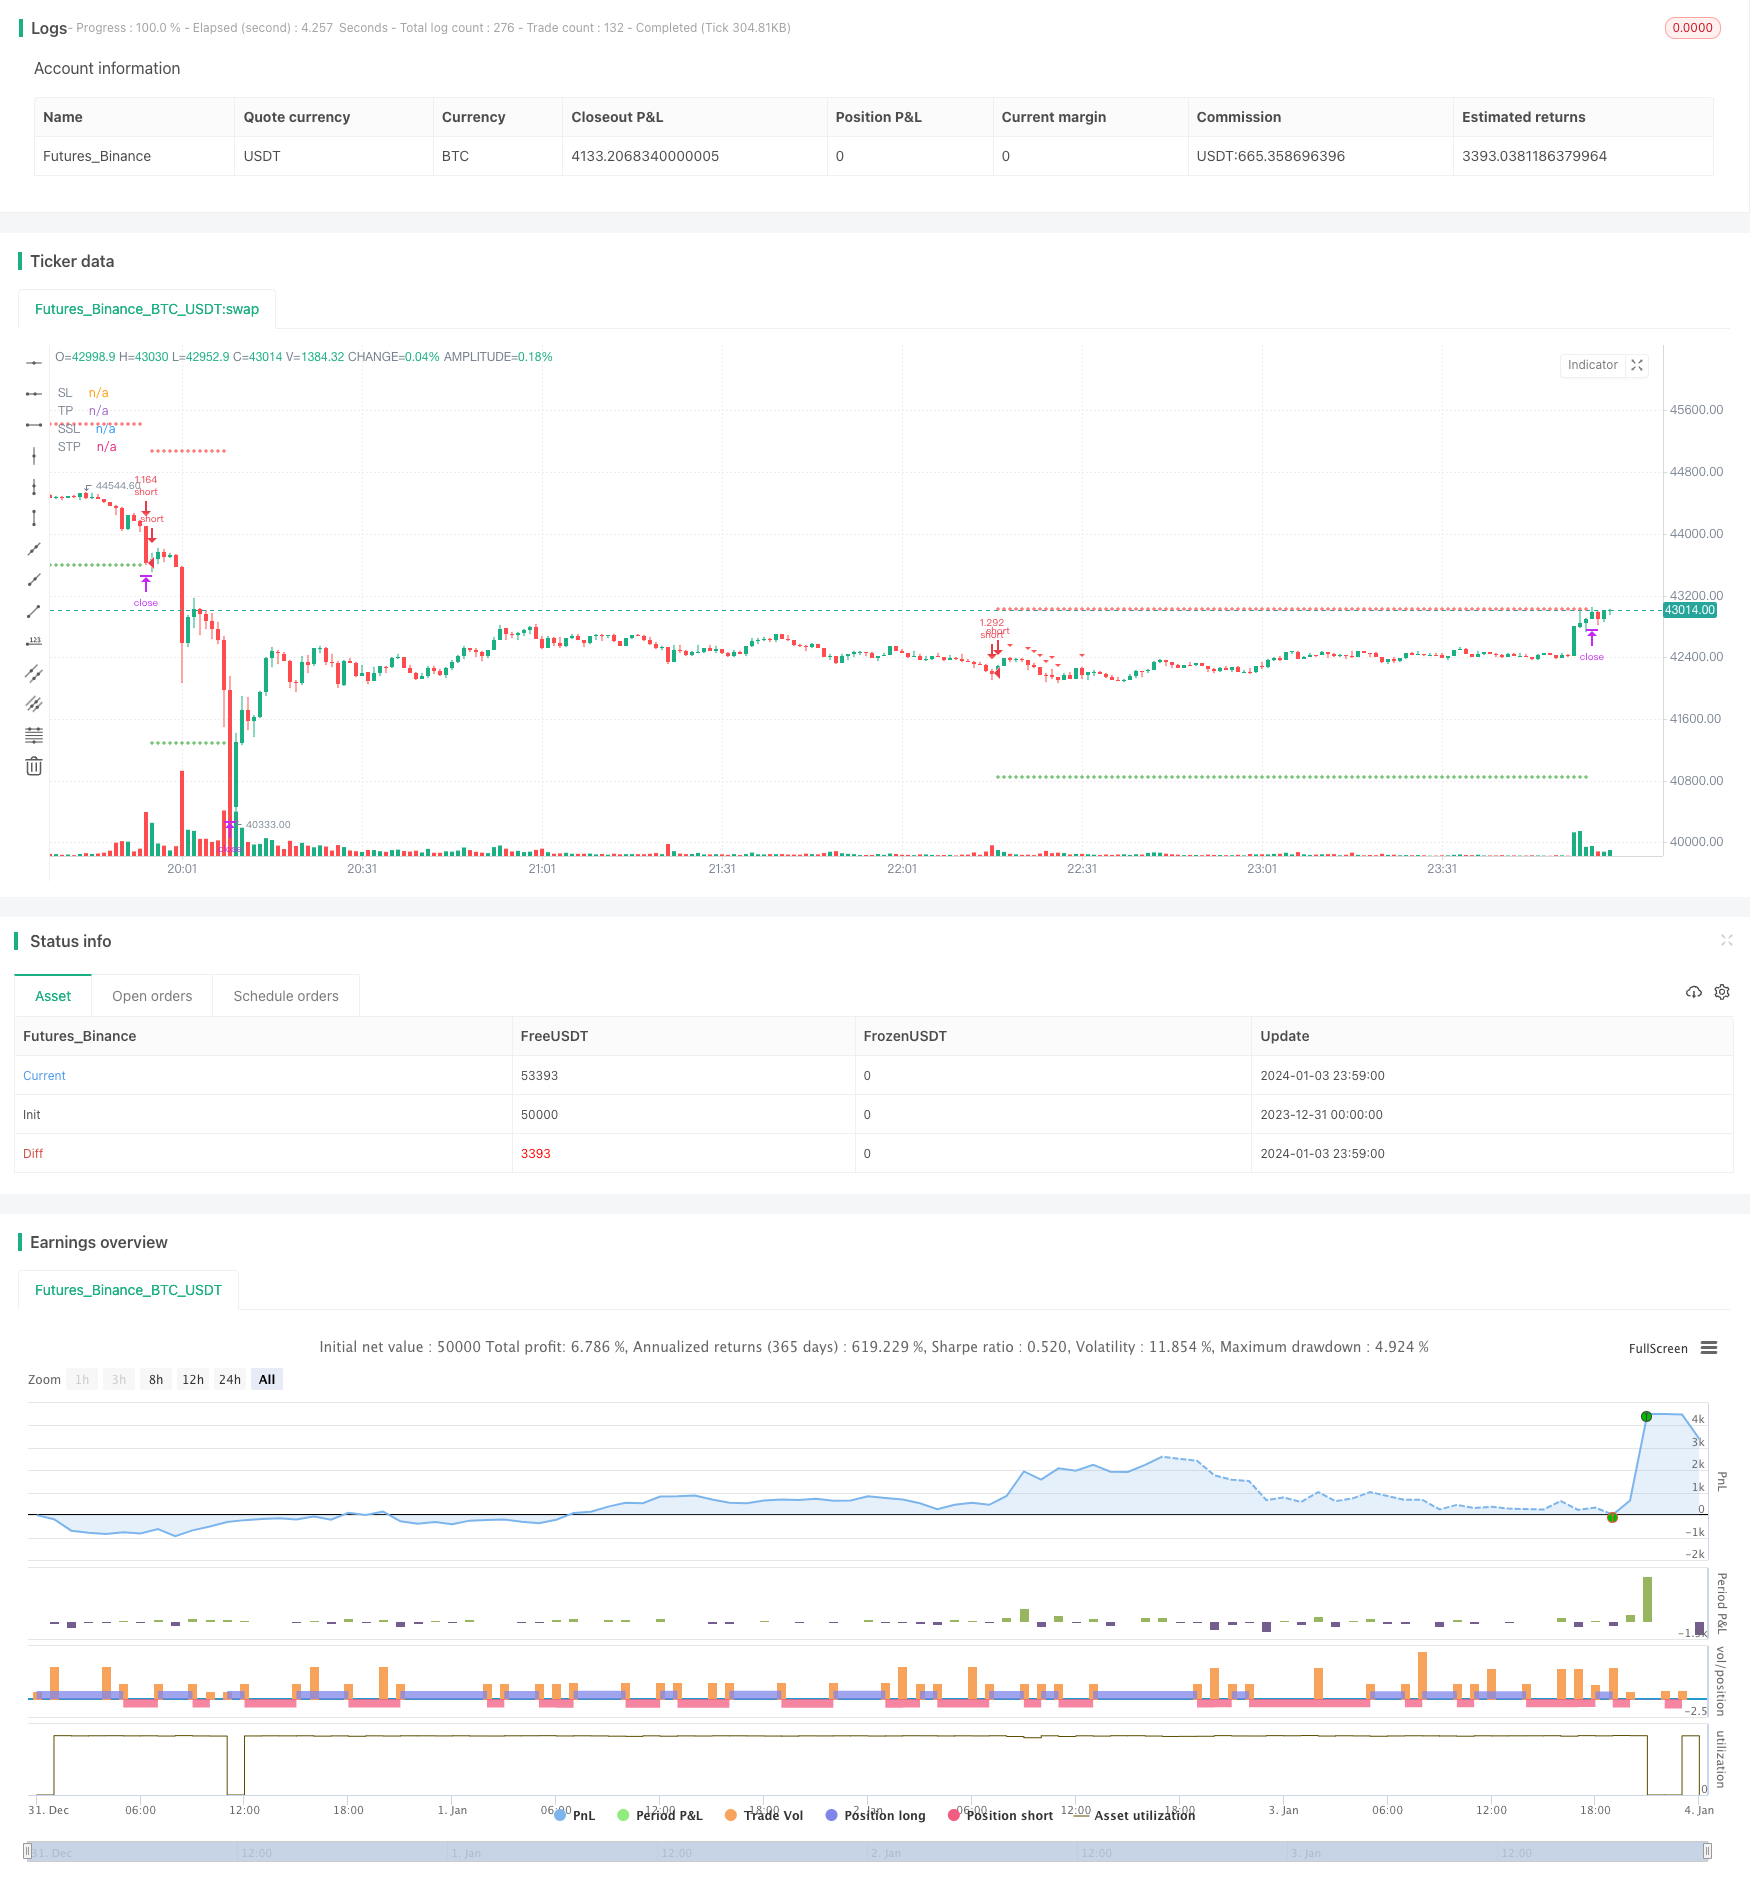
概述
自定义向上突破策略是一种基于价格行情判断的量化交易策略。该策略通过计算指定周期内的正向K线占比,来判断市场目前是否处于持续上涨的状态。当正向K线占比高于用户设定的上限时,策略判断目前处于上涨行情,此时做多;当正向K线占比低于用户设定的下限时,策略判断目前处于下跌行情,此时做空。
策略原理
该策略的核心指标是正向K线占比。正向K线指从低点开盘,收盘价高于开盘价的K线,表示该周期内价格上涨。策略通过统计用户指定的往期周期内,正向K线数量占所有K线的比例,当比例大于上限时判断目前处于持续上涨行情,此时做多;当比例小于下限时判断目前处于持续下跌行情,此时做空。做多做空的止损、止盈根据用户设定的止损方式来设置。
举例:用户设置周期数为20,上限为70,下限为30。策略回溯最近20根K线,如果其中有16根为正向K线,占比为16/20=80%。此时高于用户设置的上限70,执行做多操作。如果最近20根K线中,只有5根为正向K线,占比为5/20=25%。低于用户设置的下限30,执行做空操作。
优势分析
该策略具有如下优势:
- 策略思路简单直观,容易理解;
- 仅需要一个指标,降低了过优化的风险;
- 用户可以自定义参数,适应不同品种;
- 内置止损止盈功能,可以预防超大亏损;
- 可直接反向做单,无需等待平仓再开仓,追踪行情更快。
风险分析
该策略也存在一些风险:
- 只利用一个指标容易产生错误信号;
- 指标参数容易过优化,实盘效果可能差异大;
- 行情剧烈波动时,止损可能被突破导致亏损;
- 反向开仓功能可能加大亏损;
- 效果与品种相关性大,需要分别测试。
为了降低风险,可以从以下几个方面进行优化:
- 增加过滤条件,避免错误信号;
- 优化止损策略,缩小单笔亏损;
- 评估和控制单笔损失额度;
- 分别在不同品种测试效果。
优化方向
该策略可以从以下几个方向进行优化:
- 增加量价合理性等辅助判断指标,避免错误信号
- 优化止损方式,可以考虑移动止损、振荡止损等
- 增加开仓过滤条件,例如突破布林线再入场
- 测试不同的正向K线参数对不同品种的适应性
- 评估最大回撤,控制单笔亏损规模
总结
自定义向上突破策略整体思路清晰简单,通过统计正向K线占比判断持续上涨或下跌状态,利用简单指标捕捉趋势。该策略容易理解,用户友好,适合量化交易的初学者实践。但仅依赖单一指标和参数设置存在一定盈利波动性,需要针对策略的风险继续优化,使其能够在更多市场中稳定获利。
策略源码
/*backtest
start: 2023-12-31 00:00:00
end: 2024-01-04 00:00:00
period: 1m
basePeriod: 1m
exchanges: [{"eid":"Futures_Binance","currency":"BTC_USDT"}]
*/


// This source code is subject to the terms of the Mozilla Public License 2.0 at https://mozilla.org/MPL/2.0/
// © ZenAndTheArtOfTrading
// © TweakerID

// Based on the calculations by ZenAndTheArtOfTrading, I added stop loss, take profit and reverse line codes.
// The Positive Bars % calculates the number of green (positive) bars, relative to a lookback period, defined
// by the user. If the percentage is low, it means that there was a bigger number of red candles in the
// lookback period. The strategy goes long when the percentage is high and short when it's low, although
// this logic can be reversed with positive results on different time frames.

//@version=4
strategy("Positive Bars % Strat",
     overlay=true,
     default_qty_type=strategy.percent_of_equity,
     default_qty_value=100,
     initial_capital=10000,
     commission_value=0.04,
     calc_on_every_tick=false,
     slippage=0)

direction = input(0, title = "Strategy Direction", type=input.integer, minval=-1, maxval=1)
strategy.risk.allow_entry_in(direction == 0 ? strategy.direction.all : (direction < 0 ? strategy.direction.short : strategy.direction.long))

/////////////////////// STRATEGY INPUTS ////////////////////////////////////////
title1=input(true, "-----------------Strategy Inputs-------------------")

lookback = input(title="Lookback", type=input.integer, defval=13)
upperLimit = input(title="Upper Limit", type=input.integer, defval=70)
lowerLimit = input(title="Lower Limit", type=input.integer, defval=30)

/////////////////////// BACKTESTER /////////////////////////////////////////////
title2=input(true, "-----------------General Inputs-------------------")

// Backtester General Inputs
i_SL=input(true, title="Use Stop Loss and Take Profit")
i_SLType=input(defval="ATR Stop", title="Type Of Stop", options=["Strategy Stop", "Swing Lo/Hi", "ATR Stop"])
i_SPL=input(defval=10, title="Swing Point Lookback")
i_PercIncrement=input(defval=2, step=.1, title="Swing Point SL Perc Increment")*0.01
i_ATR = input(14, title="ATR Length")
i_ATRMult = input(10, step=.1, title="ATR Multiple")
i_TPRRR = input(1.6, step=.1, title="Take Profit Risk Reward Ratio")

// Bought and Sold Boolean Signal
bought = strategy.position_size > strategy.position_size[1]
 or strategy.position_size < strategy.position_size[1]

// Price Action Stop and Take Profit
LL=(lowest(i_SPL))*(1-i_PercIncrement)
HH=(highest(i_SPL))*(1+i_PercIncrement)
LL_price = valuewhen(bought, LL, 0)
HH_price = valuewhen(bought, HH, 0)
entry_LL_price = strategy.position_size > 0 ? LL_price : na
entry_HH_price = strategy.position_size < 0 ? HH_price : na
tp=strategy.position_avg_price + (strategy.position_avg_price - entry_LL_price)*i_TPRRR
stp=strategy.position_avg_price - (entry_HH_price - strategy.position_avg_price)*i_TPRRR

// ATR Stop
ATR=atr(i_ATR)*i_ATRMult
ATRLong = ohlc4 - ATR
ATRShort = ohlc4 + ATR
ATRLongStop = valuewhen(bought, ATRLong, 0)
ATRShortStop = valuewhen(bought, ATRShort, 0)
LongSL_ATR_price = strategy.position_size > 0 ? ATRLongStop : na
ShortSL_ATR_price = strategy.position_size < 0 ? ATRShortStop : na
ATRtp=strategy.position_avg_price + (strategy.position_avg_price - LongSL_ATR_price)*i_TPRRR
ATRstp=strategy.position_avg_price - (ShortSL_ATR_price - strategy.position_avg_price)*i_TPRRR

// Strategy Stop
float LongStop = na
float ShortStop = na
float StratTP = na
float StratSTP = na

/////////////////////// STRATEGY LOGIC /////////////////////////////////////////

//Calculations
positiveBars = 0
for i = (lookback - 1) to 0
    if close[i] > open[i]
        positiveBars := positiveBars + 1
positiveBarsPercent = (positiveBars / lookback) * 100

BUY=positiveBarsPercent >= upperLimit
SELL=positiveBarsPercent <= lowerLimit

//Trading Inputs
DPR=input(true, "Allow Direct Position Reverse")
reverse=input(false, "Reverse Trades")

// Entries
if reverse
    if not DPR
        strategy.entry("long", strategy.long, when=SELL and strategy.position_size == 0)
        strategy.entry("short", strategy.short, when=BUY and strategy.position_size == 0)
    else
        strategy.entry("long", strategy.long, when=SELL)
        strategy.entry("short", strategy.short, when=BUY)
else
    if not DPR
        strategy.entry("long", strategy.long, when=BUY and strategy.position_size == 0)
        strategy.entry("short", strategy.short, when=SELL and strategy.position_size == 0)
    else
        strategy.entry("long", strategy.long, when=BUY)
        strategy.entry("short", strategy.short, when=SELL)


SL= i_SLType == "Swing Lo/Hi" ? entry_LL_price : i_SLType == "ATR Stop" ? LongSL_ATR_price : LongStop
SSL= i_SLType == "Swing Lo/Hi" ? entry_HH_price : i_SLType == "ATR Stop" ? ShortSL_ATR_price : ShortStop
TP= i_SLType == "Swing Lo/Hi" ? tp : i_SLType == "ATR Stop" ? ATRtp : StratTP
STP= i_SLType == "Swing Lo/Hi" ? stp : i_SLType == "ATR Stop" ? ATRstp : StratSTP

strategy.exit("TP & SL", "long", limit=TP, stop=SL, when=i_SL)
strategy.exit("TP & SL", "short", limit=STP, stop=SSL, when=i_SL)

/////////////////////// PLOTS //////////////////////////////////////////////////

plot(i_SL and strategy.position_size > 0 ? SL : na , title='SL', style=plot.style_cross, color=color.red)
plot(i_SL and strategy.position_size < 0 ? SSL : na , title='SSL', style=plot.style_cross, color=color.red)
plot(i_SL and strategy.position_size > 0 ? TP : na, title='TP', style=plot.style_cross, color=color.green)
plot(i_SL and strategy.position_size < 0 ? STP : na, title='STP', style=plot.style_cross, color=color.green)
// Draw price action setup arrows
plotshape(BUY ? 1 : na, style=shape.triangleup, location=location.belowbar,
 color=color.green, title="Bullish Setup", size=size.auto)
plotshape(SELL ? 1 : na, style=shape.triangledown, location=location.abovebar,
 color=color.red, title="Bearish Setup", size=size.auto)