概述
该策略采用移动平均线和平均真实波动率来判断市场趋势方向,根据趋势方向进行趋势追踪交易。
策略原理
该策略使用len周期的移动平均线ma和2倍的len周期平均真实波动率atr来判断市场趋势。具体判断规则是:
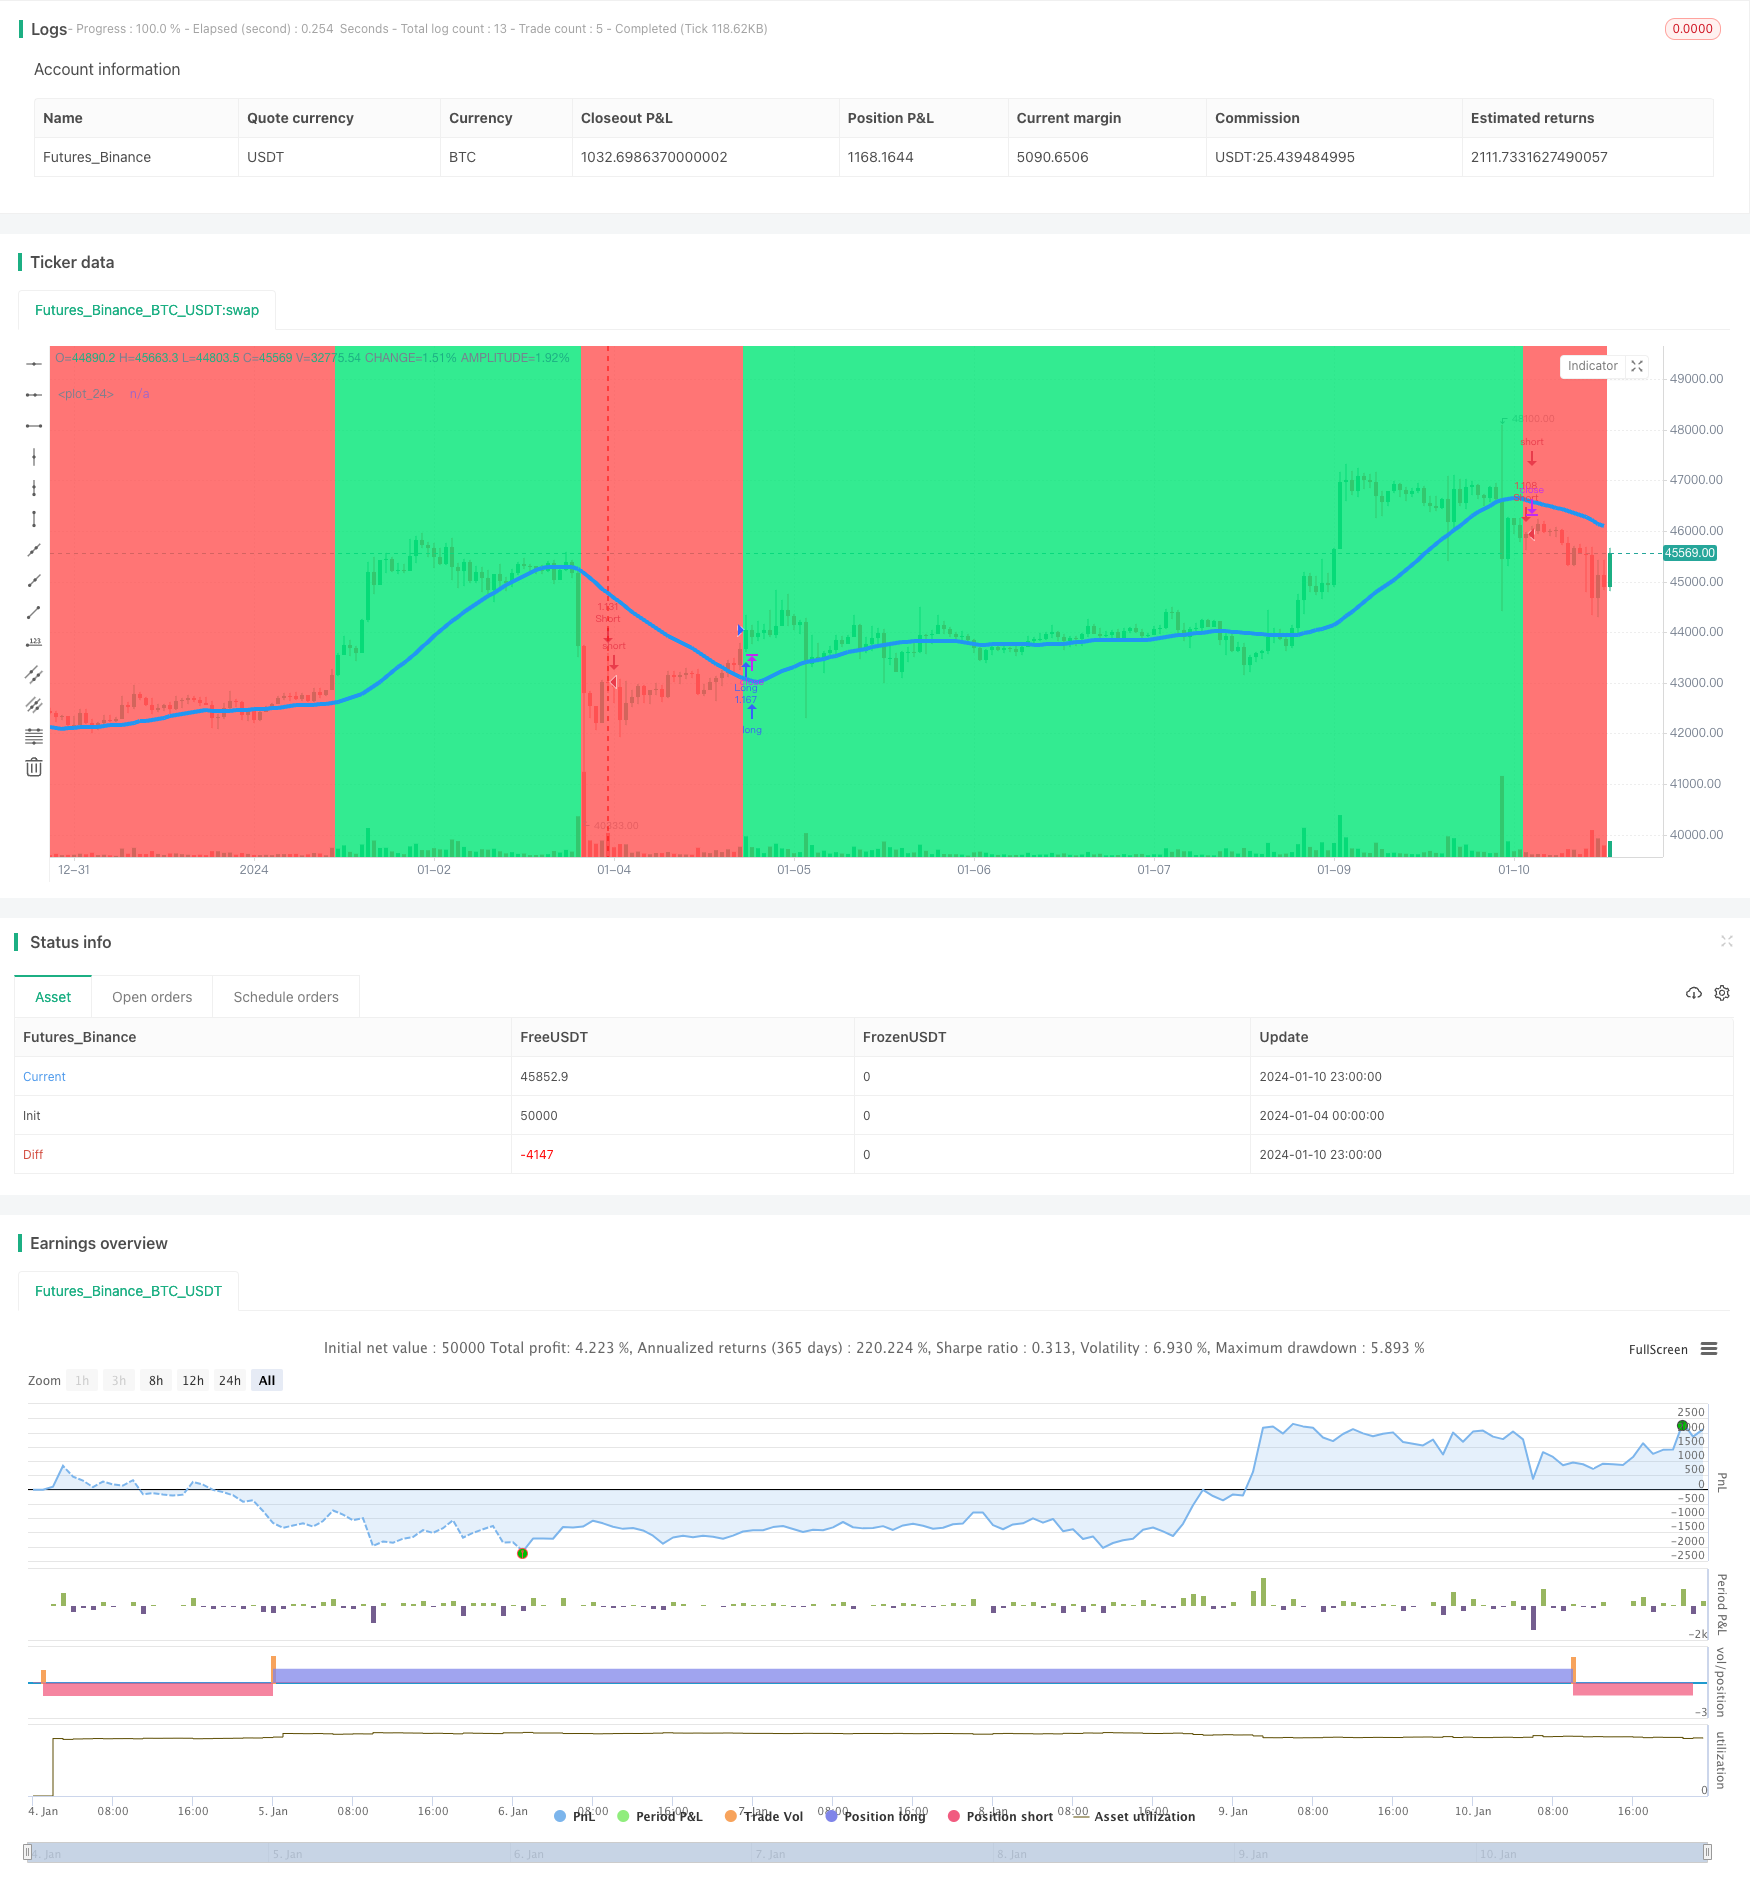
当最低价大于移动平均线加上平均真实波动率时(low > ma + atr),判断为上升趋势。
当最高价小于移动平均线减去平均真实波动率时(high < ma - atr),判断为下降趋势。
其他情况则保持之前的判断。
在判断出上升趋势时,当允许做多时,按照一定比例做多。
在判断出下降趋势时,当允许做空时,按照一定比例做空。
平仓条件为到达指定的交易结束日期。
优势分析
该策略具有以下优势:
- 使用移动平均线判断大致趋势方向,避免被市场短期波动误导。
- 借助平均真实波动率来设置动态止损,有利于控制风险。
- 能够顺势而为,及时捕捉趋势机会,收益潜力较大。
- 规则相对简单易操作。
风险分析
该策略面临以下主要风险:
- 大幅震荡市场中,容易出现多次亏损。
- 无法有效判断趋势反转点,可能出现追高杀跌的风险。
- 平均真实波动率参数设置不当可能导致退出点过于宽松或过于严格。
解决方法:
- 适当调整移动平均线参数,使用更稳定的参数。
- 结合其它指标确认信号,避免追高杀跌。
- 对平均真实波动率参数进行优化测试,设置合适参数。
优化方向
该策略可以从以下几个方面进行优化:
- 测试不同平均线系统,寻找更稳定的参数组合。
- 加入其它辅助指标判断信号的可靠性。
- 对平均真实波动率参数进行测试,找到最佳参数。
- 优化资金利用率,通过杠杆提高收益率。
- 结合机器学习等方法实现参数的动态优化。
总结
该策略整体思路清晰、易于理解,使用移动平均线判断趋势方向,并利用平均真实波动率设定止损,能够有效跟踪趋势。但存在一定的风险,需要进一步优化参数设定以及加入其他判断指标。总的来说,该策略为趋势追踪交易提供了一个可行的思路。
策略源码
/*backtest
start: 2024-01-04 00:00:00
end: 2024-01-11 00:00:00
period: 1h
basePeriod: 15m
exchanges: [{"eid":"Futures_Binance","currency":"BTC_USDT"}]
*/

//2019
//Noro

//@version=4
strategy(title = "Noro's MA+ATR Strategy", shorttitle = "MA+ATR str", overlay = true, default_qty_type = strategy.percent_of_equity, default_qty_value = 100, pyramiding = 0)

//Settings
needlong = input(true, defval = true, title = "Long")
needshort = input(true, defval = true, title = "Short")
capital = input(100, defval = 100, minval = 1, maxval = 10000, title = "Capital, %")
len = input(30, minval = 2, title = "MA Length")
src = input(ohlc4, title = "MA Source")
limitmode = input(false)
fromyear = input(1900, defval = 1900, minval = 1900, maxval = 2100, title = "From Year")
toyear = input(2100, defval = 2100, minval = 1900, maxval = 2100, title = "To Year")
frommonth = input(01, defval = 01, minval = 01, maxval = 12, title = "From Month")
tomonth = input(12, defval = 12, minval = 01, maxval = 12, title = "To Month")
fromday = input(01, defval = 01, minval = 01, maxval = 31, title = "From day")
today = input(31, defval = 31, minval = 01, maxval = 31, title = "To day")

//MA + BG
atr = sma(tr, len) * 2
ma = sma(src, len)
plot(ma, color = color.blue, linewidth = 4)
trend = 0
trend := low > ma + atr ? 1 : high < ma - atr ? -1 : trend[1]
col = trend == 1 ? color.lime : color.red
bgcolor(col, transp = 70)

//Trading
lot = 0.0
lot := strategy.position_size != strategy.position_size[1] ? strategy.equity / close * capital / 100 : lot[1]
if trend == 1 and limitmode == false
    strategy.entry("Long", strategy.long, needlong == false ? 0 : lot)
if trend == -1 and limitmode == false
    strategy.entry("Short", strategy.short, needshort == false ? 0 : lot)
if trend == 1 and limitmode
    strategy.entry("Long", strategy.long, needlong == false ? 0 : lot)
if trend == -1 and limitmode
    strategy.entry("Short", strategy.short, needshort == false ? 0 : lot)
// if time > timestamp(toyear, tomonth, today, 23, 59)
//     strategy.close_all()