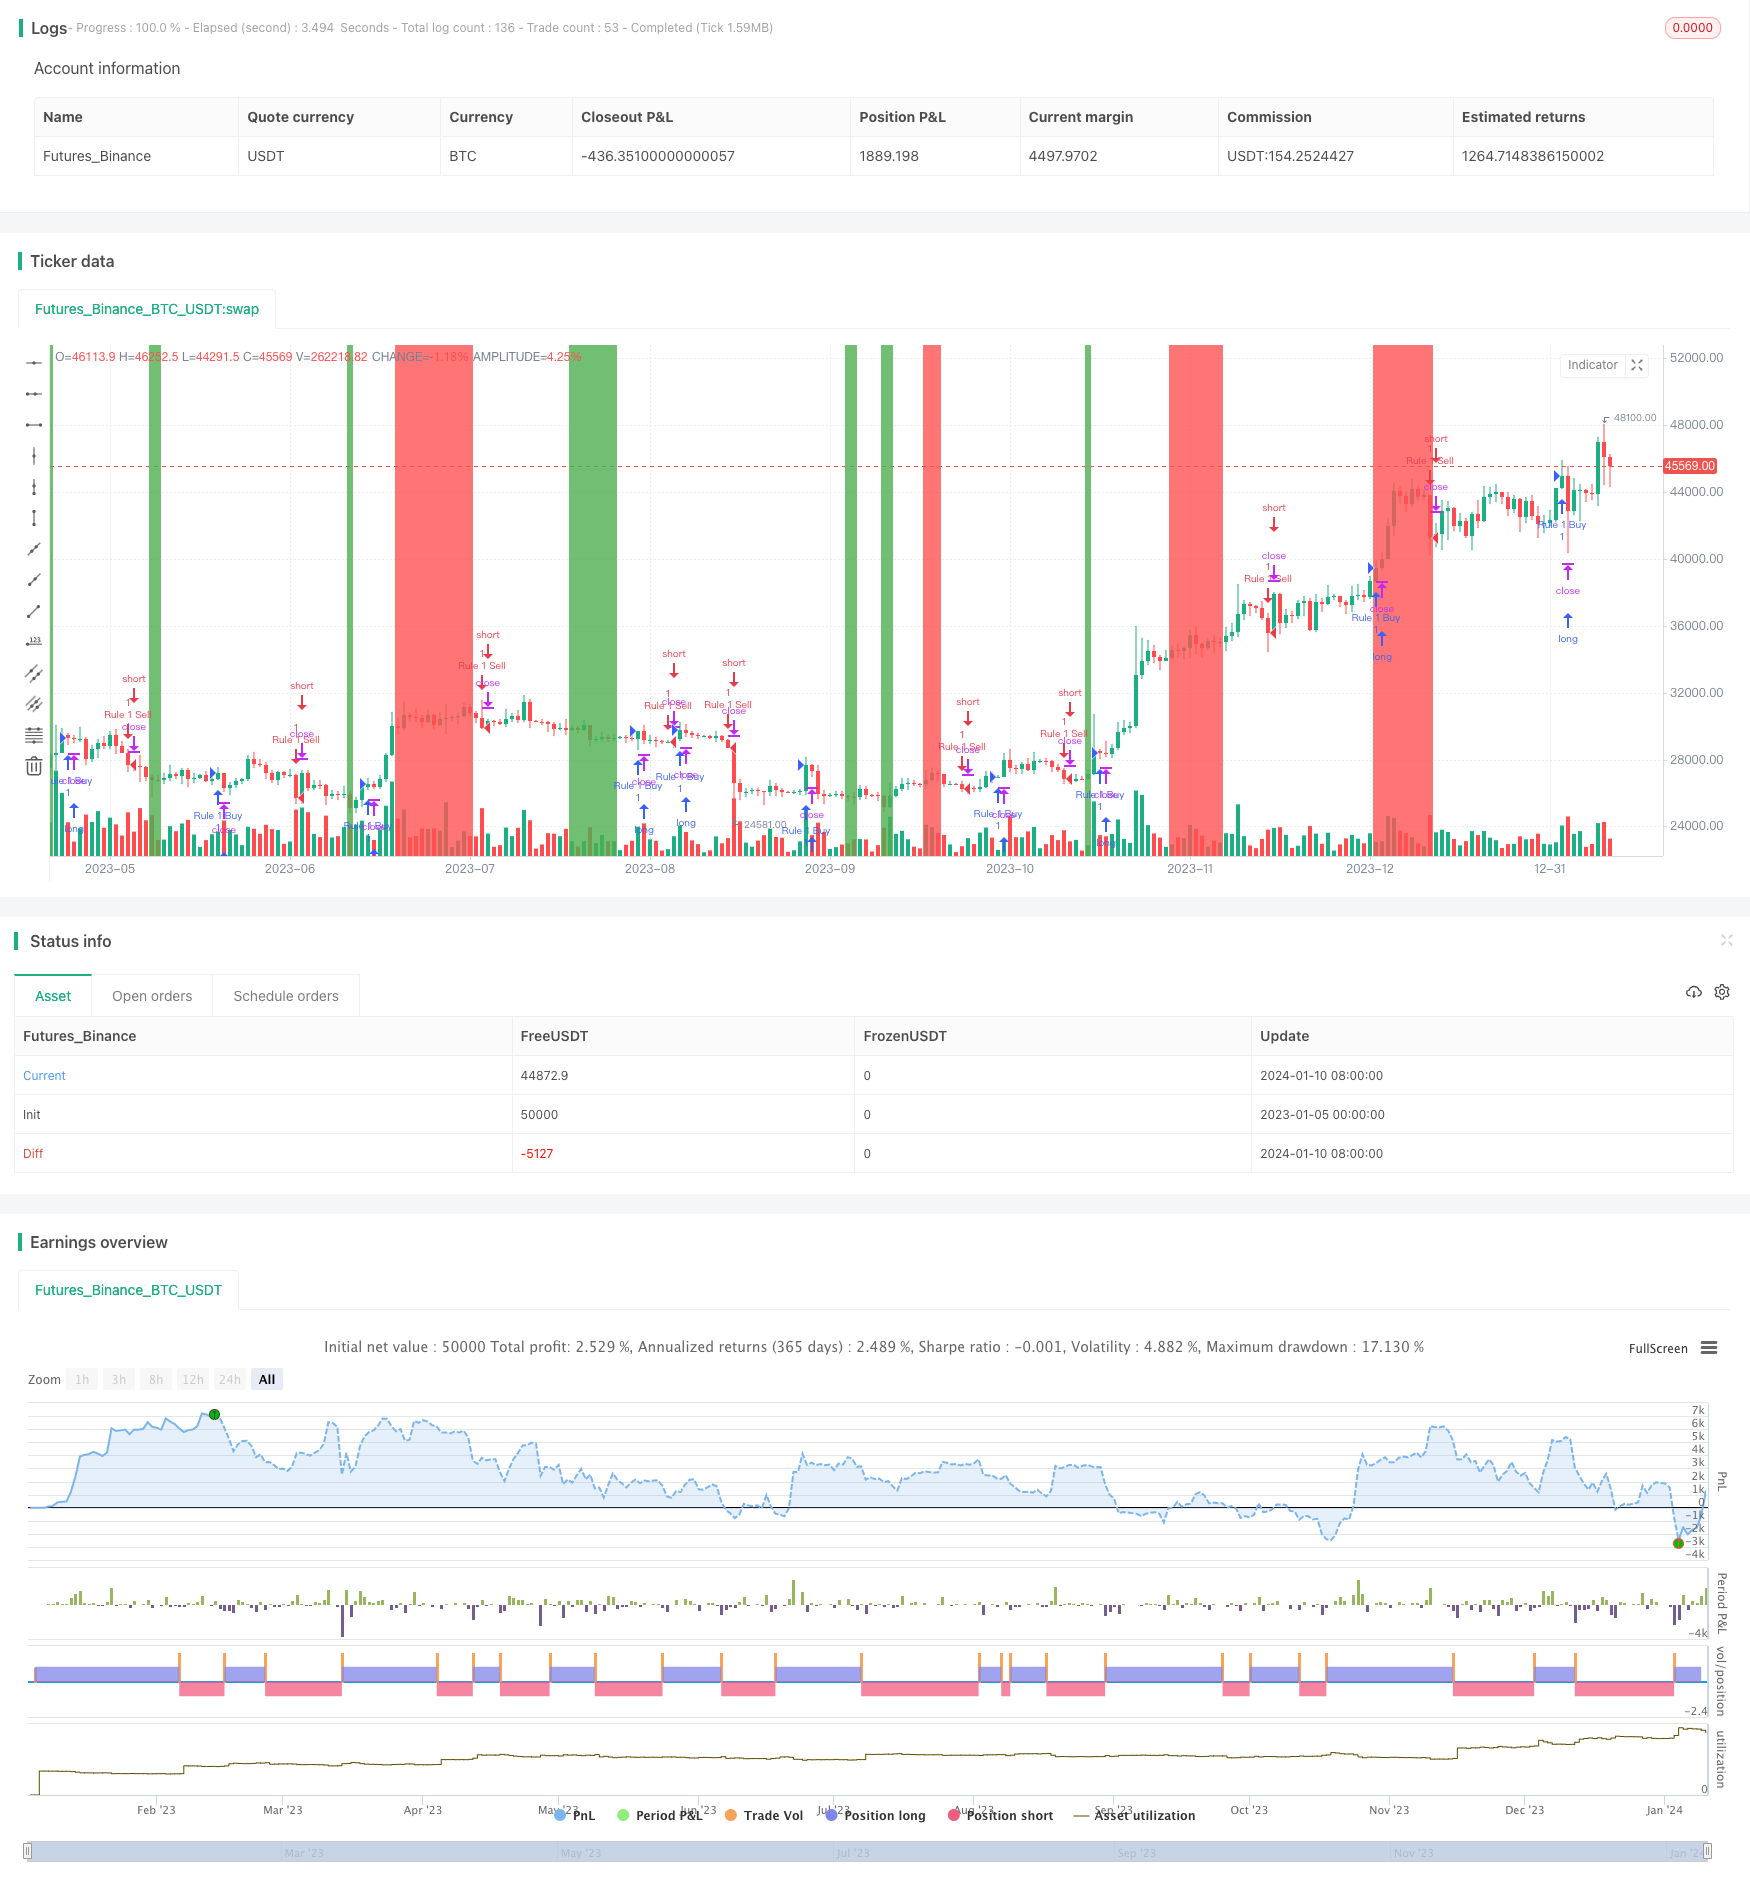
概述
多指标趋势追踪交易策略是一种同时结合MACD、随机指标和SMA移动平均线的量化交易策略。该策略致力于识别市场的趋势方向,在趋势开始建立时及时进入市场,然后利用多种指标的组合信号判断何时退出市场。
策略原理
该策略同时使用MACD、随机指标和SMA三种技术指标来判断市场的趋势方向和强弱。当MACD差值上穿0轴线、随机指标%K线上穿%D线且高于超买线、SMA快线上穿慢线时,买入信号被触发;当相反的情况发生时,识别到卖出信号。
通过组合多种指标,可以过滤假信号,识别真正的趋势开始和结束。同时,不同指标之间可以形成验证,降低错误交易的概率。
策略优势分析
该策略最大的优势在于指标组合使用,可以有效过滤噪音,锁定真实趋势的开始和结束。相比单一使用MACD、随机指标或SMA等,识别效果要好很多。
另外,该策略对参数调节灵活,可以根据不同品种和周期进行调整,适应性强。
策略风险分析
该策略主要的风险在于多指标组合增加了交易频率,可能带来过度交易的风险。此外,参数设置不当也会带来错误交易的风险。
为降低风险,应适当控制交易频率,选用长周期,并优化参数组合。必要时可以考虑止损来控制单笔损失。
策略优化方向
该策略可以从以下几个方面进行优化:
- 测试不同商品和不同周期参数的效果
- 增加指标的权重和过滤条件,降低错误信号
- 结合止损来控制风险
- 进一步优化指标参数,提高盈利因子
总结
多指标趋势追踪交易策略通过指标的组合验证提高了信号的准确性,能有效识别趋势的开始和结束。参数优化和风险控制是该策略成功的关键。总体来说,该策略回撤小、盈利空间大,是一种非常实用的量化交易策略。
策略源码
/*backtest
start: 2023-01-05 00:00:00
end: 2024-01-11 00:00:00
period: 1d
basePeriod: 1h
exchanges: [{"eid":"Futures_Binance","currency":"BTC_USDT"}]
*/

//@version=3
strategy("Rule Number 1 Signals", overlay=true)

//Calculate MACD crossing or not
fastLength = input(8)
slowlength = input(17)
MACDLength = input(9)

MACD = ema(close, fastLength) - ema(close, slowlength)
aMACD = ema(MACD, MACDLength)
macdDelta = MACD - aMACD

//Calculate Stochastic Crossing

stochasticLength = input(14, minval=1)
stochasticOverBought = input(80)
stochasticOverSold = input(20)
emaSignal = input(10)
smoothK = 5
smoothD = 5

k = sma(stoch(close, high, low, stochasticLength), smoothK)
d = sma(k, smoothD)

//Crossovers and Over /Under
macdCrossOver = crossover(macdDelta, 0)
macdCrossUnder = crossunder(macdDelta, 0)
macdOver = macdDelta > 0
macdUnder = macdDelta < 0

stochasticCrossOver = crossover(k, d)
stochasticCrossUnder = crossunder(k, d)
stochasticOver = k > d
stochasticUnder = k < d

ema = ema(close, emaSignal)
smaCrossOver = crossover(close, ema)
smaCrossUnder = crossunder(close, ema)
smaOver = close > ema
smaUnder = close < ema

if ((macdCrossOver and stochasticOver and smaOver) or (macdOver and stochasticCrossOver and smaOver) or (macdOver and stochasticOver and smaCrossOver))
    strategy.entry("Rule 1 Buy", strategy.long, comment="Rule 1 Buy")
if ((macdCrossUnder and stochasticUnder and smaUnder) or (macdUnder and stochasticCrossUnder and smaUnder) or (macdUnder and stochasticUnder and smaCrossUnder))
    strategy.entry("Rule 1 Sell", strategy.short, comment="Rule 1 Sell")


//Plot the Oversold Study
bgcol = k < stochasticOverSold ? green : k > stochasticOverBought ? red : na
bgcolor(bgcol)