这是一种使用布林带指标进行交易的策略。该策略旨在利用布林带指标识别价格剧烈波动的时机,并相应做出买入或卖出决策。
策略原理
该策略通过计算布林带的上轨、中轨和下轨线,判断当前价格是否处于波动区间,以判断建仓或平仓的时机。当价格接近上轨时,视为多头极限区域,策略选择卖出平仓;当价格下探近下轨时,则视为空头极限区域,策略选择买入建仓。
此外,策略还引入趋势反转因子,如果出现反转信号,也会触发对应买入或卖出决策。具体来说,策略逻辑如下:
- 计算布林带的上轨、中轨、下轨
- 判断价格是否突破轨道与反转信号
- 突破中轨作为趋势信号
- 上轨或下轨附近作为反转信号
- 发出买入、卖出或平仓指令
以上是该策略的基本交易逻辑。通过利用布林带的特性,结合趋势和反转因子,策略试图在波动加剧时抓住反转点位进行交易。
策略优势
相比普通的移动平均线策略,该策略有以下几点优势:
- 更加灵敏,能够捕捉价格剧烈波动的时机
- 同时结合趋势和反转因子,避免过早反转带来的亏损
- 具有一定的 FILTER 效果,避免在非波动区域无谓买卖
- 通过中轨判断主要趋势方向,减少交易次数
- 增加反转过滤条件,降低了误判概率
总的来说,该策略较好地结合了布林带与价格实体判断,在合理反转点进行交易,既保证了一定的盈利水平,也控制了风险。
风险与优化
然而,该策略也存在一定风险,主要体现在:
- 布林带参数设置不当,无法充分捕捉价格波动
- 反转信号判断不准确,漏失反转或误判反转
- 趋势不明显时,中轨信号效果不佳
对应地,未来可从以下几个方面进行优化:
- 根据不同品种参数自适应优化布林带参数
- 增加机器学习模型判断反转概率
- 在趋势不明时,切换至其他指标判断
- 结合更多价格形态来过滤交易信号
总结
本策略总体来说是一种典型的布林带交易策略模板。它规避了仅使用布林带容易产生的较多无效交易的缺点,通过引入趋势反转判断来有效过滤信号,在理论上可以获得较好的策略表现。但是参数设置与信号过滤方面仍需进一步优化与改进,才能使策略参数鲁棒化并降低误判概率。
策略源码
/*backtest
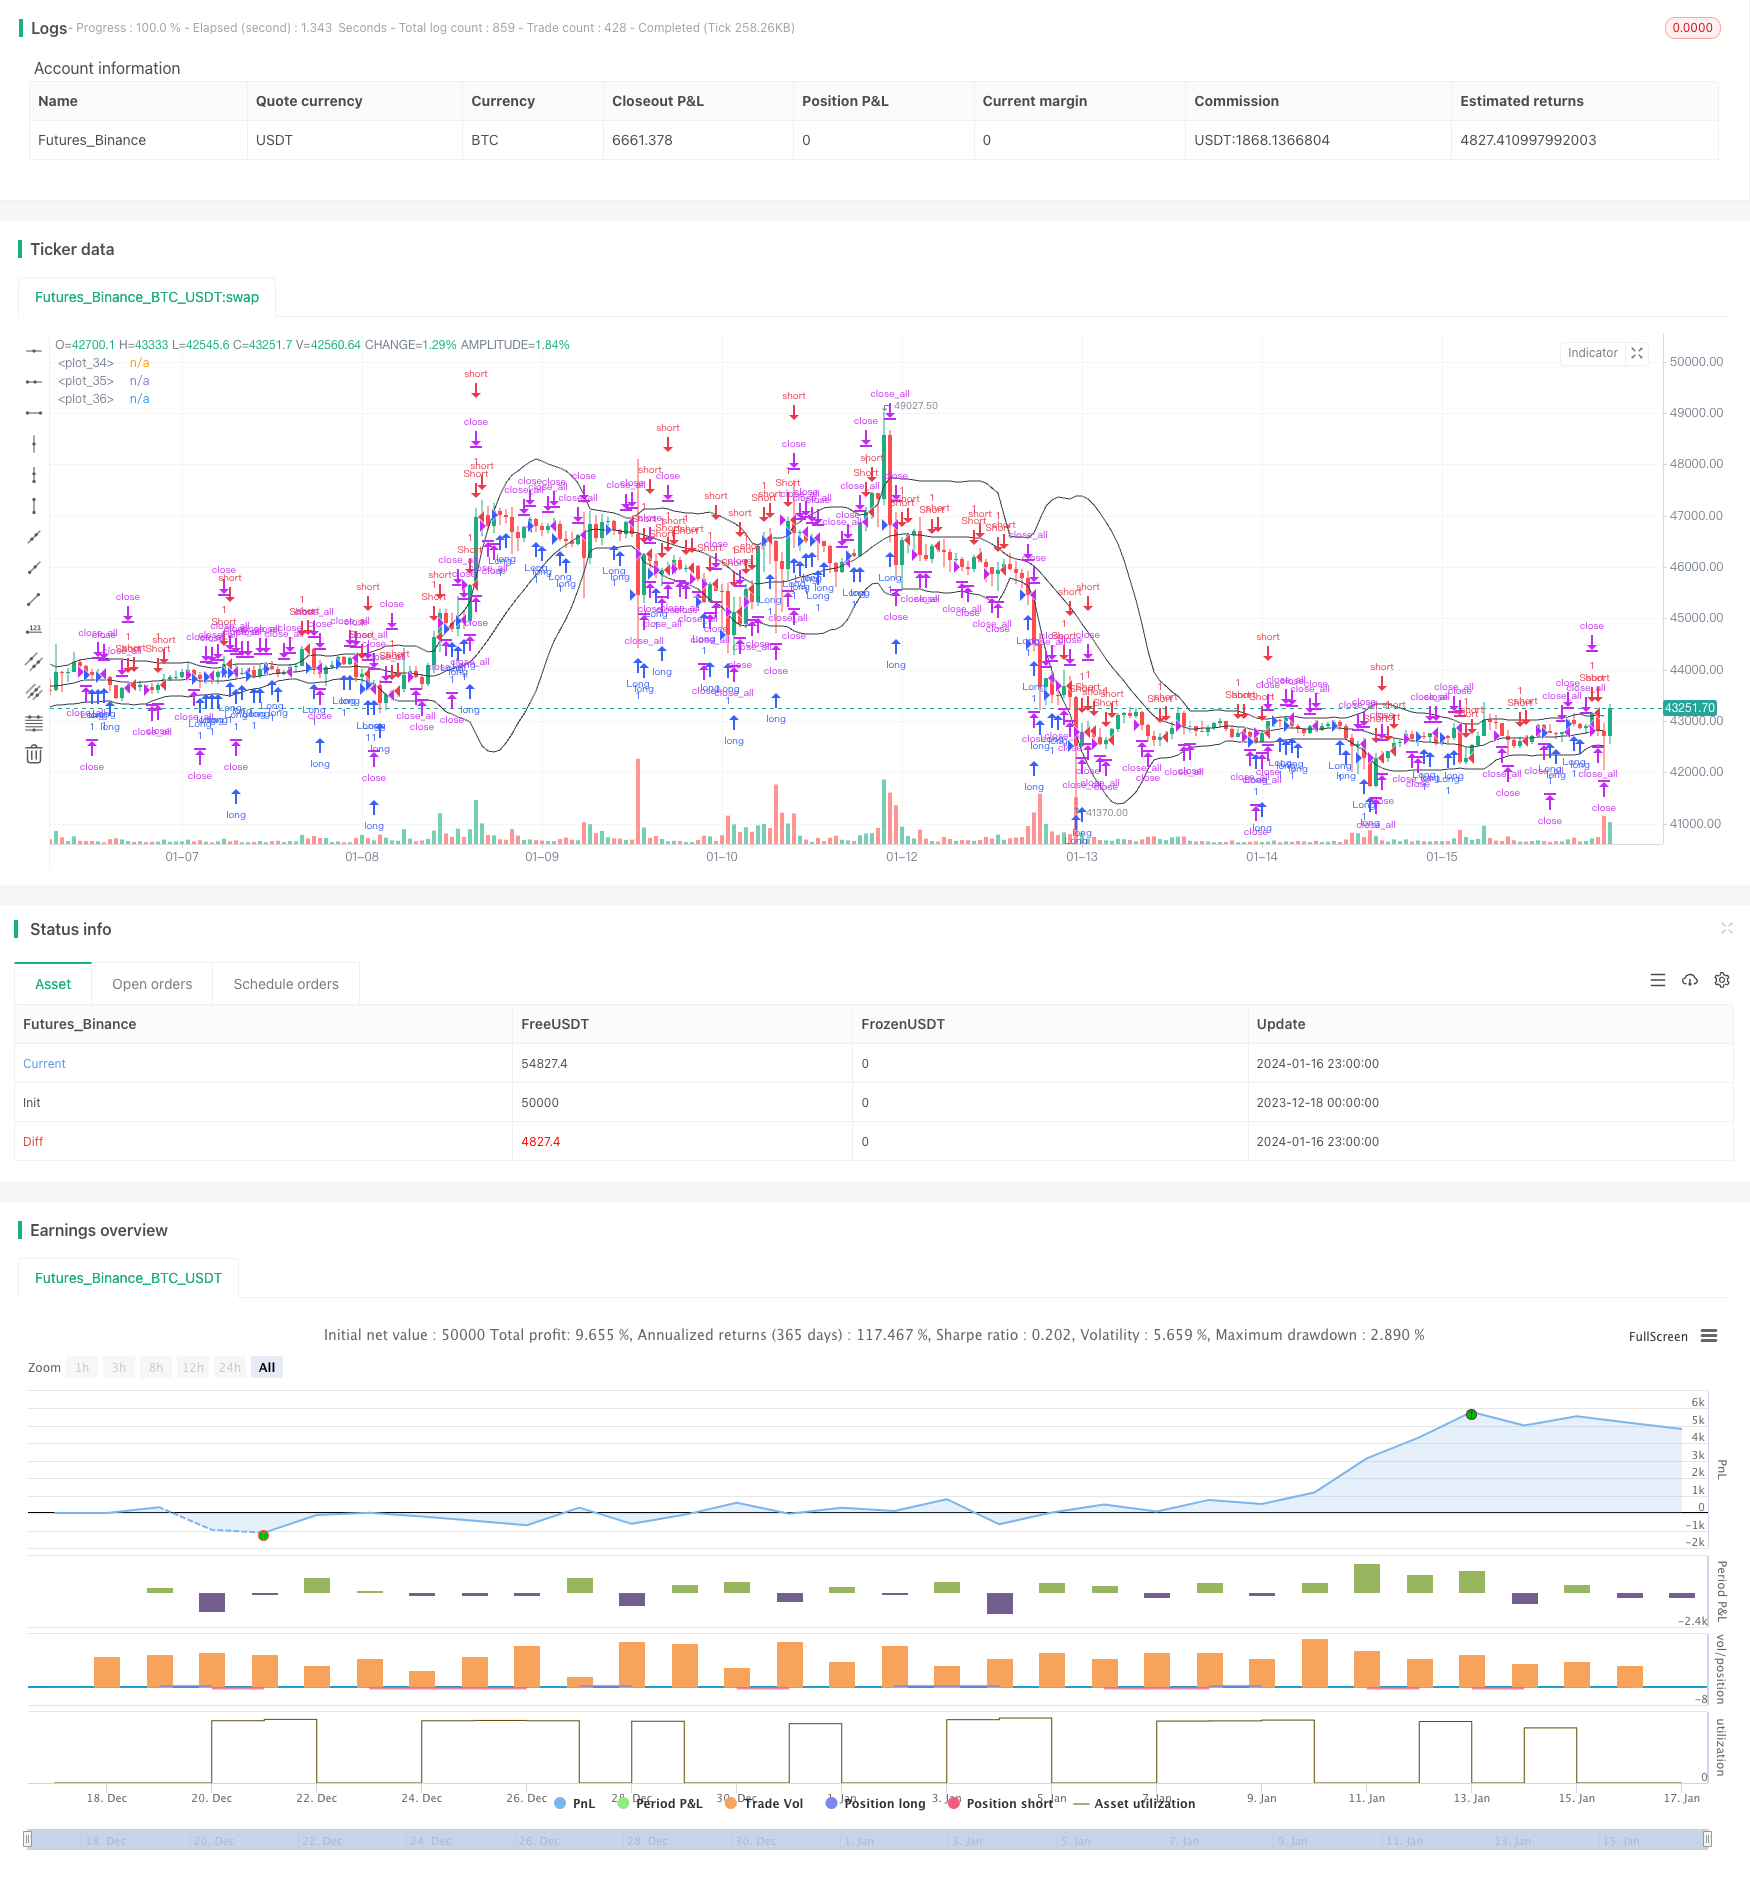
start: 2023-12-18 00:00:00
end: 2024-01-17 00:00:00
period: 1h
basePeriod: 15m
exchanges: [{"eid":"Futures_Binance","currency":"BTC_USDT"}]
*/
//Noro
//2018
//@version=3
strategy("Noro's Bollinger Strategy v1.2", shorttitle = "Bollinger str 1.2", overlay = true )
//Settings
needlong = input(true, defval = true, title = "Long")
needshort = input(true, defval = true, title = "Short")
length = input(20, defval = 20, minval = 1, maxval = 1000, title = "Bollinger Length")
mult = input(2.0, defval = 2.0, minval = 0.001, maxval = 50, title = "Bollinger Mult")
source = input(ohlc4, defval = ohlc4, title = "Bollinger Source")
uset = input(true, defval = true, title = "Use trend entry")
usect = input(true, defval = true, title = "Use counter-trend entry")
fromyear = input(2018, defval = 2018, minval = 1900, maxval = 2100, title = "From Year")
toyear = input(2100, defval = 2100, minval = 1900, maxval = 2100, title = "To Year")
frommonth = input(01, defval = 01, minval = 01, maxval = 12, title = "From Month")
tomonth = input(12, defval = 12, minval = 01, maxval = 12, title = "To Month")
fromday = input(01, defval = 01, minval = 01, maxval = 31, title = "From day")
today = input(31, defval = 31, minval = 01, maxval = 31, title = "To day")
showbands = input(true, defval = true, title = "Show Bollinger Bands")
//Bollinger Bands
basis = sma(source, length)
dev = mult * stdev(source, length)
upper = basis + dev
lower = basis - dev
//Lines
col = showbands ? black : na
plot(upper, linewidth = 1, color = col)
plot(basis, linewidth = 1, color = col)
plot(lower, linewidth = 1, color = col)
//Body
body = abs(close - open)
abody = ema(body, 30)
//Signals
bar = close > open ? 1 : close < open ? -1 : 0
up1 = bar == -1 and close >= basis and close < upper and (close < strategy.position_avg_price or strategy.position_size == 0) and uset
dn1 = bar == 1 and close <= basis and close > lower and (close > strategy.position_avg_price or strategy.position_size == 0) and uset
up2 = close <= lower and usect
dn2 = close >= upper and usect
exit = (strategy.position_size > 0 and close > open) or (strategy.position_size < 0 and close < open) and body > abody / 2
//Trading
if up1 or up2
strategy.entry("Long", strategy.long, needlong == false ? 0 : na)
if dn1 or dn2
strategy.entry("Short", strategy.short, needshort == false ? 0 : na)
if exit
strategy.close_all()