资源加载中... loading...

Aggressive Bottom Sniping Quantitative Strategy

Author: ChaoZhang, Date: 2024-01-18 16:25:33
Tags:

img

Overview

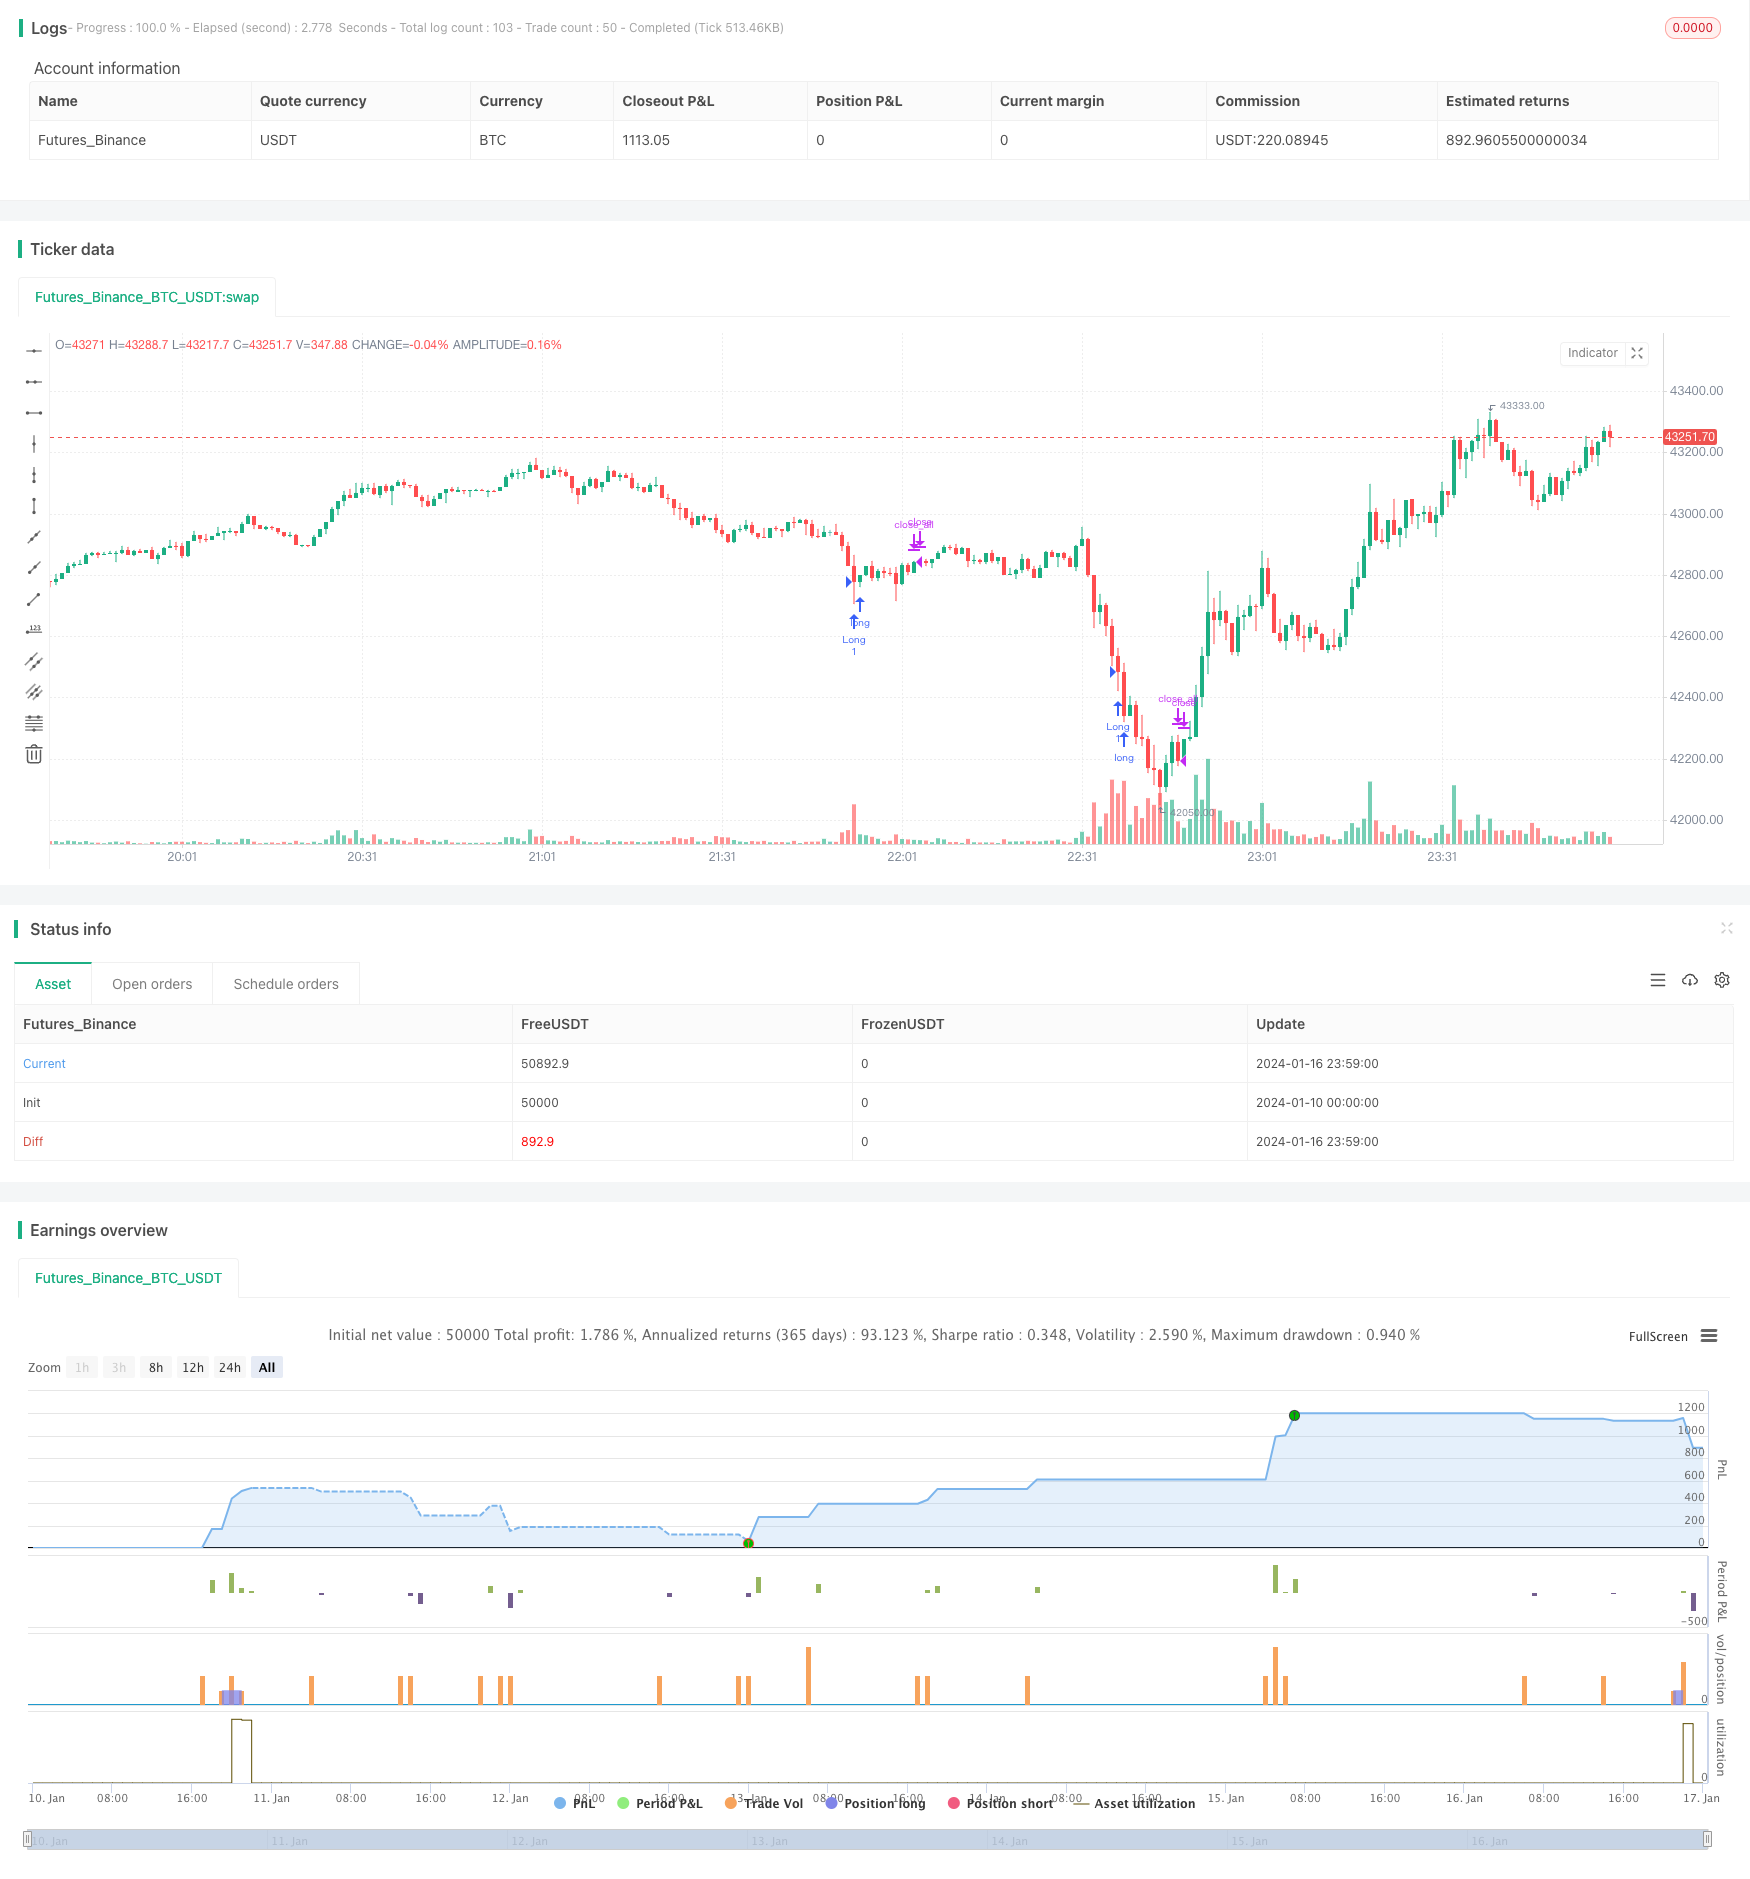
This strategy identifies short-term bottoms by detecting outstanding volume in a downtrend, and takes long positions during oversold conditions. It is an aggressive short-term trading strategy.

Strategy Principles

When the volume exceeds 2 standard deviations above the SMA-based average volume, it is considered outstanding volume. Meanwhile, RSI below 30 indicates oversold status. When both conditions are met, it is judged as a short-term bottom and long position is taken immediately. The position will be closed after a certain period of time (e.g. 10 bars).

So the logic of this strategy is simple:

  1. Calculate 20-bar SMA of volume as benchmark
  2. Calculate 2 standard deviation of 20-bar volume as threshold for outstanding volume
  3. Calculate 20-bar RSI to judge oversold status
  4. When volume exceeds benchmark + 2 standard deviation and RSI < 30, judge as short-term bottom
  5. Take long position immediately at bottom
  6. Close position after 10 bars automatically

Advantage Analysis

The advantages of this strategy include:

  1. Simple logic, easy to understand and optimize
  2. Utilize outstanding volume to detect short-term turning points
  3. RSI ensures only taking longs in oversold zone, avoiding chasing tops
  4. Automatic stop loss maximizes risk evasion at bottoms

In summary, this strategy takes advantage of volume breakouts to catch trend reversals, while strictly controlling risks. It is a reliable aggressive long strategy.

Risk Analysis

The main risks of this strategy include:

  1. Volume and RSI may generate false breakout signals, causing wrong longs and losses.
  2. Fixed stop loss time may fail to stop loss or stop loss too early during significant market reversal.
  3. Suboptimal parameter tuning may lead to too few or too many signals.

To address these risks, optimization can be done in the following aspects:

  1. Add other indicators to filter false breakout signals.
  2. Set dynamic trailing stop loss instead of fixed number of bars.
  3. Comprehensive parameter testing and tuning to ensure robustness.

Optimization Directions

This strategy can be further optimized in the following aspects:

  1. Add ML model to judge reliability of volume breakouts to avoid false signals
  2. Add adaptive stop loss mechanism instead of fixed bars
  3. Multi-dimensional dataset optimization for outstanding volume parameters
  4. Increase accuracy of oversold signals using ML screening
  5. Incorporate sentiment analysis to improve alpha

By introducing more advanced techniques, significant improvement can be achieved on stability, alpha and Sharpe ratio.

Conclusion

In summary, this is a very simple, straightforward and logical short-term breakout strategy. By properly leveraging volume to detect trend reversals, and strictly controlling risks, solid performance can be achieved. But risks of false signals and parameter robustness exist. These can be addressed incrementally by introducing more advanced techniques to further improve the strategy.


/*backtest
start: 2024-01-10 00:00:00
end: 2024-01-17 00:00:00
period: 1m
basePeriod: 1m
exchanges: [{"eid":"Futures_Binance","currency":"BTC_USDT"}]
*/

// This source code is subject to the terms of the Mozilla Public License 2.0 at https://mozilla.org/MPL/2.0/
// © footlz

//@version=4
strategy("Bottom catch strategy", overlay=true)

v_len = input(20, title="Volume SMA Length")
mult = input(2)
rsi_len = input(20, title="RSI Length")
oversold = input(30, title="Oversold")
close_time = input(10, title="Close After")

v = volume
basis = sma(v, v_len)
dev = mult * stdev(v, v_len)
upper_volume = basis + dev

rsi = rsi(close, rsi_len)

long = v > upper_volume and rsi < oversold

strategy.entry("Long", true, when=long)

passed_time = 0.0
if strategy.position_size != 0
    passed_time := 1
else
    passed_time := 0

if strategy.position_size != 0 and strategy.position_size[1] != 0
    passed_time := passed_time[1] + 1

if passed_time >= close_time
    strategy.close_all()

// If want to enable plot, change overlay=false.
v_color = close >= close[1] ? color.new(#3eb370, 0) : color.new(#e9546b, 0)

// plot(v, title="volume", color=v_color, style=plot.style_columns)
// plot(upper_volume, title="Threshold", color=color.aqua)

More