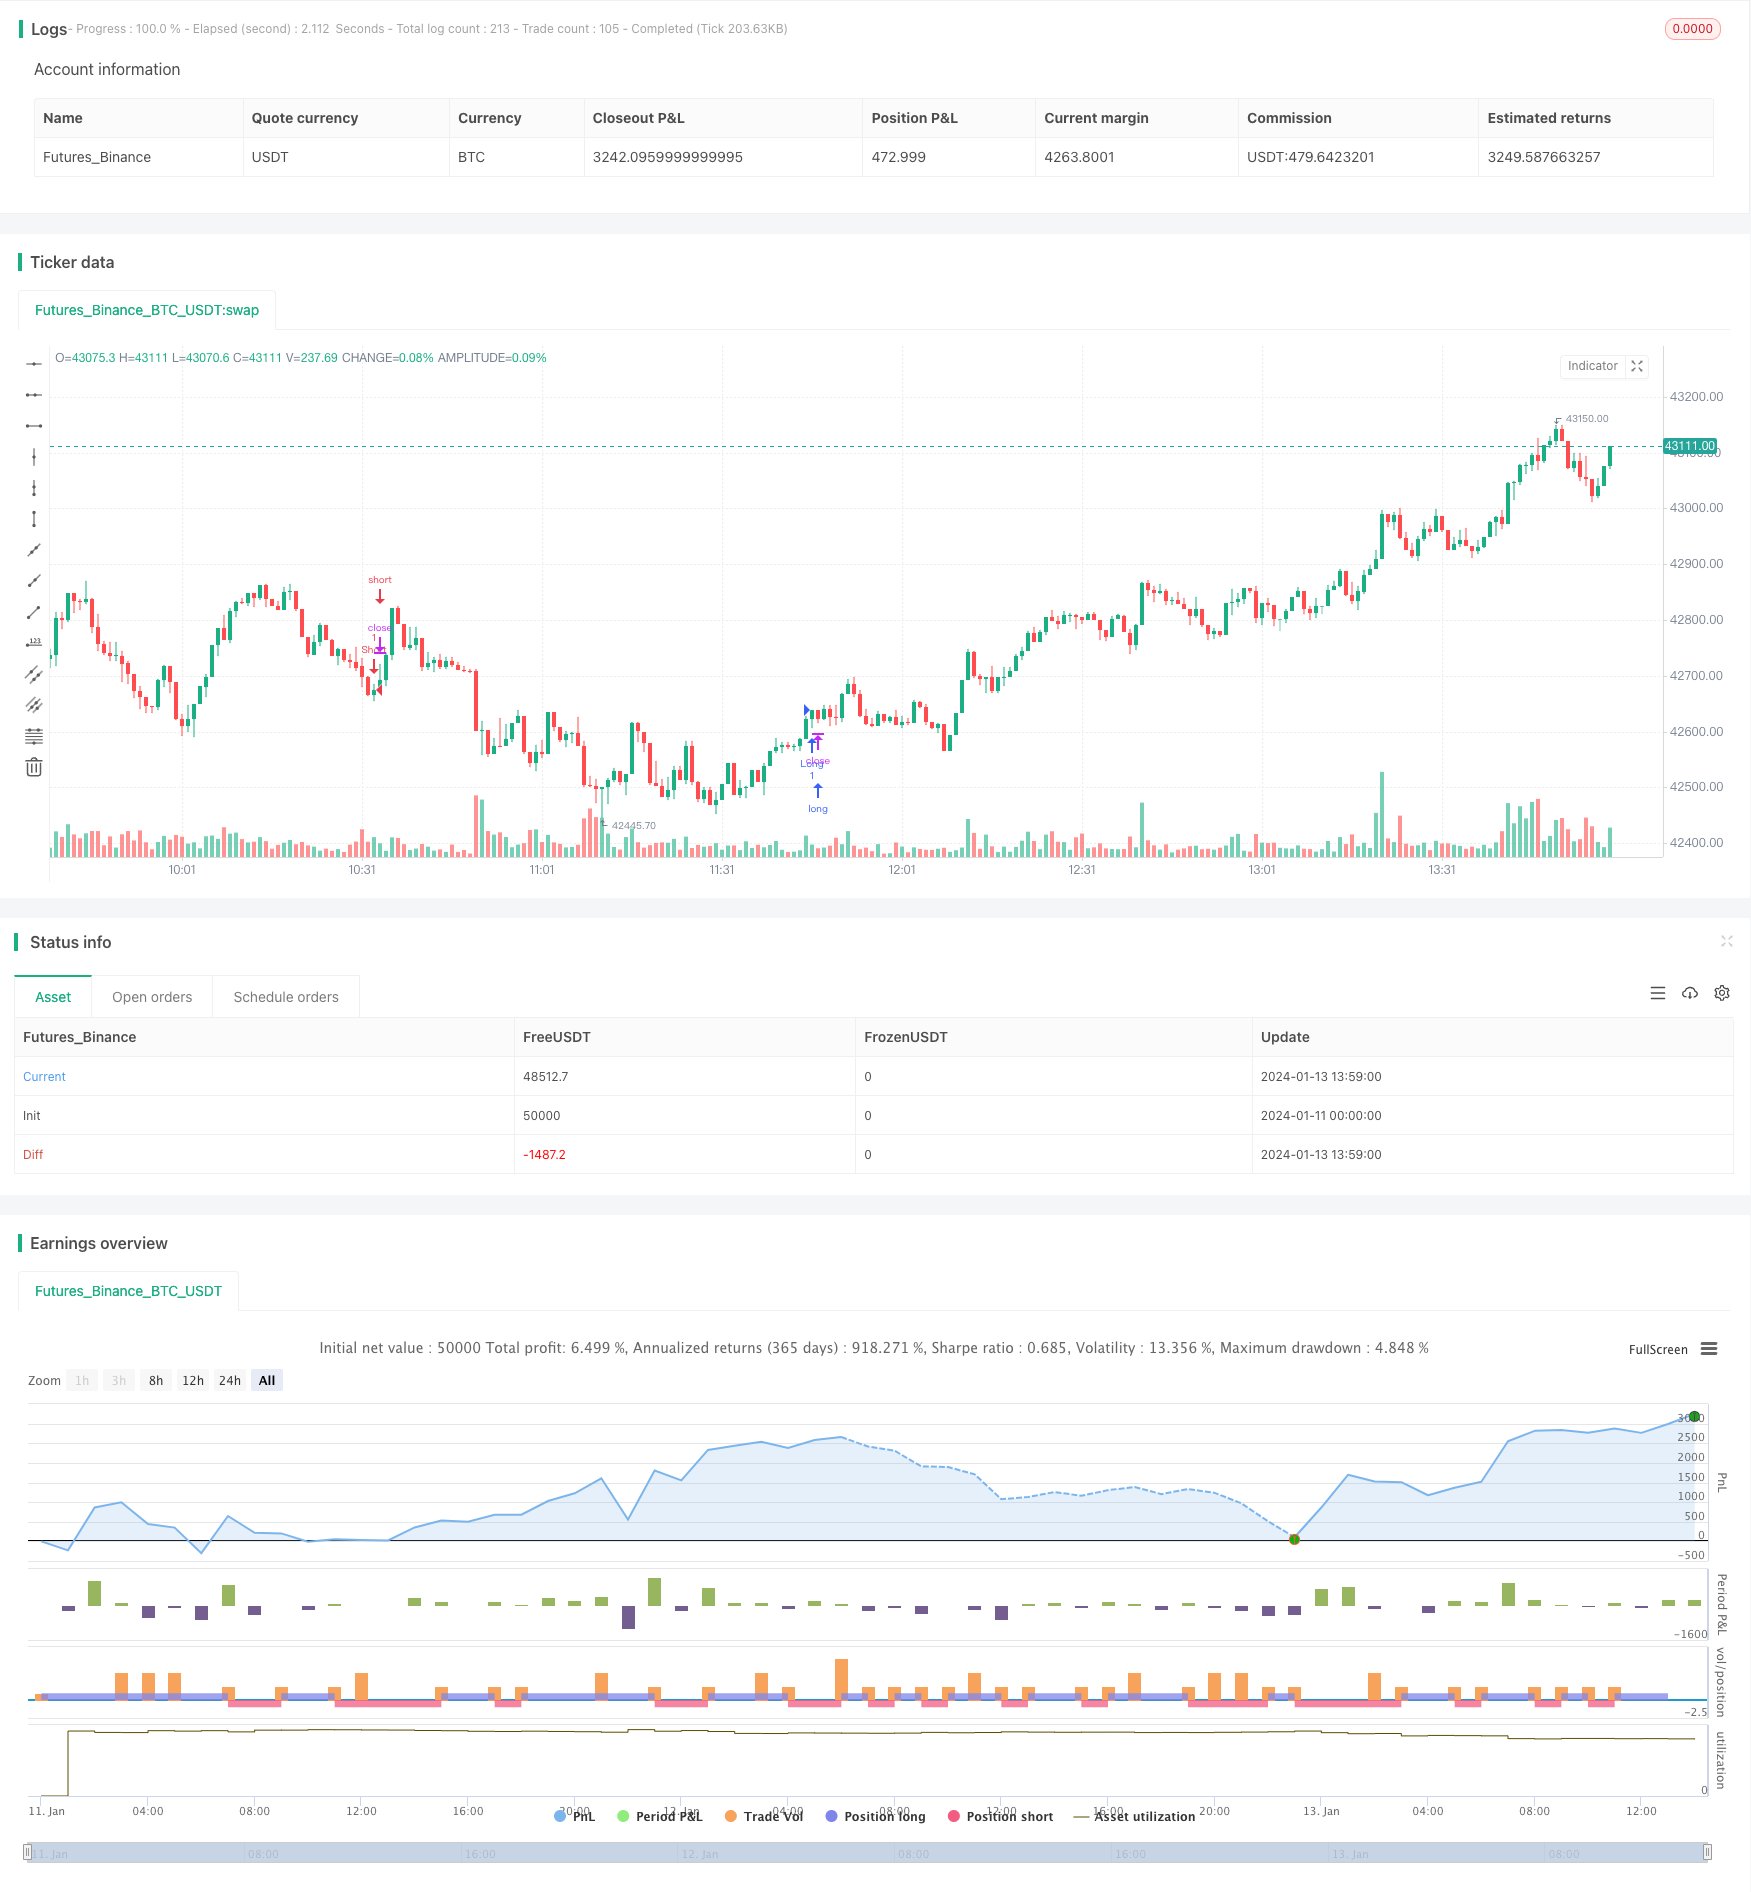
概述
该策略是一个结合一云图指标和多种辅助指标的趋势跟踪策略。主要使用一云图判断趋势方向,辅以MACD,CMF,TSI等指标进行过滤,以提高信号质量。这是一个多因素综合判断的强势趋势策略。
策略原理
该策略主要利用一云图的变换来判断趋势方向。当天线上穿云带时做多,下穿云带时做空。同时结合备胎线、MACD柱形图、资金流指标CMF和真实力指数TSI来进行多层过滤,确保信号质量。
具体来说,做多信号的触发条件是:
- 天线上穿云带
- 云带较宽,转向线在基准线之上
- 延迟线在0轴之上
- 收盘价在云带之上
- MACD柱形图在0轴之上
- CMF大于0.1
- TSI在0轴之上
做空信号的触发条件则为上述条件的相反。这样通过多种指标的综合判断,能有效过滤掉大部分假信号,锁定市场的主要趋势。
策略优势
该策略最大的优势在于多指标组合滤掉假信号,抓住强势趋势。具体来说,主要有以下几个优势:
- 一云图判断主趋势方向,确保大方向正确
- 辅助指标进一步过滤信号,减少交易风险
- 全面考量多时间周期因素,信号更加可靠
- 条件严格,只交易高质量信号,避免平淡市
- 结合趋势跟踪,最大限度锁定趋势利润
通过上述综合判断,策略可以有效抓住股市的中长线热点板块,进行趋势跟踪套利,获得丰厚的超额收益。
策略风险
该策略主要面临以下几个方面的风险:
- 假突破风险。当价格出现假突破时候,容易产生错误信号。
- 趋势反转风险。股票运行具有规律性,长跑必有回头,存在损失全部盈利的可能。
- 交易频率偏低风险。条件较为严格,可能错过部分机会。
对应降低风险的方法有:
- 适当放宽过滤条件,增加交易频率。
- 增加止损条件,避免亏损扩大。
- 优化参数,提高信号准确率。
策略优化方向
该策略主要可以从以下几个方面进行优化:
参数优化。可以通过更多回测数据对参数进行优化,找到更佳参数组合。
增加止损机制。适当放宽入场条件,但设置止损来控制风险。
增加移动止损。利用趋势跟踪止损来锁定利润,避免反转损失。
优化过滤指标。可以测试更多指标,找到更好的组合过滤信号。
增加自动识别突破真伪的规则。避免追高杀跌的风险。
总结
该策略综合运用一云图与多种辅助指标判断效果显著。通过参数优化、止损机制改进、指标优化等手段,可以进一步增强策略稳定性,提高信号质量,获得更高的稳定收益。该策略具有较强的实用性。
策略源码
/*backtest
start: 2024-01-11 00:00:00
end: 2024-01-13 14:00:00
period: 1m
basePeriod: 1m
exchanges: [{"eid":"Futures_Binance","currency":"BTC_USDT"}]
*/

// This source code is subject to the terms of the Mozilla Public License 2.0 at https://mozilla.org/MPL/2.0/
// © exlux99

//@version=4
strategy("Ichimoku with MACD/ CMF/ TSI", overlay=true, margin_long=0, margin_short=0)


//Inputs
ts_bars = input(10, minval=1, title="Tenkan-Sen Bars")
ks_bars = input(30, minval=1, title="Kijun-Sen Bars")
ssb_bars = input(52, minval=1, title="Senkou-Span B Bars")
cs_offset = input(26, minval=1, title="Chikou-Span Offset")
ss_offset = input(26, minval=1, title="Senkou-Span Offset")
long_entry = input(true, title="Long Entry")
short_entry = input(true, title="Short Entry")

middle(len) => avg(lowest(len), highest(len))

// Ichimoku Components
tenkan = middle(ts_bars)
kijun = middle(ks_bars)
senkouA = avg(tenkan, kijun)
senkouB = middle(ssb_bars)


ss_high = max(senkouA[ss_offset-1], senkouB[ss_offset-1])
ss_low = min(senkouA[ss_offset-1], senkouB[ss_offset-1])

// Entry/Exit Signals
fast_length = input(title="Fast Length", type=input.integer, defval=17)
slow_length = input(title="Slow Length", type=input.integer, defval=28)
src = input(title="Source", type=input.source, defval=close)
signal_length = input(title="Signal Smoothing", type=input.integer, minval = 1, maxval = 50, defval = 5)
sma_source = input(title="Simple MA(Oscillator)", type=input.bool, defval=true)
sma_signal = input(title="Simple MA(Signal Line)", type=input.bool, defval=true)

// Calculating
fast_ma = sma_source ? sma(src, fast_length) : ema(src, fast_length)
slow_ma = sma_source ? sma(src, slow_length) : ema(src, slow_length)
macd = fast_ma - slow_ma
signal = sma_signal ? sma(macd, signal_length) : ema(macd, signal_length)
hist = macd - signal


tk_cross_bull = tenkan > kijun
tk_cross_bear = tenkan < kijun
cs_cross_bull = mom(close, cs_offset-1) > 0
cs_cross_bear = mom(close, cs_offset-1) < 0
price_above_kumo = close > ss_high
price_below_kumo = close < ss_low


//CMF
lengthA = input(8, minval=1, title="CMF Length")
ad = close==high and close==low or high==low ? 0 : ((2*close-low-high)/(high-low))*volume
mf = sum(ad, lengthA) / sum(volume, lengthA)


//TSI
long = input(title="Long Length", type=input.integer, defval=8)
short = input(title="Short Length", type=input.integer, defval=8)
price = close
double_smooth(src, long, short) =>
	fist_smooth = ema(src, long)
	ema(fist_smooth, short)
pc = change(price)
double_smoothed_pc = double_smooth(pc, long, short)
double_smoothed_abs_pc = double_smooth(abs(pc), long, short)
tsi_value = 100 * (double_smoothed_pc / double_smoothed_abs_pc)


bullish = tk_cross_bull and cs_cross_bull and price_above_kumo and hist > 0 and mf > 0.1 and tsi_value > 0
bearish = tk_cross_bear and cs_cross_bear and price_below_kumo and hist < 0  and mf < -0.1 and tsi_value < 0


strategy.entry("Long", strategy.long, when=bullish and long_entry)
strategy.entry("Short", strategy.short, when=bearish and short_entry)

strategy.close("Long", when=bearish and not short_entry)
strategy.close("Short", when=bullish and not long_entry)