概述
双层RSI交易策略是一种基于相对强弱指数(RSI)的量化交易策略。该策略同时利用快速RSI和慢速RSI作为交易信号,实现双重确认,旨在提高信号质量,过滤假信号。
策略原理
该策略使用两个不同周期的RSI作为主要交易指标。快速RSI周期为5天,用于捕捉短期超买超卖情况;慢速RSI周期为14天,用于判断中长期趋势和关键支撑阻力。
具体交易规则为:
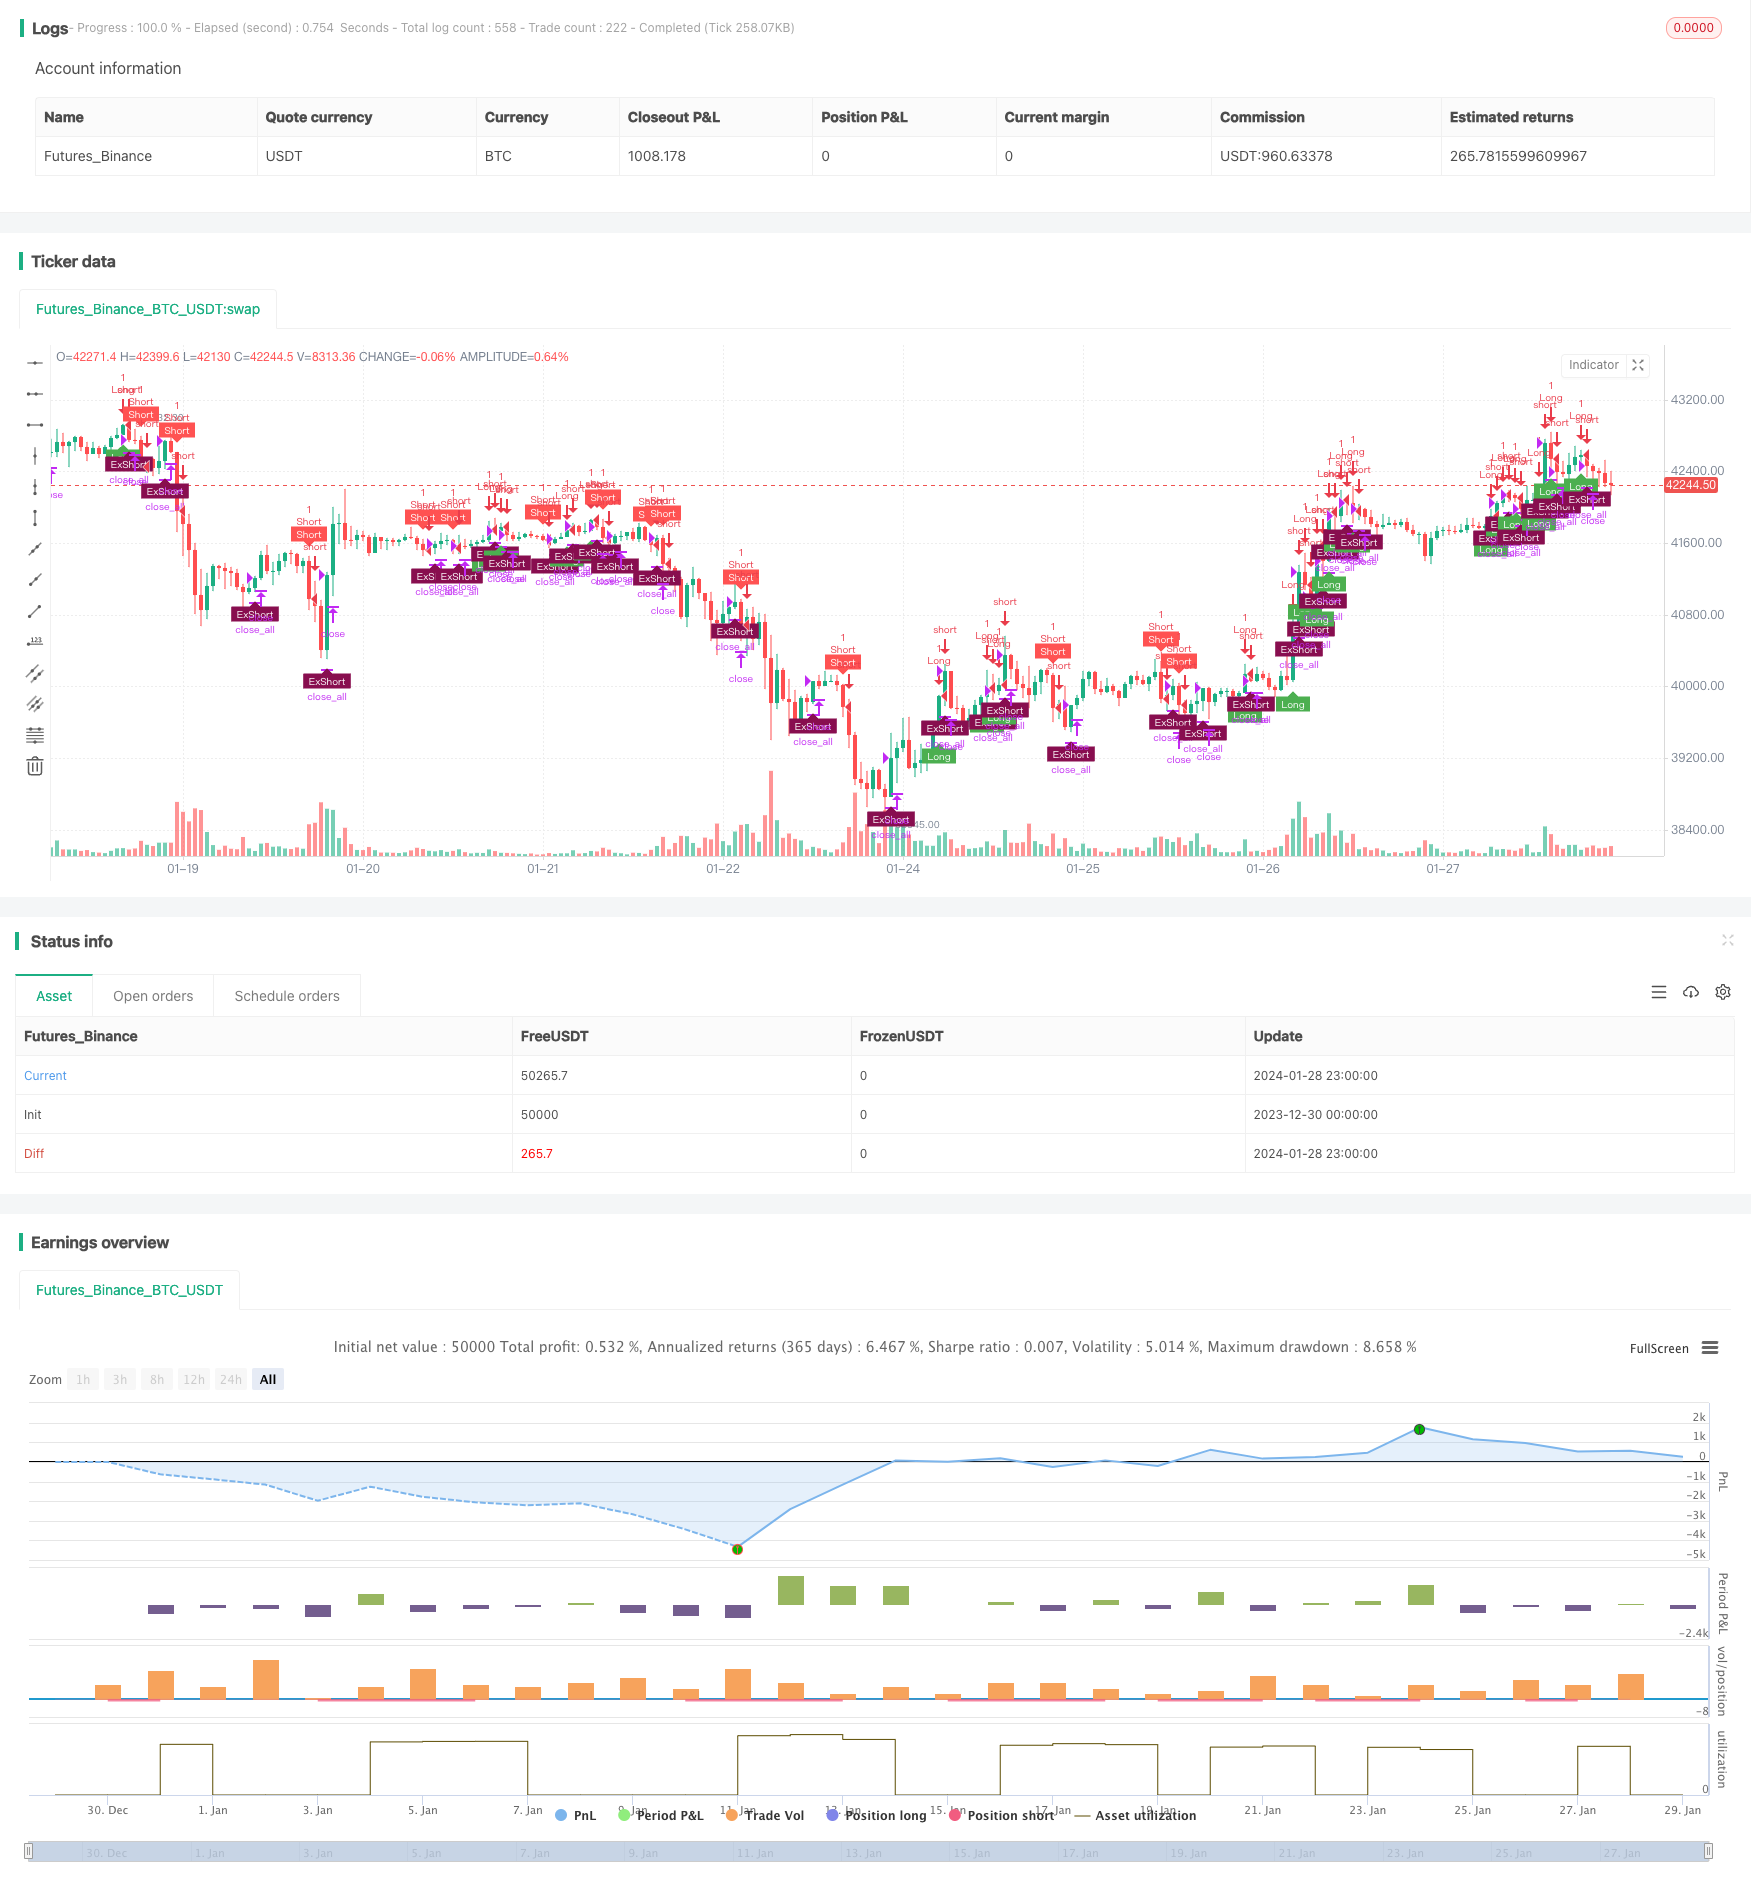
- 当快速RSI上穿70而慢速RSI高于50时,做多;当快速RSI下穿30而慢速RSI低于50时,做空
- 做多止损线为快速RSI下穿55;做空止损线为快速RSI上穿45
该策略通过快慢RSI的组合使用,实现不同周期之间的互补,能够有效识别超买超卖情况的同时确认中长期趋势,从而产生高质量的交易信号。双重RSI过滤机制也能够减少假突破带来的噪音交易。
优势分析
双层RSI策略最大的优势在于能够有效过滤假信号,提高信号质量,从而减少不必要的交易,降低交易频率。具体优势如下:
- 快慢RSI组合使用,识别短中长期超买超卖点,提高信号准确性
- 双重RSI过滤机制,有效减少噪音,避免被套
- 交易频率低,有助于降低交易成本和滑点损失
- 止损机制控制单笔损失和最大回撤
风险分析
双层RSI策略也存在一定的风险,主要来源于以下几个方面:
- RSI本身的滞后性可能带来交易延迟
- 双重过滤机制可能错过部分交易机会
- 不能完全避免极端行情的系统性风险
可以通过以下方法降低上述风险:
- 适当调整快速RSI的参数,增加敏感性
- 优化开仓和止损条件,平衡风险和收益
- 与趋势系统、机器学习等算法组合使用
优化方向
双层RSI策略还有进一步优化的空间,主要方向包括:
- 动态优化RSI参数,根据市场环境自动调整
- 增加基于波动率的风险控制模块
- 结合文本分析、社交数据等替代信号
- 使用机器学习模型辅助过滤信号
通过上述优化,可以进一步提升策略的盈利能力、稳健性与适应性。
总结
双层RSI策略整体而言是一个非常实用的量化交易策略。它融合了趋势跟踪、超买超卖识别与双重过滤等机制,形成了一套相对完整的交易体系。该策略在控制风险、降低交易频率等方面表现突出,适合中长期持有。通过持续优化与迭代,双层RSI策略有望成为新一代量化策略的重要组成部分。
策略源码
/*backtest
start: 2023-12-30 00:00:00
end: 2024-01-29 00:00:00
period: 1h
basePeriod: 15m
exchanges: [{"eid":"Futures_Binance","currency":"BTC_USDT"}]
*/

// This source code is subject to the terms of the Mozilla Public License 2.0 at https://mozilla.org/MPL/2.0/
// © Ankit_Quant
//@version=4

// ********************************************************************************************************
// This was coded live during webinar on Backtesting in Tradingview
// That was held on 16-Jan-21
// Aim of this strategy is to code a Double Decker RSI Strategy - Rules of Strategy are given in Description
// *********************************************************************************************************

// Identifier of strategy or an indicator (study())
strategy(title="Strategy- Double Decker RSI",shorttitle='Strategy - Double Decker RSI',overlay=true)

// ********************
// INPUTS
// ********************
// RSI Lookback Periods
slowRSI=input(defval=14,title='Slow RSI Period',type=input.integer)
fastRSI=input(defval=5,title='Fast RSI Period',type=input.integer)

// Time Period Backtesting Input
start_year=input(defval=2000,title='Backtest Start Year',type=input.integer)
end_year=input(defval=2021,title='Backtest End Year',type=input.integer)

//Specific Years to Test Starategy
timeFilter=true


// Trade Conditions and signals
long = rsi(close,fastRSI)>70 and rsi(close,slowRSI)>50
short = rsi(close,fastRSI)<40 and rsi(close,slowRSI)<50
long_exit=rsi(close,fastRSI)<55
short_exit=rsi(close,fastRSI)>45

//positionSize - 1 Unit (also default setting)
positionSize=1

// Trade Firing - Entries and Exits
if(timeFilter)
    if(long and strategy.position_size<=0)
        strategy.entry(id='Long',long=strategy.long,qty=positionSize)
    if(short and strategy.position_size>=0)
        strategy.entry(id="Short",long=strategy.short,qty=positionSize)
    if(long_exit and strategy.position_size>0)
        strategy.close_all(comment='Ex')
    if(short_exit and strategy.position_size<0)
        strategy.close_all(comment='Ex')


// Plot on Charts the Buy Sell Labels
plotshape(strategy.position_size<1 and long,style=shape.labelup,location=location.belowbar,color=color.green,size=size.tiny,text='Long',textcolor=color.white)
plotshape(strategy.position_size>-1 and short,style=shape.labeldown,location=location.abovebar,color=color.red,size=size.tiny,text='Short',textcolor=color.white)
plotshape(strategy.position_size<0 and short_exit?1:0,style=shape.labelup,location=location.belowbar,color=color.maroon,size=size.tiny,text='ExShort',textcolor=color.white)
plotshape(strategy.position_size>0 and long_exit?1:0,style=shape.labeldown,location=location.abovebar,color=color.olive,size=size.tiny,text='ExLong',textcolor=color.white)