资源加载中... loading...

Momentum Breakout Trading Strategy

Author: ChaoZhang, Date: 2024-01-31 14:14:56
Tags:

img

Overview

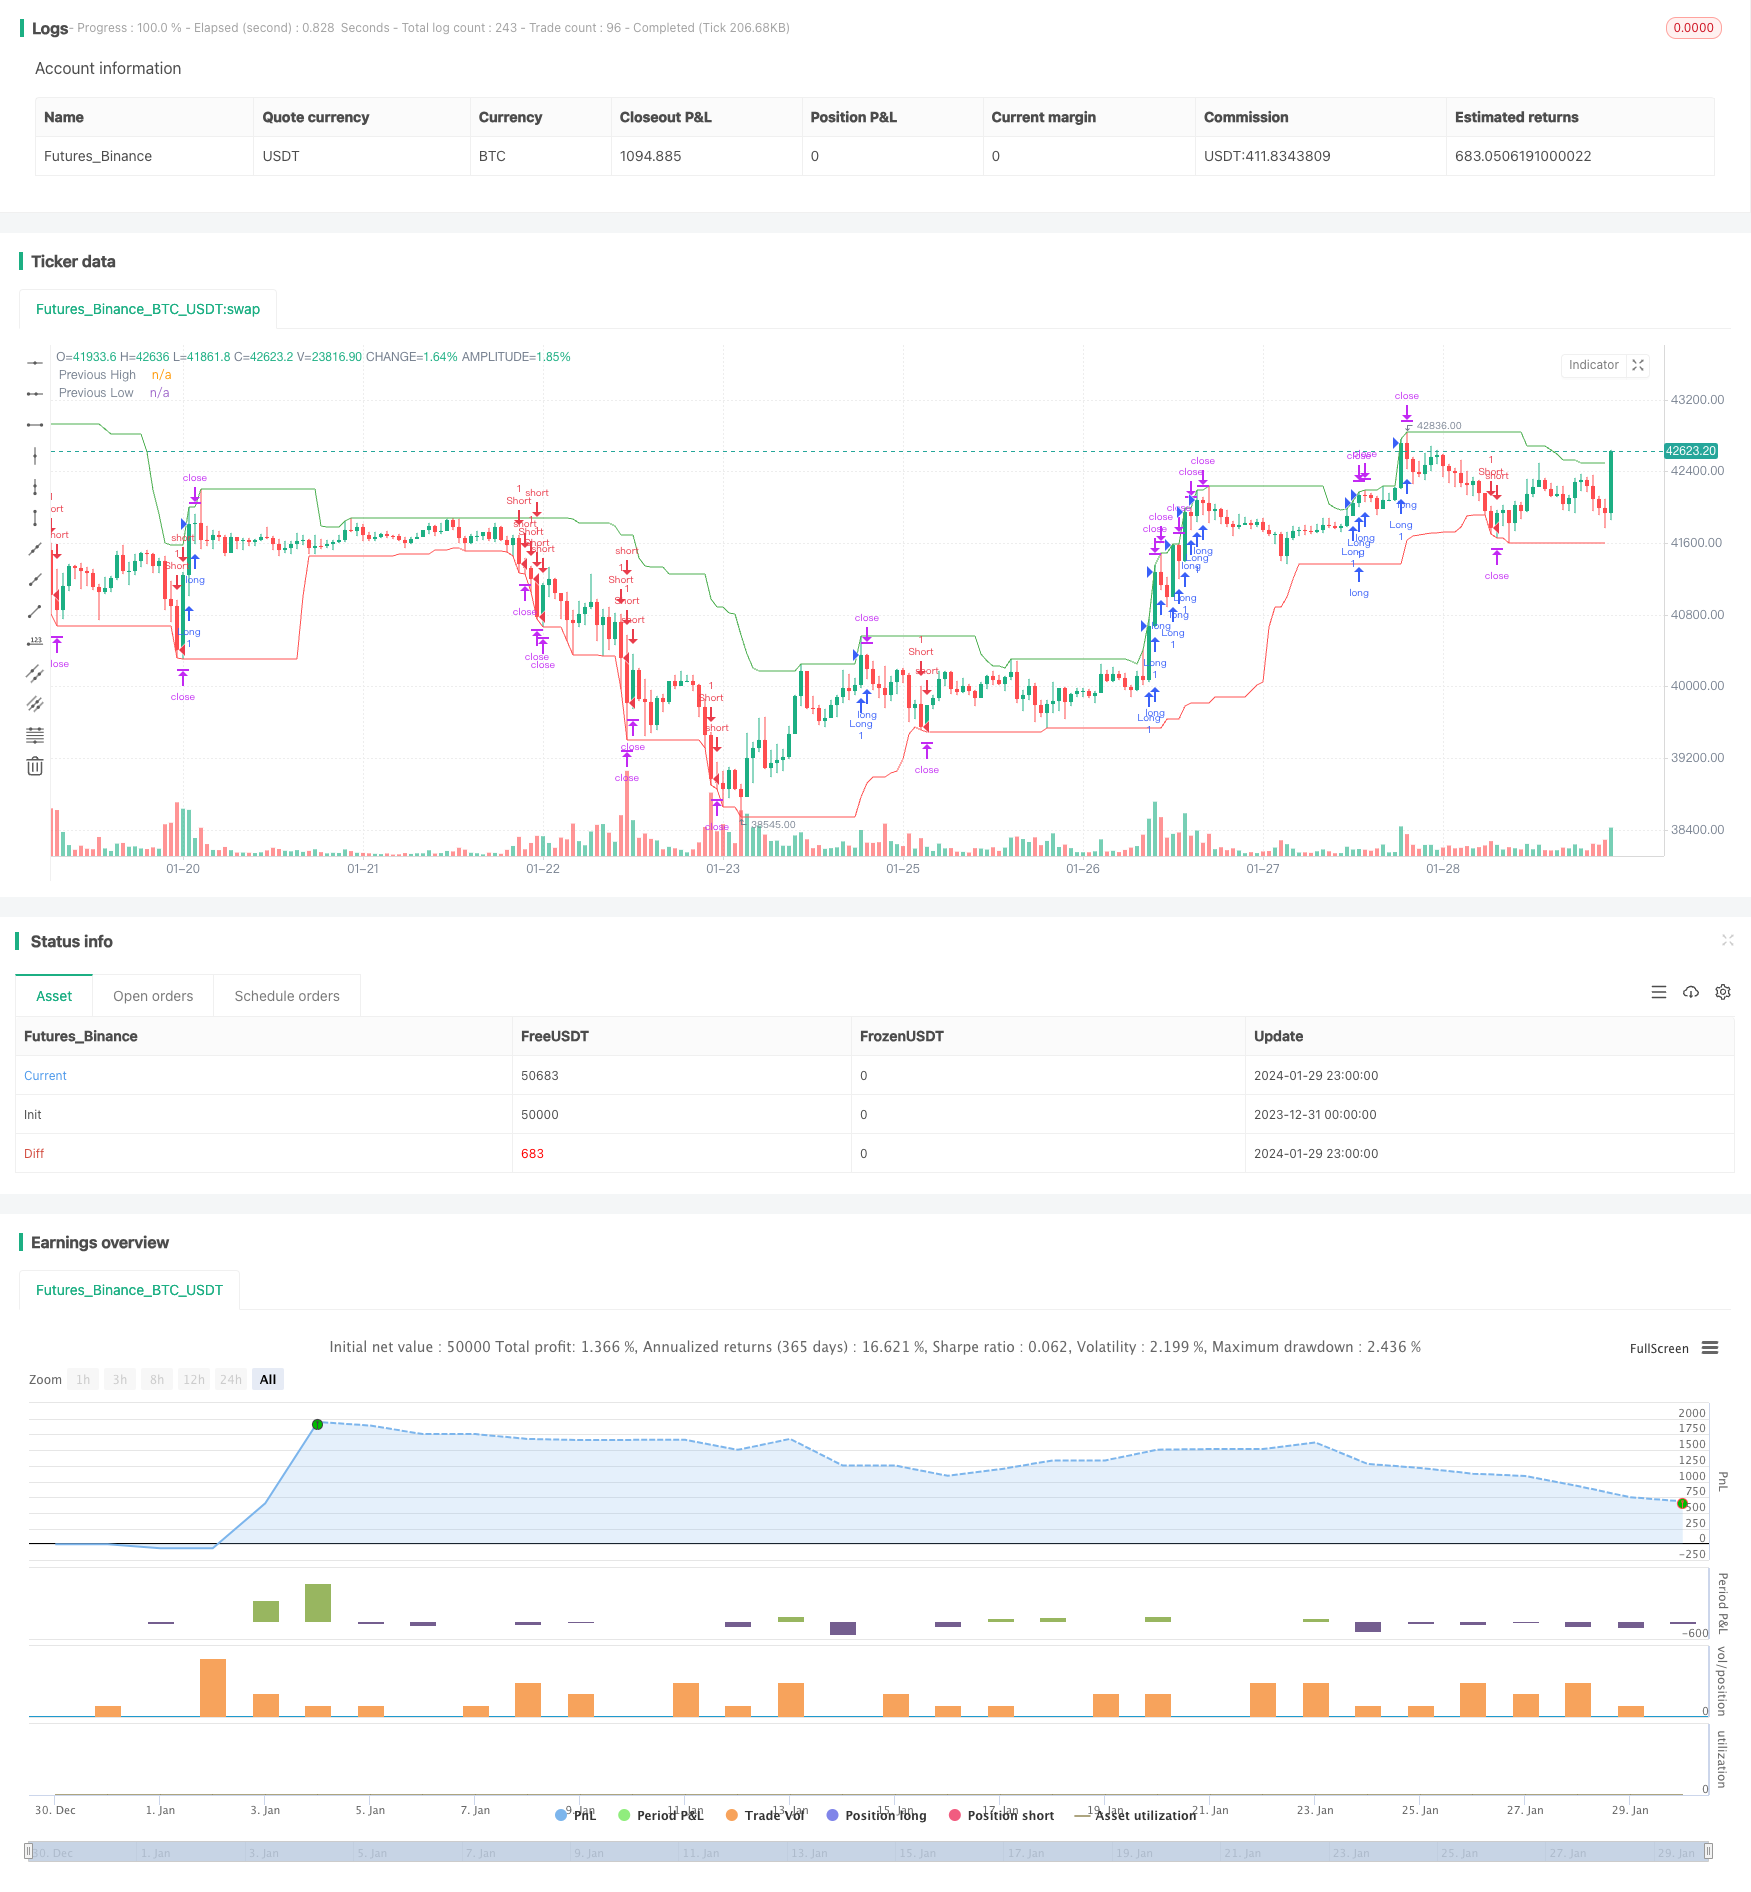
This is a momentum-based trend following breakout trading strategy. It calculates the highest and lowest prices over a certain period to determine the trend direction, and enters long or short trades when prices break key levels.

Strategy Logic

The core logic of this strategy is:

  1. Use the highest() and lowest() functions to calculate the highest and lowest prices of the recent 20 candlesticks, as momentum indicators to judge the trend.

  2. When the latest close price breaks above the highest price of the previous period, go long. This is an upward breakout signal.

  3. When the latest close price breaks below the lowest price of the previous period, go short. This is a downward breakout signal.

  4. To control risks, set a 1% stop loss distance and 2% take profit distance, giving a risk-reward ratio of 2:1.

  5. Plot the highest and lowest prices within the 20 candlesticks to visually determine the trend direction and breakout levels.

The above is the core trading logic of this strategy. It uses momentum indicators to judge the trend, and trades breakouts of key levels, making it a trend following breakout strategy.

Advantages

The advantages of this strategy include:

  1. Catching the direction and strength of trends with high precision. Calculating highest and lowest prices helps filter out false signals from range-bound markets.

  2. Simple and clear logic. Just long above previous highest, and short below previous lowest. Easy to understand and implement.

  3. Controllable risks. The max loss is 1% and max profit is 2% with stop loss and take profit set, giving a reasonable risk-reward ratio.

  4. Easy to optimize. The calculation period can be adjusted for better entry timing. Stop loss and take profit levels can also be tuned for more profits or lower risks.

Risks

There are also some risks:

  1. Stop loss being hit is still possible with fast, huge price swings.

  2. Missing reversal signals if the calculation period is too long. Trend judgment then lags behind.

  3. Improper parameter settings may lead to unprofitability. The calculation period and stop loss/take profit levels need careful testing and optimization.

Optimization

This strategy can be improved in aspects like:

  1. Adding filters to ensure sufficient trend strength before entering trades. Trend metrics can be used.

  2. Adjusting the period parameter to balance timeliness and stability of trend judgment. Too short leads to false signals, too long leads to lag.

  3. Incorporating trailing stop loss to lock in profits and avoid stop loss being hit.

  4. Parameter optimization through historical backtesting to find the optimal combinations of settings.

Conclusion

This is a typical trend following breakout trading strategy. It uses momentum indicators to determine the trend, and trades breakouts of key levels. The pros are simplicity, controllable risks, and ease of understanding/optimization. But it may underperform in certain market environments. Further optimizations can improve its robustness and efficiency.


/*backtest
start: 2023-12-31 00:00:00
end: 2024-01-30 00:00:00
period: 1h
basePeriod: 15m
exchanges: [{"eid":"Futures_Binance","currency":"BTC_USDT"}]
*/

//@version=4
strategy("Trend Following Breakout Strategy with 2:1 RRR", overlay=true)

// 定义前高和前低的计算
length = input(20, minval=1, title="Length")
highestHigh = highest(high, length)
lowestLow = lowest(low, length)

// 定义买入和卖出的条件
longCondition = close > highestHigh[1] // 当前收盘价高于前一期的最高价
shortCondition = close < lowestLow[1] // 当前收盘价低于前一期的最低价

// 为了确保盈亏比为2:1,我们需要定义止损和目标价
stopLoss = input(1, title="Stop Loss %") / 100
takeProfit = stopLoss * 2

// 如果满足买入条件,进入多头
if (longCondition)
    strategy.entry("Long", strategy.long)
    strategy.exit("Long TP", "Long", profit=takeProfit * close, loss=stopLoss * close)

// 如果满足卖出条件,进入空头
if (shortCondition)
    strategy.entry("Short", strategy.short)
    strategy.exit("Short TP", "Short", profit=takeProfit * close, loss=stopLoss * close)

// 绘图显示前高和前低
plot(highestHigh, color=color.green, title="Previous High")
plot(lowestLow, color=color.red, title="Previous Low")


More