概述
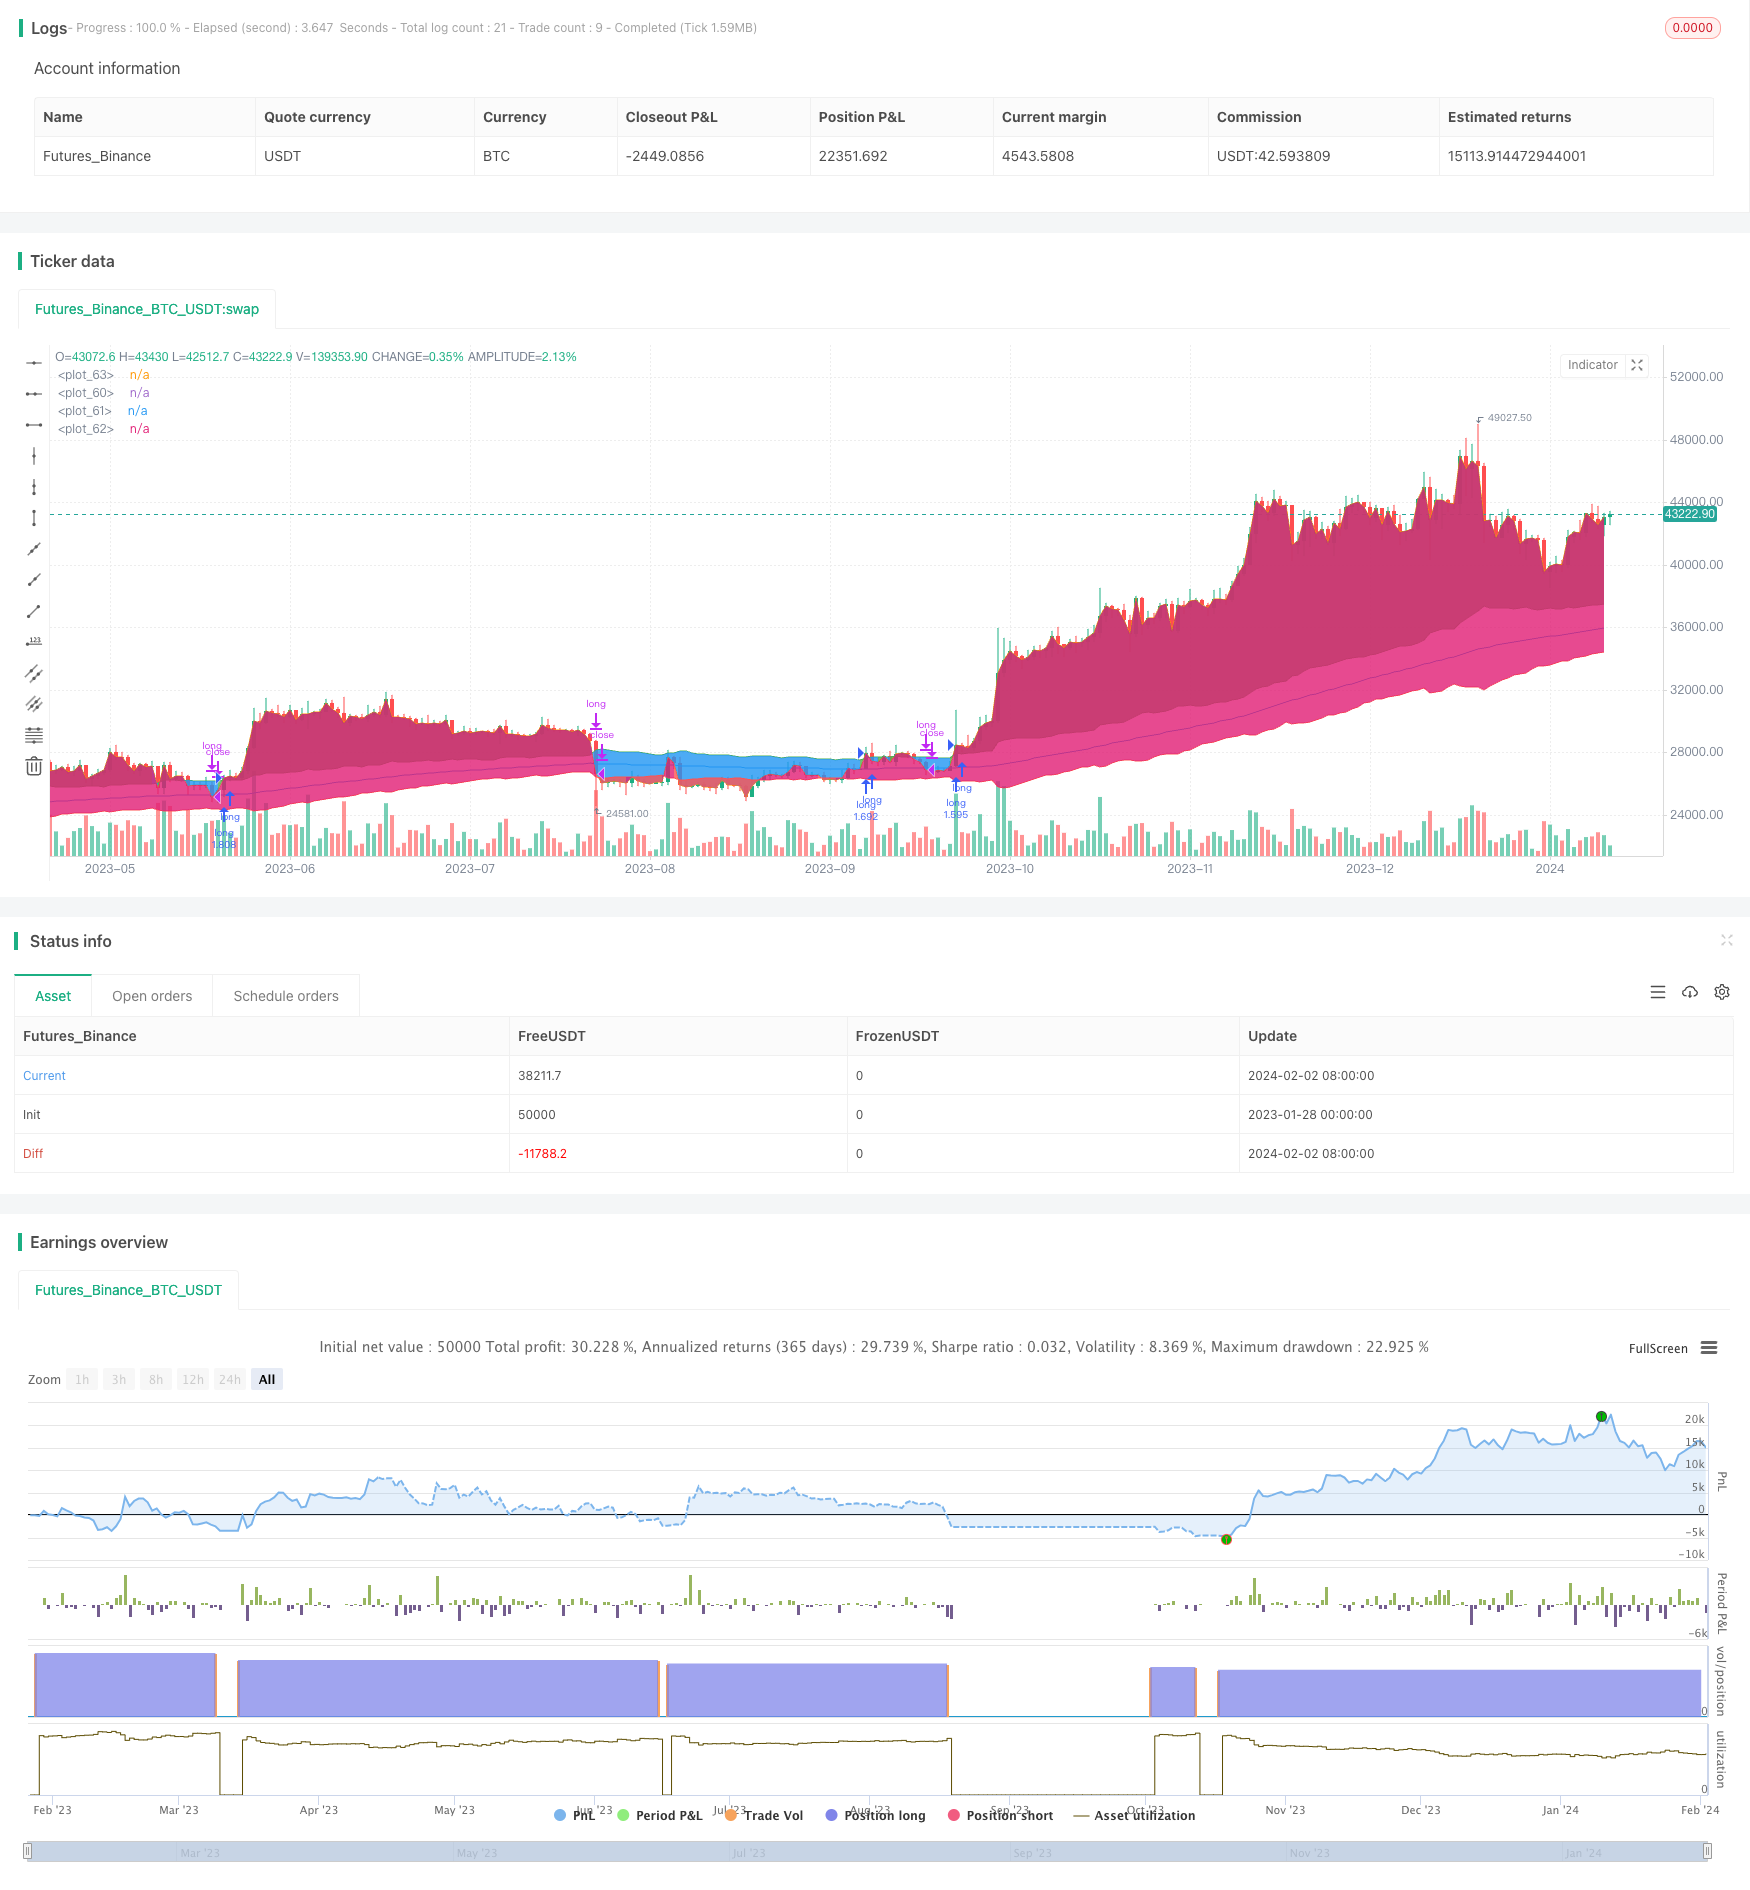
趋势追踪移动平均策略是一个基于长期移动平均线识别趋势方向,并结合平均真实波动范围过滤错乱行情的趋势跟随策略。该策略采用指数移动平均线来判断趋势方向,再利用平均真实波动范围识别是否为假突破。这可以有效过滤震荡行情,降低策略的整体回撤。
策略原理
该策略基于以下原理设计:
- 使用指数移动平均线判断整体趋势方向。周期长度默认为200根K线。
- 计算最近10根K线的平均真实波动范围。
- 当收盘价高于“移动平均线 + 平均真实波动范围”时,判断为上涨趋势。
- 当收盘价低于“移动平均线 - 平均真实波动范围”时,判断为下跌趋势。
- 在上涨趋势中,做多;在下跌趋势中,做空。
- 默认策略以移动平均线为止损线。也可选择以“移动平均线反向±平均真实波动范围”为止损线。
优势分析
该策略具有以下优势:
- 使用移动平均线判断大趋势,可以有效过滤短期市场噪音。
- 增加平均真实波动范围作为过滤条件,可避免在震荡行情中产生交易信号,从而减少不必要的损失。
- 止损线接近移动平均线或者其反向范围,可以快速止损,降低最大回撤。
- 简单的参数设定,容易理解和调优。
风险分析
该策略也存在一些潜在风险:
- 在均线系统中,当趋势反转时往往会产生一定程度上的回撤。
- 移动平均线和平均真实波动范围的参数设置会对策略表现产生很大影响。如果不当设定参数,会错过交易机会或者增加不必要的损失。
- 策略本身并没有考虑股价和交易量之间的关系。可能会产生一些假信号。
优化方向
该策略可从以下几个方面进行优化:
- 测试不同类型的移动平均线,寻找对特定股票或者品种最适合的移动平均线参数。
- 优化移动平均线周期参数,使其更加符合被交易股票或者品种的特点。
- 优化平均真实波动范围的参数,寻找最佳的参数组合以过滤震荡而不漏失趋势。
- 增加成交量的判断规则,避免出现无效突破。
- 测试并比较不同的止损方式,确定最优方案。
总结
趋势追踪移动平均策略整体而言是一个非常简单实用的趋势策略。它同时具有较好的风险控制效果。虽然该策略没有考虑太多因素,仍需对参数和止损方式进行细致测试和优化,但总的来说是一种易于掌握和调整的有效策略。其简单的交易逻辑和参数设置使其可广泛应用于不同品种,尤其适合比特币等数字货币交易。
策略源码
/*backtest
start: 2023-01-28 00:00:00
end: 2024-02-03 00:00:00
period: 1d
basePeriod: 1h
exchanges: [{"eid":"Futures_Binance","currency":"BTC_USDT"}]
*/

// This source code is subject to the terms of the Mozilla Public License 2.0 at https://mozilla.org/MPL/2.0/
// © Inkedlau

//@version=5
strategy('Swing Trend Strategy', overlay=true, pyramiding=1, default_qty_type=strategy.percent_of_equity, default_qty_value=100, initial_capital=1000, commission_value=0.1)

use_short = input.bool(false, 'Open Short Positions?')
exit_type = input.bool(true, 'Exit trade on Moving Average Cross?')
src = input.source(close, 'Source')
len = input.int(200, 'Trend Length')
ma_type = input.string('ema', 'Moving Average Type', options=['sma', 'ema', 'rma', 'wma', 'vwma'], tooltip='Select the type of Moving Average to use to calculate the Trend')
atr_multiplier = input.float(1., 'ATR Threshold', step=0.5, tooltip='Filter the ranging market using the Average True Range')

// ----------------------- DESCRIPTION -----------------------
// THIS SCRIPT IS A TREND FOLLOWING SYSTEM THAT USES A COMBINATION OF MOVING AVERAGE AND AVERAGE TRUE RANGE
// TO SPOT THE TRENDS AND ENTER THE MARKET ACCODINGLY.
// THE MARKET IS CONSIDERED IN AN UPTREND WHEN THE PRICE CLOSES ABOVE THE MOVING AVERAGE + THE AVERAGE TRUE RANGE OF THE LAST 10 PERIODS
// THE MARKET IS CONSIDERED IN AN DOWNTREND WHEN THE PRICE CLOSES BLOW THE MOVING AVERAGE - THE AVERAGE TRUE RANGE OF THE LAST 10 PERIODS
// BY DEFAULT, THE STRATEGY WILL ENTER LONG WHEN AN UPTREND IS SPOTTED, THEN CLOSES WHEN THE PRICE CLOSES BELOW THE MOVING AVERAGE
// THE STRATEGY WILL ENTER SHORT WHEN A DOWNTREND IS SPOTTED, THEN CLOSES WHEN THE PRICE CLOSES ABOVE THE MOVING AVERAGE

// ------------------ INDICATORS CALCULATION------------------
my_ma()=>
    ma = close
    if ma_type == 'sma'
        ma := ta.sma(src, len)
    if ma_type == 'ema'
        ma := ta.ema(src, len)
    if ma_type == 'rma'
        ma := ta.rma(src, len)
    if ma_type == 'wma'
        ma := ta.wma(src, len)
    if ma_type == 'vwma'
        ma := ta.vwma(src, len)
    ma

trend = my_ma()
atr = ta.atr(10)
uptrend = trend + atr * atr_multiplier
downtrend = trend - atr * atr_multiplier

// ---------------- ENTRY AND EXIT CONDITIONS ----------------

open_long = strategy.position_size == 0 and src > uptrend
close_long = exit_type ? strategy.position_size > 0 and src < trend : strategy.position_size > 0 and src < downtrend

open_short = use_short and strategy.position_size == 0 and src < downtrend
close_short = exit_type ? strategy.position_size < 0 and src > trend : strategy.position_size < 0 and src > uptrend

strategy.entry('long', strategy.long, when=open_long)
strategy.close('long', when=close_long)

strategy.entry('short', strategy.short, when=open_short)
strategy.close('short', when=close_short)


// ------------------ PLOTTING AND COLORING ------------------
tcolor = src > uptrend ? color.green : src < downtrend ? color.red : na

ptrend = plot(trend, color=color.blue, linewidth=1)
puptrend = plot(uptrend, color=color.green, linewidth=1)
pdowntrend = plot(downtrend, color=color.red, linewidth=1)
pclose = plot(close, color=na)

fill(puptrend, pclose, color=close > uptrend ? color.green : na, transp = 90)
fill(pdowntrend, pclose, color=close < downtrend ? color.red : na, transp = 90)