概述
本策略是一个基于动量技术的日间隔震荡交易策略,使用ATR止损。该策略由Stably的Kory Hoang制作。
策略利用动量指标识别趋势方向,结合ATR指标设置止损线,实现低买高卖的震荡交易策略。
策略原理
代码中首先设置了回测的时间范围。
然后是指标部分,计算了以下几个指标:
- atr(): 计算ATR指标,用于设置止损;
- max_/min_: 记录上一根K线的最高价/最低价;
- is_uptrend: 判断是否处于上升趋势;
- vstop: 止损线;
判断趋势的主要逻辑是:
如果close高于之前下跌的止损线vstop,则判断为上升趋势;如果close低于之前上涨的止损线vstop,则判断为下降趋势。
在趋势发生转变时,调整止损线的位置。
具体来说,在上升趋势时,止损线定为之前K线最高价减去ATR的数值;在下降趋势时,止损线定为之前K线最低价加上ATR的数值。
这样可以实现趋势跟踪止损。
交易规则部分,在突破止损线时开仓做多做空。
优势分析
该策略具有以下优势:
- 使用动量技术判断趋势方向,及时捕捉转折点,避免假突破。
- ATR止损跟踪最高价/最低价,可以很好控制风险。
- 策略逻辑简单清晰,容易理解实现。
- 可在趋势间实现低买高卖的震荡交易。
风险分析
该策略也存在一些风险:
- ATR数值选择不当可能导致止损过于宽松或过于紧凑。
- 震荡趋势中可能出现剧烈波动,连续止损。
- 交易次数可能较多,手续费成本较高。
可以从以下几个方面进行优化:
- 测试不同的ATR参数,找到最优参数组合。
- 在ATR基础上结合波动率指标优化止损线。
- 结合趋势过滤,避免震荡市无谓开仓。
优化方向
该策略可以从以下几个方向进行优化:
测试不同的ATR参数,找到最优参数组合。可以回测多组参数,评估收益风险比。
在ATR基础上结合波动率指标优化止损线。可以引入波动率指标,在波动加大时适当放宽止损幅度。
结合趋势过滤,避免震荡市无谓开仓。可以增加趋势判断指标,只在趋势明确时开仓。
增加仓位管理机制。可以根据资金利用率、连续止损次数等调整仓位。
增加夜间隔隙风险控制。可以在收盘前主动止损,避免隔夜价格跳空。
总结
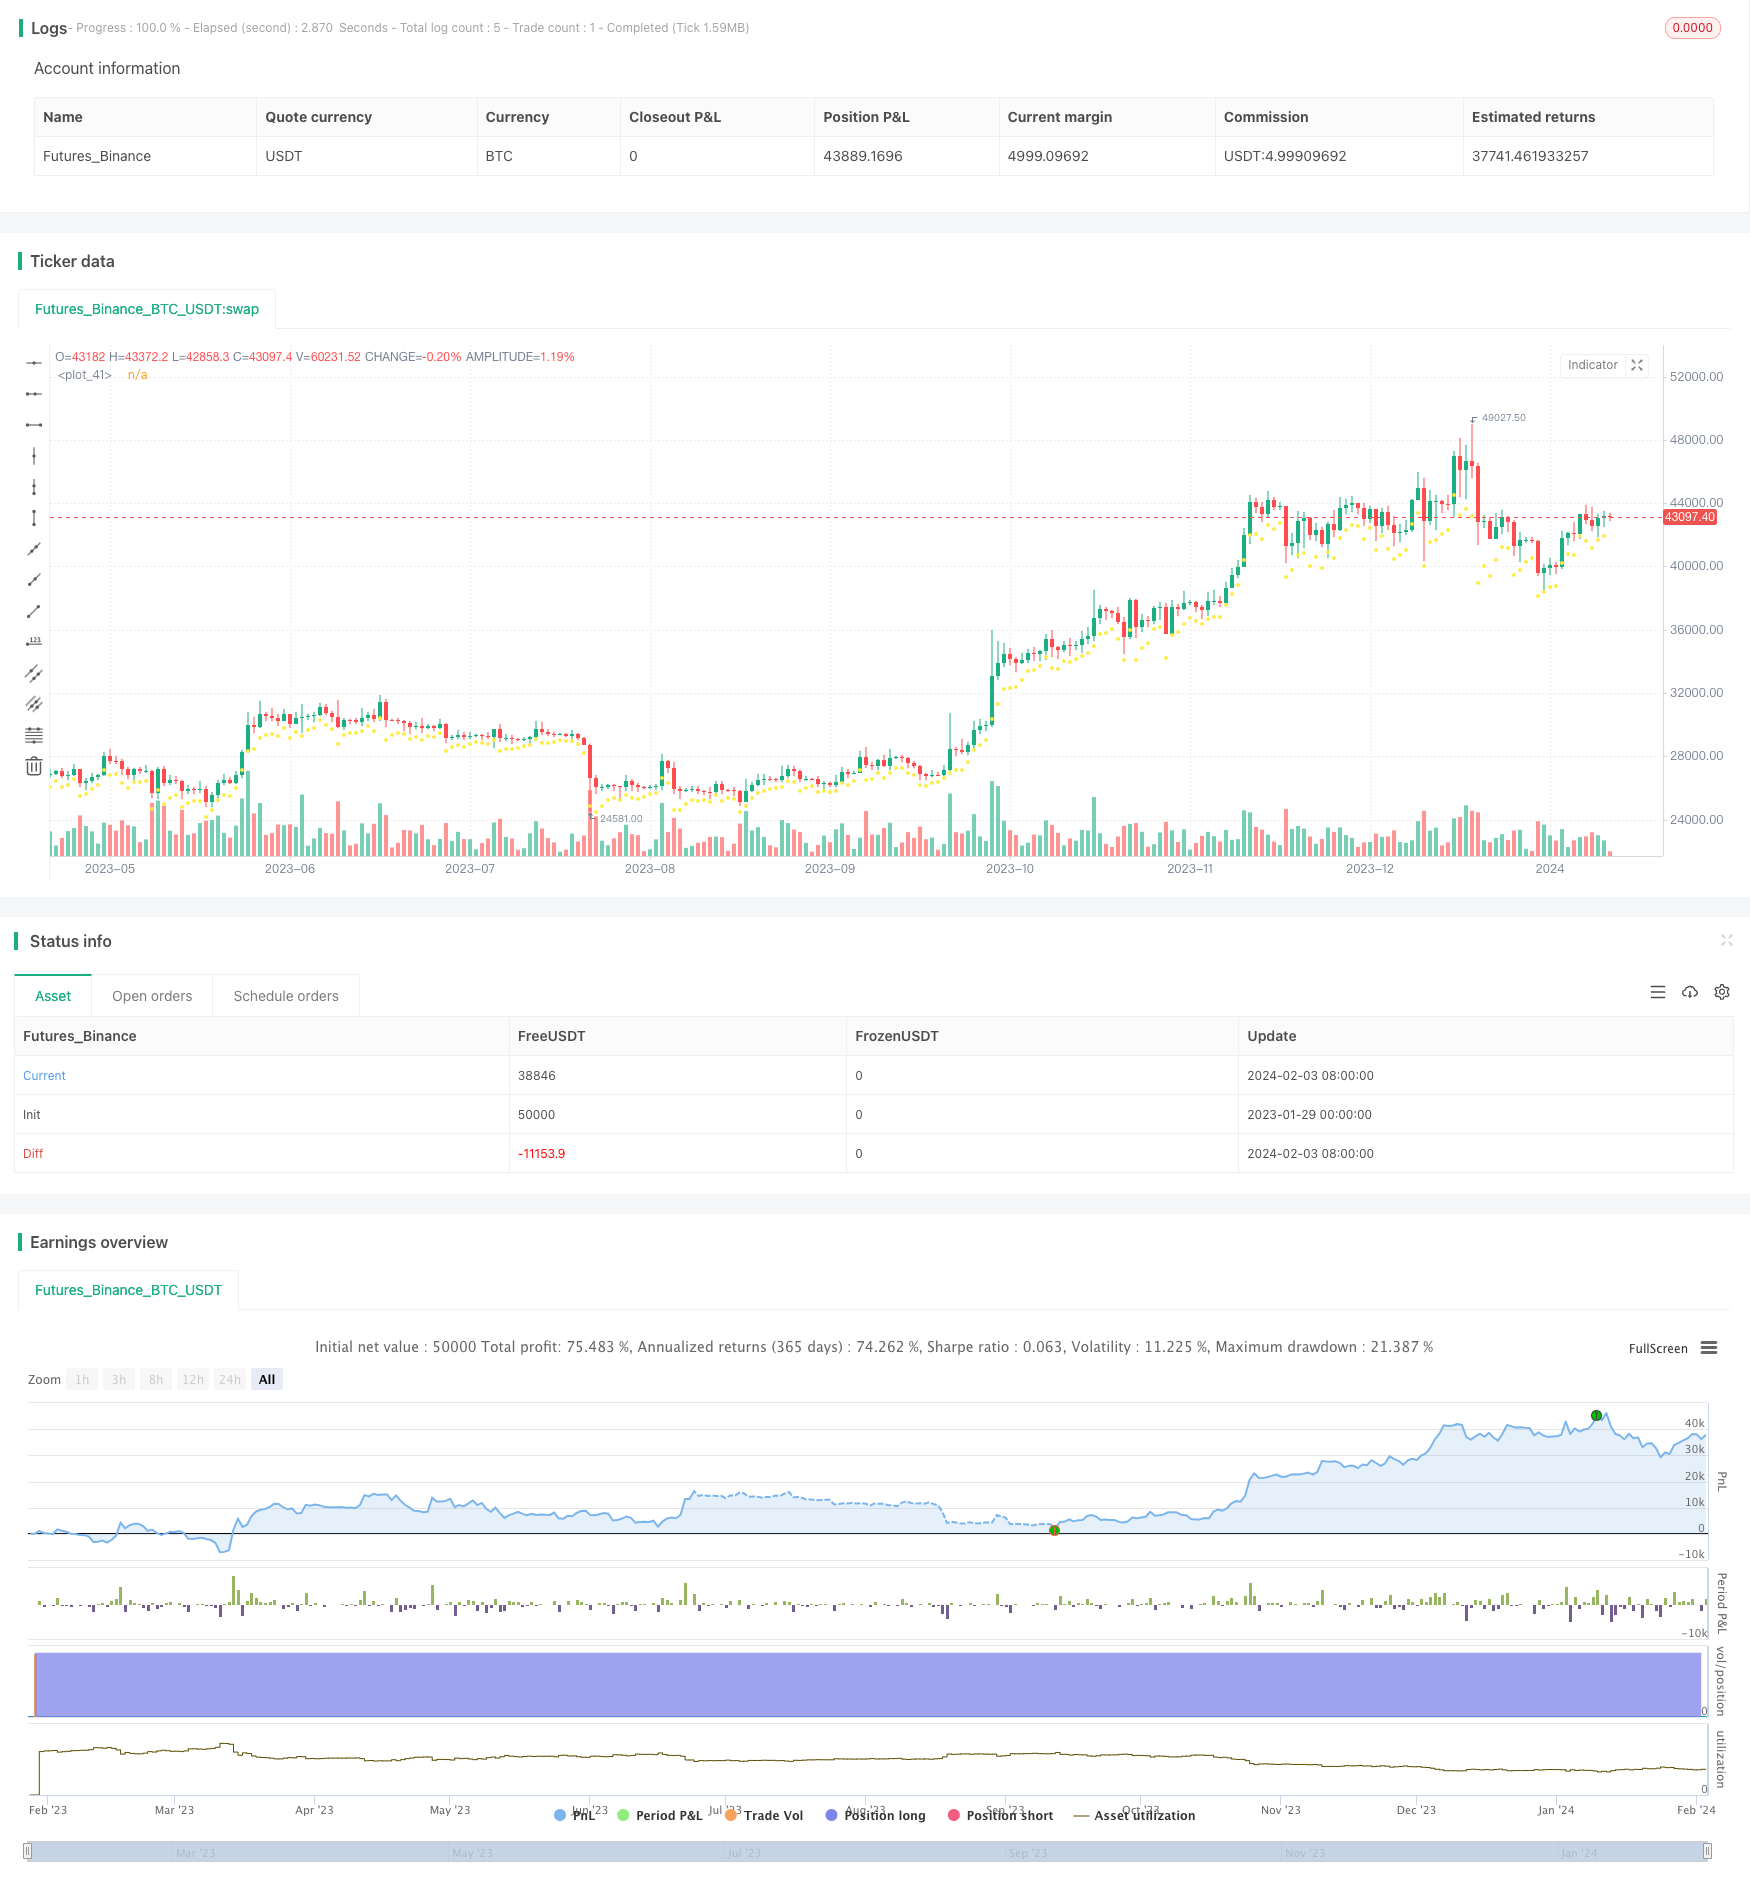
本策略作为一个基础的日内震荡交易策略,总体思路清晰,使用动量技术判断趋势,并利用ATR指标进行滑点跟踪止损,可以有效控制风险。
优化空间还很大,后续可以从趋势判断、止损方式、仓位管理等多个角度进行改进,使策略更适合实盘交易。总体来说,本策略为量化交易提供了一个不错的基础框架。
策略源码
/*backtest
start: 2023-01-29 00:00:00
end: 2024-02-04 00:00:00
period: 1d
basePeriod: 1h
exchanges: [{"eid":"Futures_Binance","currency":"BTC_USDT"}]
*/

//@version=2
strategy("BTC Swinger", overlay=true, commission_value = 0.25, default_qty_type=strategy.percent_of_equity, default_qty_value = 100)

/////////////////////////////////////////////////////////////
//START - SET DATE RANGE

// === BACKTEST RANGE ===
FromMonth = input(defval = 1, title = "From Month", minval = 1)
FromDay   = input(defval = 1, title = "From Day", minval = 1)
FromYear  = input(defval = 2010, title = "From Year")
ToMonth   = input(defval = 12, title = "To Month", minval = 1)
ToDay     = input(defval = 31, title = "To Day", minval = 1)
ToYear    = input(defval = 2020, title = "To Year")

startDate = time > timestamp(FromYear, FromMonth, FromDay, 1, 1)
endDate = time < timestamp(ToYear, ToMonth, ToDay, 23, 59)
withinTimeRange = true

/////////////////////////////////////////////////////////////
//END - SET DATE RANGE


/////////////////////////////////////////////////////////////
//START - INDICATORS

length = input(3)
mult = input(1, minval = 0.01)
atr_ = atr(length)
max1 = max(nz(max_[1]), close)
min1 = min(nz(min_[1]), close)
is_uptrend_prev = nz(is_uptrend[1], true)
stop = is_uptrend_prev ? max1 - mult * atr_ : min1 + mult * atr_
vstop_prev = nz(vstop[1])
vstop1 = is_uptrend_prev ? max(vstop_prev, stop) : min(vstop_prev, stop)
is_uptrend = close - vstop1 >= 0
is_trend_changed = is_uptrend != is_uptrend_prev
max_ = is_trend_changed ? close : max1
min_ = is_trend_changed ? close : min1
vstop = is_trend_changed ? is_uptrend ? max_ - mult * atr_ : min_ + mult * atr_ : vstop1
plot(vstop, color = is_uptrend ? yellow : red, style=circles, linewidth=2)

/////////////////////////////////////////////////////////////
//END - INDICATORS


/////////////////////////////////////////////////////////////
//START - TRADING RULES
direction = input(defval=1, title = "Strategy Direction", minval=-1, maxval=1)
strategy.risk.allow_entry_in(direction == 0 ? strategy.direction.all : (direction < 0 ? strategy.direction.short : strategy.direction.long))

condition1 = close > vstop and withinTimeRange
condition2 = close < vstop and withinTimeRange

strategy.entry("BUY", strategy.long, when = condition1)
strategy.entry("SELL", strategy.short, when = condition2)

/////////////////////////////////////////////////////////////
//END - TRADING RULES