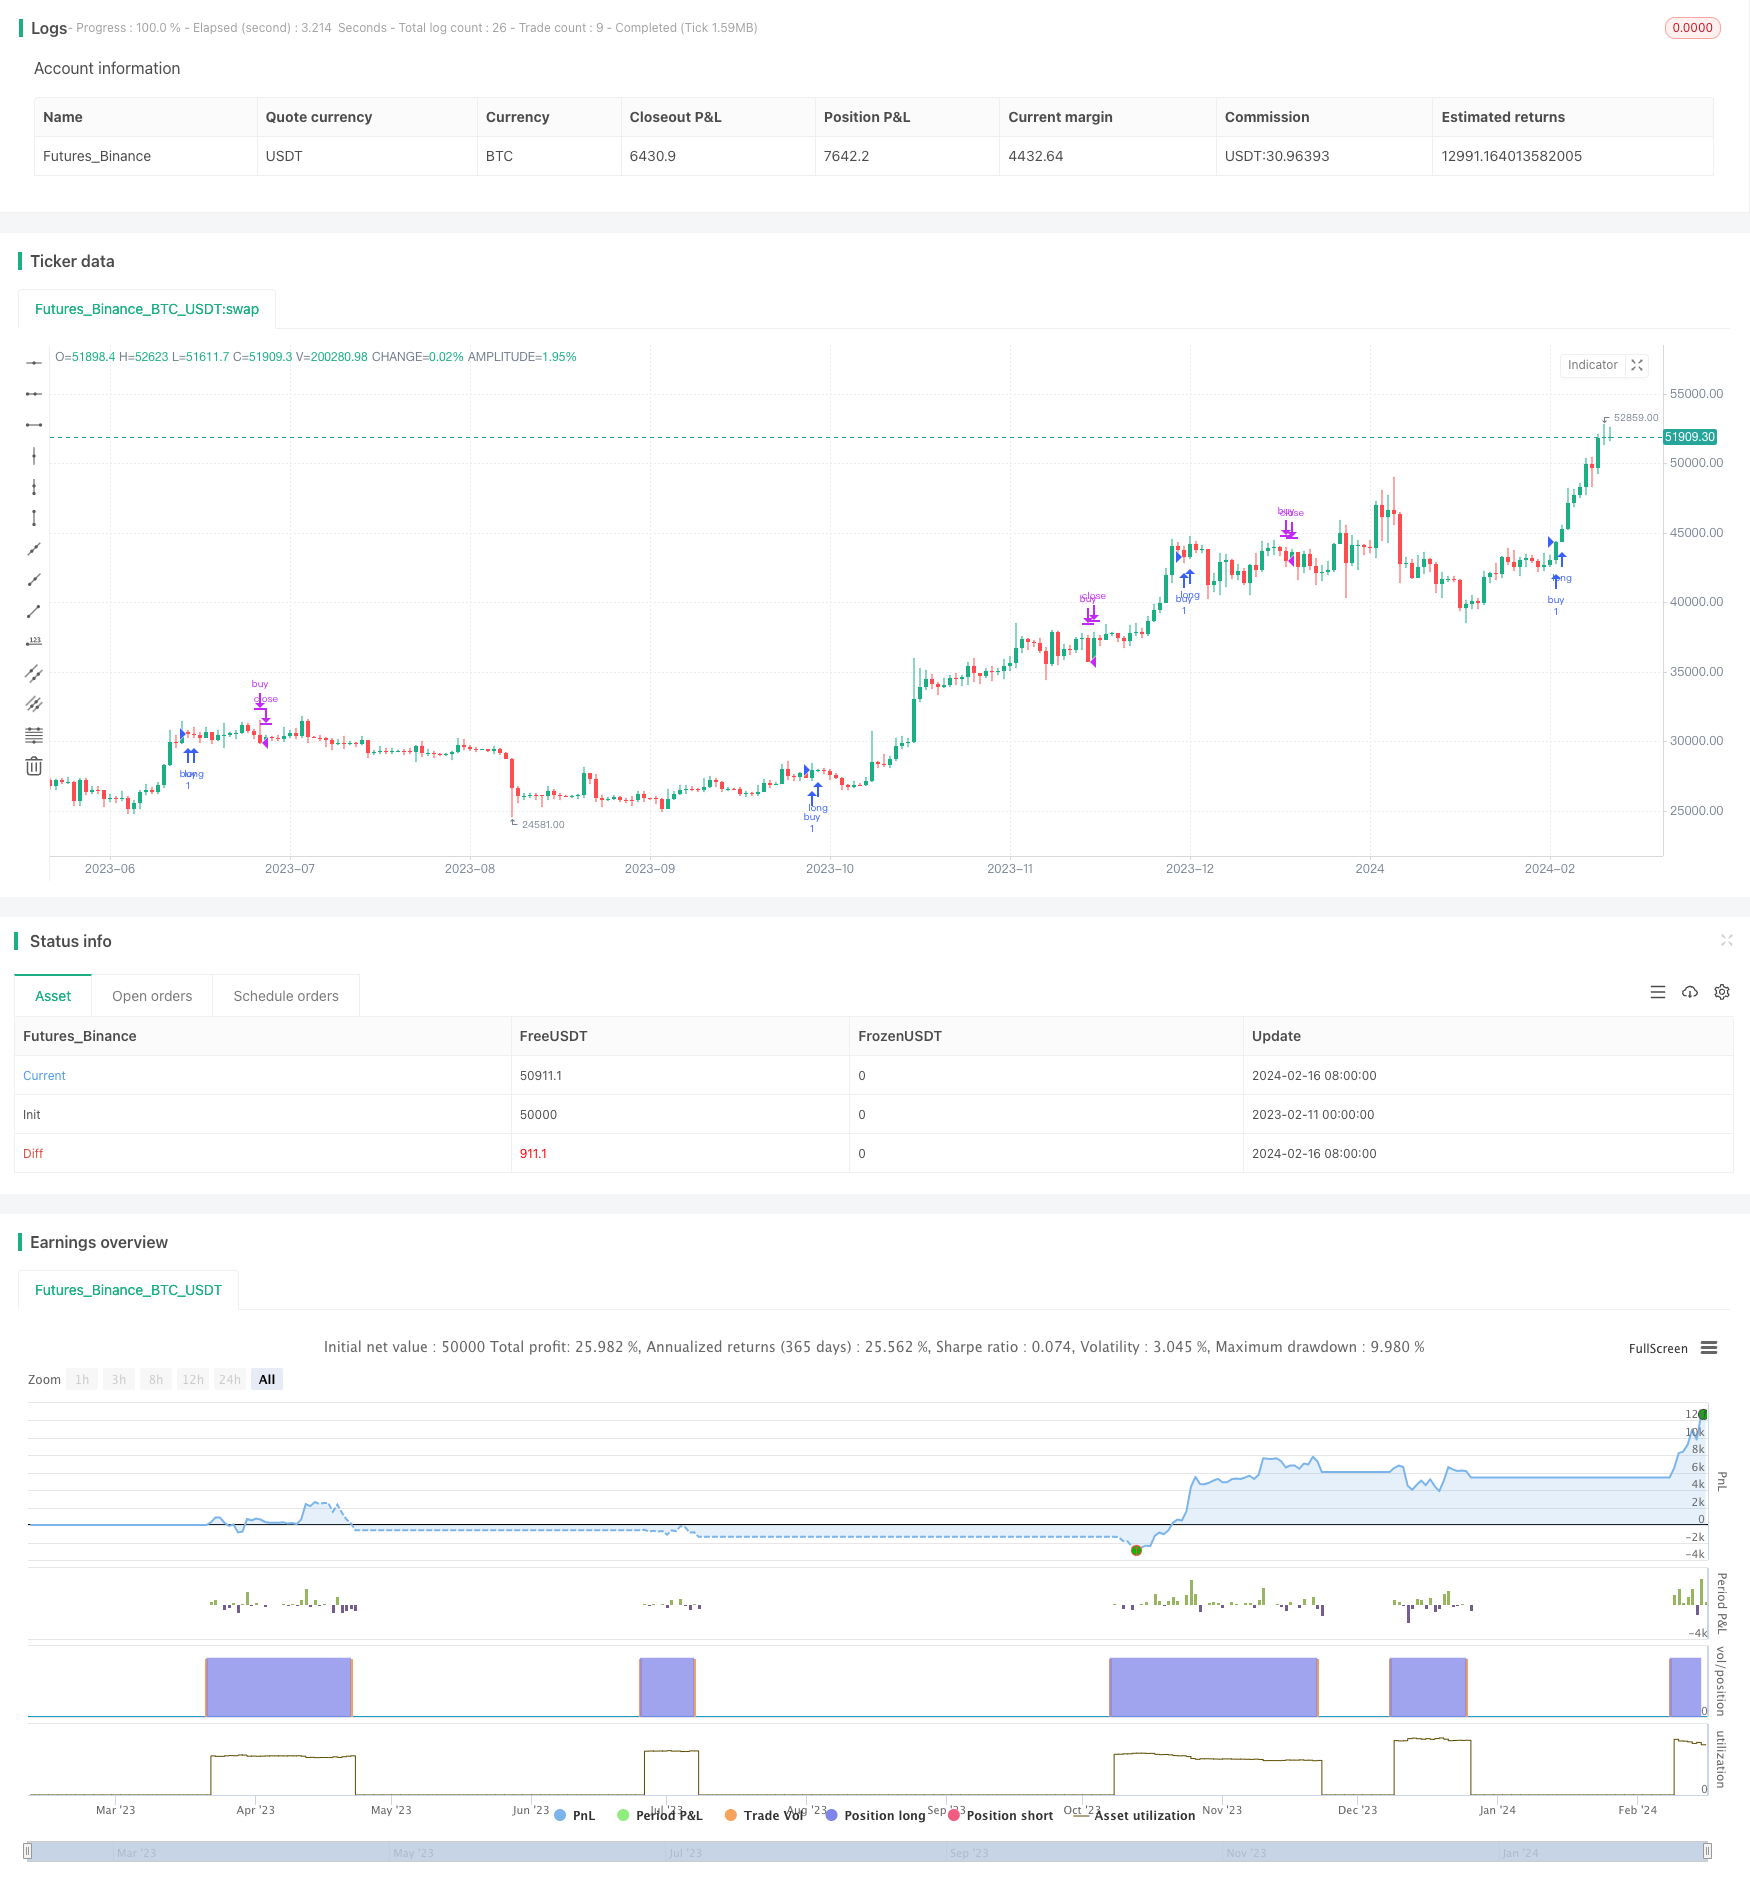
概述
这个交易策略结合使用了相对强弱指标(RSI)和随机相对强弱指标(Stochastic RSI)两个技术指标来产生交易信号。策略额外利用更高时间框架的加密货币价格走势来确认趋势,以提高信号的可靠性。
策略名称
多时间框架RSI-SRSI交易策略(Multi Timeframe RSI-SRSI Trading Strategy)
策略原理
该策略根据RSI指标值高低来判断超买超卖现象。当RSI低于30时为超卖信号,高于70时为超买信号。Stochastic RSI指标则观察RSI指标本身的波动情况。Stochastic RSI低于5为超卖信号,高于50为超买信号。
策略同时结合更高时间框架(例如周线)的加密货币价格走势。只有当更高时间框架的RSI高于阈值时(例如45),才产生买入交易信号。这个设定能过滤掉整体处于下跌趋势时出现的非persistent的超卖信号。
买入和卖出信号在触发后,需要经过一定周期(如8根K线)的确认,避免产生误导性的信号。
策略优势
- 利用RSI指标判断超买超卖的经典技术分析方法
- 结合Stochastic RSI指标识别RSI本身的反转信号
- 应用多时间框架技术过滤误导信号,提升信号质量
策略风险及解决方法
- RSI指标容易产生虚假信号
- 结合其他指标过滤误导信号
- 应用趋势确认技术
- 阈值参数设置不当易产生过多交易信号
- 优化参数组合找到最佳参数
- 买卖信号需要一定确认时间
- 找到平衡确认周期,既过滤误导信号,又不错过机会
策略优化方向
- 测试更多指标的组合,寻找更强信号
- 例如将MACD指标加入策略
- 尝试机器学习方法寻找最优参数
- 使用遗传算法/进化算法自动寻优
- 增加止损策略控制单笔交易风险
- 当价格跌破支持位时止损
总结
该策略主要依靠RSI和Stochastic RSI两个经典交易指标产生交易信号。同时,引入更高时间框架进行趋势确认,能有效过滤误导信号,提高信号质量。通过参数优化,止损策略等手段能进一步增强策略表现。该策略思路简单直接,容易理解实现,是量化交易的一个很好的起点。
策略源码
/*backtest
start: 2023-02-11 00:00:00
end: 2024-02-17 00:00:00
period: 1d
basePeriod: 1h
exchanges: [{"eid":"Futures_Binance","currency":"BTC_USDT"}]
*/

//@version=5
strategy("RSI and Stochatic Strategy", overlay=true, use_bar_magnifier = false)


/////// Inputs ///////////////

// RSI and SRSI
rsiLength = input(14, title="RSI Length")
stochLength = input(14, title="Stochastic Length")
kSmooth = input(3, title="K Smooth")
dSmooth = input(3, title="D Smooth")


//////// thresholds ///////////////
st_low = input(5, title="Low SRSI") // stochastic RSI low -- prepare to sell
st_hi = input(50, title="High SRSI") // stochastic RSI high -- prepare to buy
diff = input(5, title="difference") // minimum change in RSI
// inval_diff = input(12, title="difference") // invalidation difference: change in the oposite direction that invalidates rsi falling/rising
rsi_low = input(30, title="Low RSI") // RSI considered low
rsi_hi = input(60, title="High RSI") // RSI considered high
rsi_ht_hi = input(45, title="High higher time frame RSI") // RSI in higher time frame considered high


/// buy trigger duration
tr_dur = input(8, title="Trigger duration")
low_dur = input(20, title="Monitoring last low")


///////////////// Higher time frame trend ///////////////////
// higher time frame resolution
res2 = input.timeframe("W", title="Higher time-frame")
// Input for the ticker symbol, default is an empty string
// For instance we could monitor BTC higher time frame trend
symbol = input("BTC_USDT:swap", "Input Ticker (leave empty for current)")

// Determine the symbol to use
inputSymbol = symbol == "" ? syminfo.tickerid : symbol
//////////////////////////////////////////////////////////

// Calculate RSI //
rsi = ta.rsi(close, rsiLength)

// Calculate Stochastic RSI //
rsiLowest = ta.lowest(rsi, stochLength)
rsiHighest = ta.highest(rsi, stochLength)
stochRsi = 100 * (rsi - rsiLowest) / (rsiHighest - rsiLowest)

// Apply smoothing
K = ta.sma(stochRsi, kSmooth)
D = ta.sma(K, dSmooth)

// Higher time Frame RSI
cl2 = request.security(inputSymbol, res2, close)
rsi2 = ta.rsi(cl2, 14)

// SRSI BUY/SELL signals
sell_stoch = (ta.lowest(K, tr_dur) < st_low) or (ta.highest(rsi, tr_dur) < rsi_low)
buy_stoch = ((ta.lowest(K, tr_dur) > st_hi) or (ta.lowest(rsi, tr_dur) > rsi_hi)) and (rsi2 > rsi_ht_hi)

 // valitation / invalidation sell signal
ll = ta.barssince(not sell_stoch)+1
sell_validation = (ta.highest(rsi, ll)>rsi[ll]+diff and rsi < rsi[ll]) or (rsi < rsi[ll]-diff)

// valitation / invalidation buy signal
llb = ta.barssince(not buy_stoch)+1
buy_validation = (ta.lowest(rsi, llb)<rsi[llb]-diff and rsi > rsi[llb]) or (rsi > rsi_hi and rsi - rsi[tr_dur] > 0)

sell_signal = sell_stoch and sell_validation
buy_signal = buy_stoch and buy_validation

// Define the start date for the strategy
startYear = input(2019, "Start Year")
startMonth = input(1, "Start Month")
startDay = input(1, "Start Day")

// Convert the start date to Unix time
startTime = timestamp(startYear, startMonth, startDay, 00, 00)

// Define the end date for the strategy
endYear = input(2030, "End Year")
endMonth = input(1, "End Month")
endDay = input(1, "End Day")

// Convert the end date to Unix time
endTime = timestamp(endYear, endMonth, endDay, 00, 00)


if true
    if buy_signal
        strategy.entry("buy", strategy.long, comment = "Buy")
    if sell_signal
        strategy.close("buy", "Sell")