概述
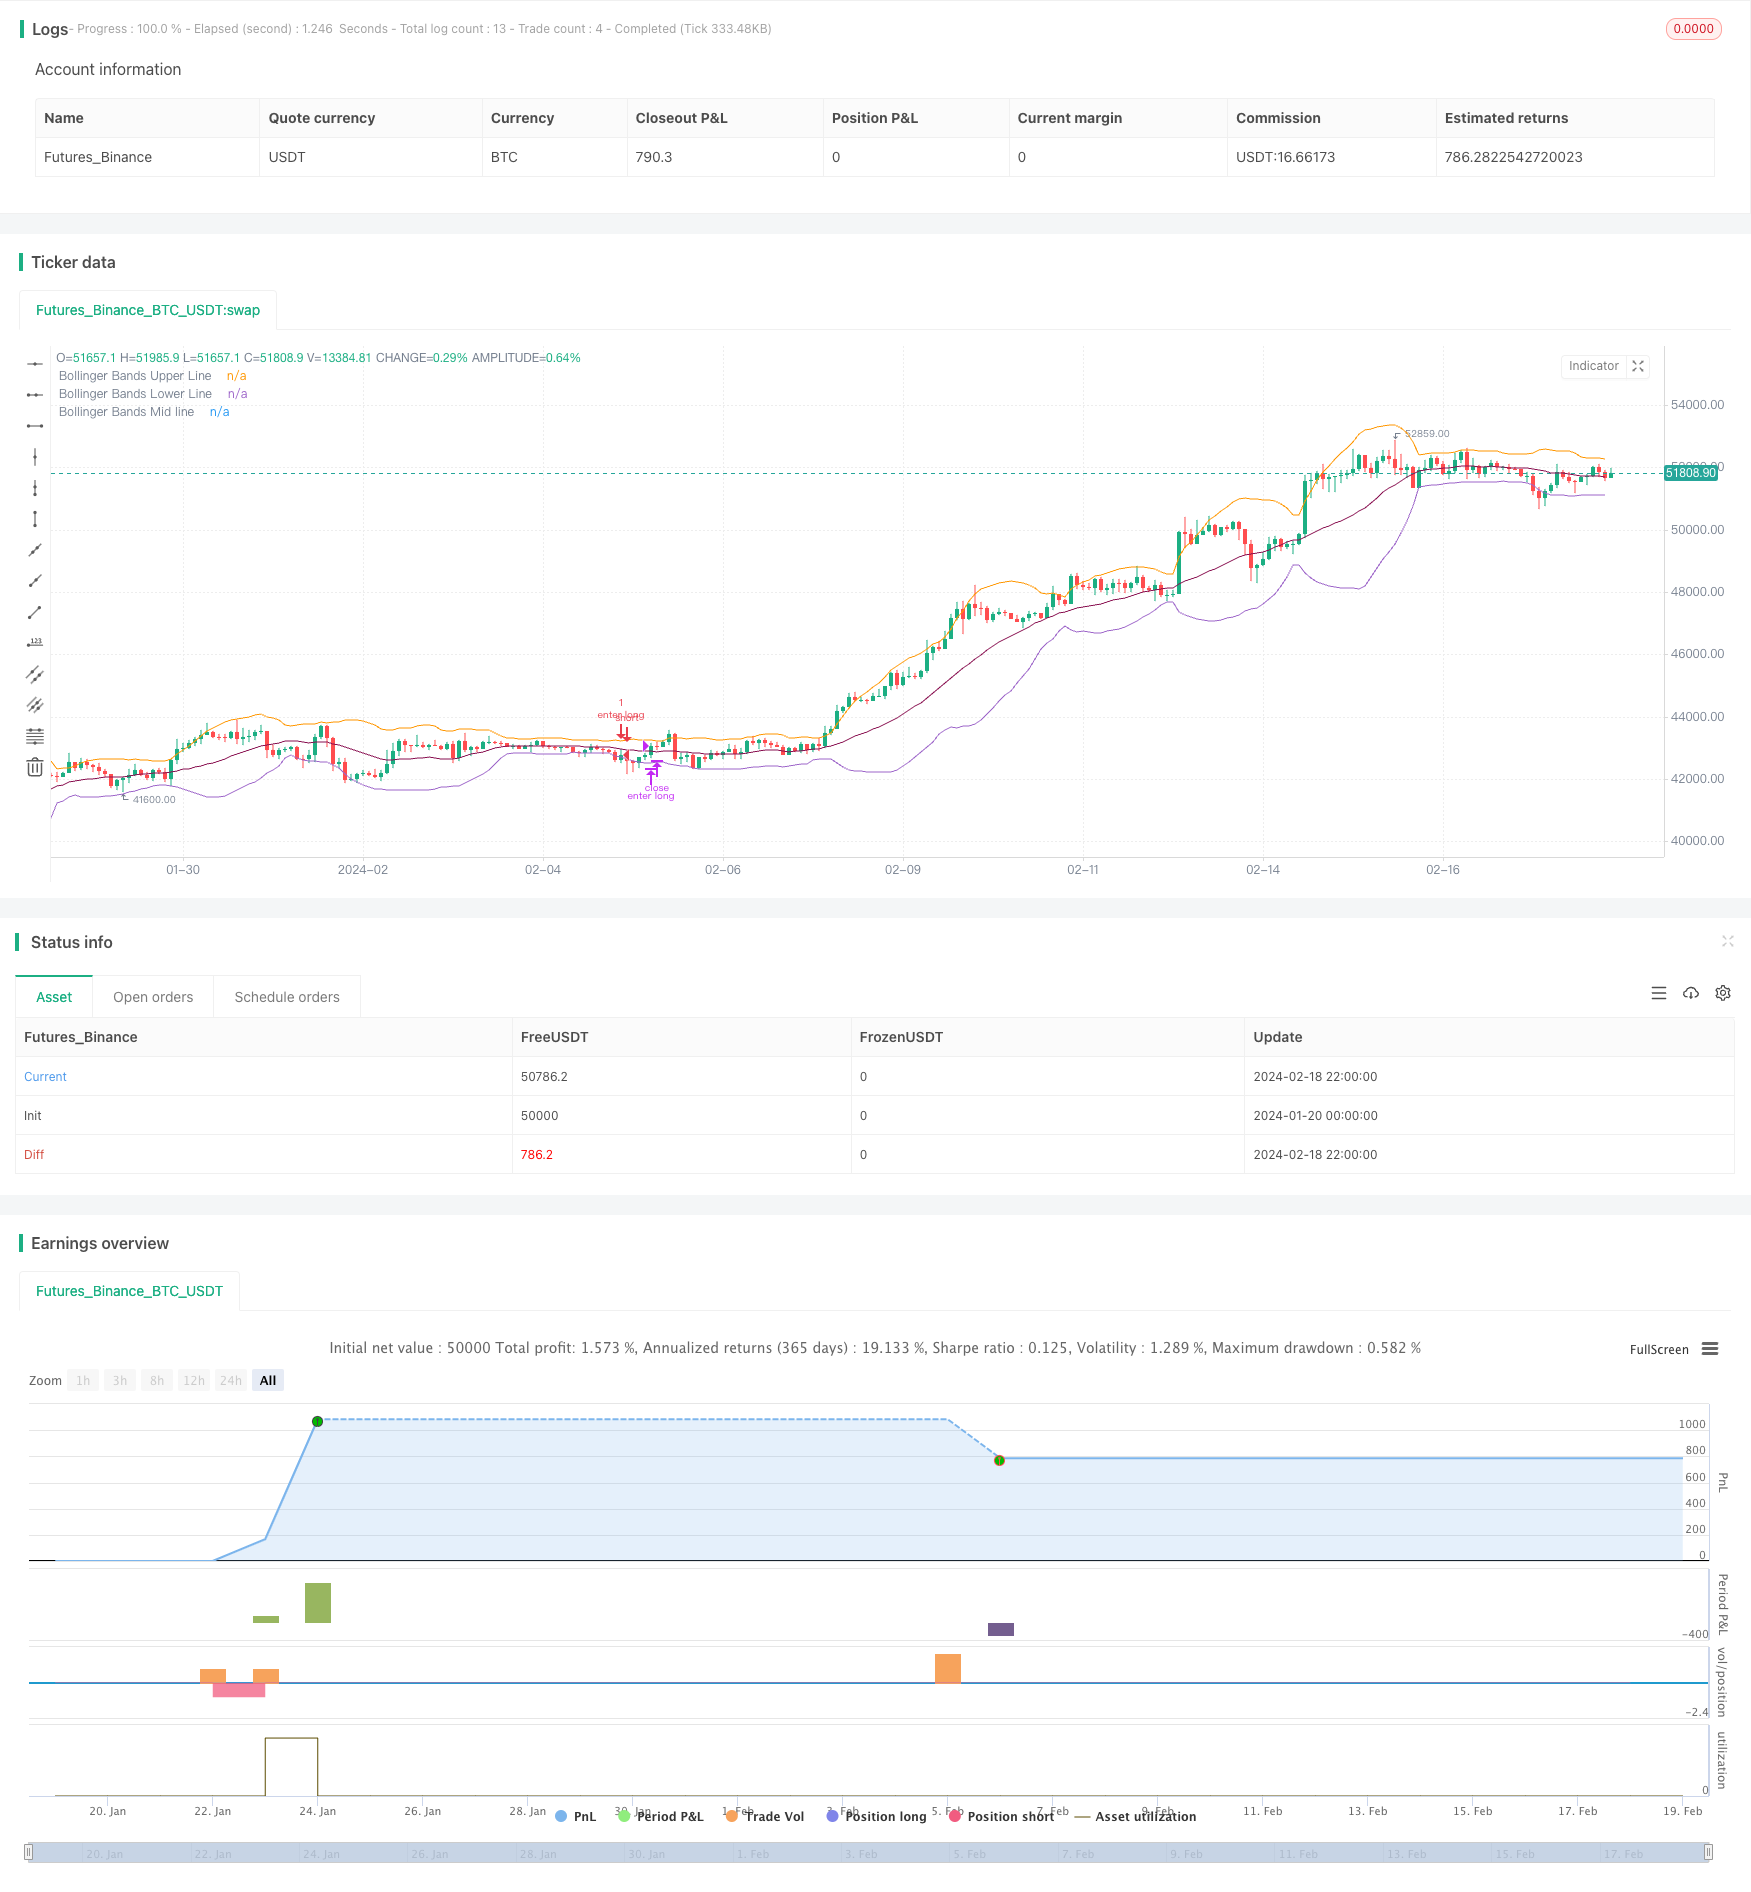
本策略是一个基于布林带和日内强度指数的均值回归策略。它利用价格突破布林带上下轨,结合交易量指标日内强度指数判断进场时机。具有策略优势包括:利用价格平均回归特性获利,结合量能指标过滤信号。但也存在回撤大,获利时间长等风险。
策略原理
该策略首先计算布林带的中轨、上轨和下轨。中轨为收盘价的简单移动平均线或指数移动平均线。上下轨则通过计算标准差,在中轨上下加减标准差的两倍构建。当价格突破下轨时看做均值回归的机会,采取多仓。当价格突破上轨时,看做价格过度偏离均值,采取空仓。
作为辅助判断指标,策略引入了日内强度指数。该指标结合了价格信息和成交量信息。当指数为正值时表示买入力量增强,作为多仓信号。当指数为负值时,表示卖出力量增强,作为空仓信号。
在开仓方面,策略同时需要价格突破布林带上下轨,和日内强度指数的判断指标。在止损方面,策略采取时间止损,如果超过一定周期后未获利,选择止损退出。
优势分析
该策略最大的优势在于,利用价格的平均回归特性来获利。当价格出现较大偏离后,依据统计规律,价格向均值中轴回归的概率较大,这为策略的运作提供了理论基础。
另一个优势在于,策略加入了成交量指标–日内强度指数,来过滤价格信号。成交量能证明价格信号的有效性。这避免了在一些价格剧烈震荡而成交量不足的情况下,产生错误信号。
风险分析
尽管该策略依赖价格平均回归这一概率事件来获利,但市场价格的随机游走也可能导致止损被触发,从而亏损。这是均值回归策略普遍面临的风险。
另一个主要风险在于,价格向均值回归本身是一个时间周期较长的过程。对投资者而言,资金可能会被套牢一段时间。这种时间风险可能导致投资者失去其他更佳投资机会。
优化方向
该策略可以从以下几个方面进行优化:
优化布林带参数,调整周期,标准差指标来适应不同市场的波动环境
尝试其他型的移动平均线,如线性加权移动平均线来提高平滑性
尝试其他型的成交量指标,寻找更好的量价确认信号
加入止损止盈策略,控制单个订单的最大损失
总结
本策略整体是一个典型的均值回归策略。依赖概率事件来获利,但风险也同样明显。通过参数调整,指标优化都可能获得更佳结果。但对投资者而言,正确把握这个策略的属性也是关键。
/*backtest
start: 2024-01-20 00:00:00
end: 2024-02-19 00:00:00
period: 2h
basePeriod: 15m
exchanges: [{"eid":"Futures_Binance","currency":"BTC_USDT"}]
*/

//@version=4
// This source code is subject to the terms of the Mozilla Public License 2.0 at https://mozilla.org/MPL/2.0/

// Bollinger Bands Strategy with Intraday Intensity Index
// by SparkyFlary

//For Educational Purposes
//Results can differ on different markets and can fail at any time. Profit is not guaranteed.
strategy(title="Bollinger Bands Strategy with Intraday Intensity Index", shorttitle="Bollinger Bands Strategy", overlay=true)

BBlength = input(20, title="Bollinger Bands length")
BBmaType = input("SMA", title="Bollinger Bands MA type", type=input.string, options=["SMA", "EMA"])
BBprice = input(close, title="source")
timeStop = input(10, title="Time-based stop length")
BBmult = input(2.0, title="Bollinger Bands Standard Deviation")
withIII = input(true, title="with Intraday Intensity Index?")
IIIlength = input(21, title="Intraday Intensity Index length")

//function for choosing moving averages
f_ma(type, src, len) =>
    float result = 0
    if type == "SMA"
        result := sma(src, len)
    if type == "EMA"
        result := ema(src, len)
    result

//Intraday Intensity Index
k1 = (2 * close - high - low) * volume
k2 = high != low ? high - low : 1
i = k1 / k2
iSum = sum(i, IIIlength)

//Bollinger Bands
BBbasis = f_ma(BBmaType, BBprice, BBlength)
BBdev = BBmult * stdev(BBprice, BBlength)
BBupper = BBbasis + BBdev
BBlower = BBbasis - BBdev

plot(BBupper, title="Bollinger Bands Upper Line")
plot(BBlower, title="Bollinger Bands Lower Line")
plot(BBbasis, title="Bollinger Bands Mid line", color=color.maroon)

//Strategy
buy = close[1]<BBlower[1] and close>BBlower and (withIII ? iSum>0 : 1)
sell = close>BBbasis or buy[timeStop] or (strategy.openprofit>0 and buy==0 and buy[1]==0 and buy[2]==0 and buy[3]==0)
short = close[1]>BBupper[1] and close<BBupper and (withIII ? iSum<0 : 1)
cover = close<BBbasis or short[timeStop] or (strategy.openprofit>0 and short==0 and short[1]==0 and short[2]==0 and short[3]==0)

strategy.entry(id="enter long", long=true, when=buy)
strategy.close(id="enter long", comment="exit long", when=sell)
strategy.entry(id="enter short", long=false, when=short)
strategy.close(id="enter short", comment="exit short", when=cover)